VPU Levels
- 指标
- Andriy Sydoruk
- 版本: 1.1
- 激活: 5
Looking for reliable levels on a price chart? Already tired of searching for similar indicators? Are the levels NOT working out as they should? Then this is the indicator for you.
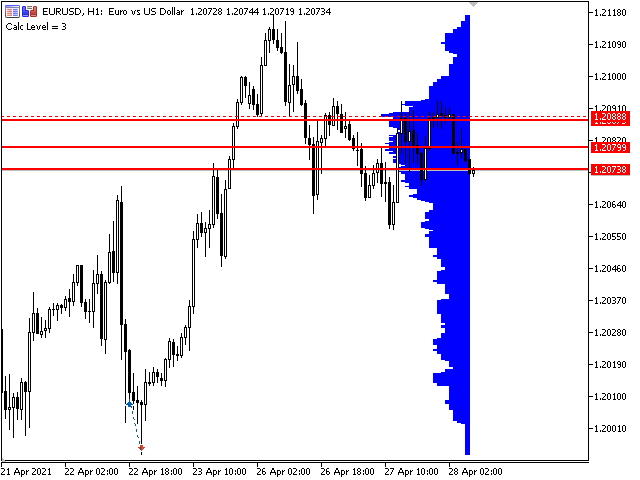
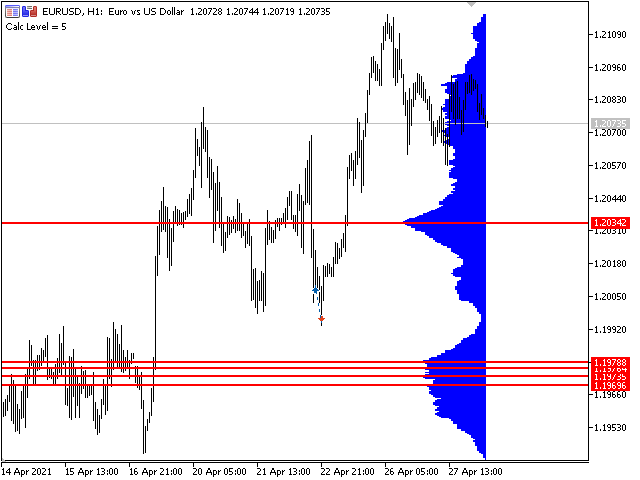
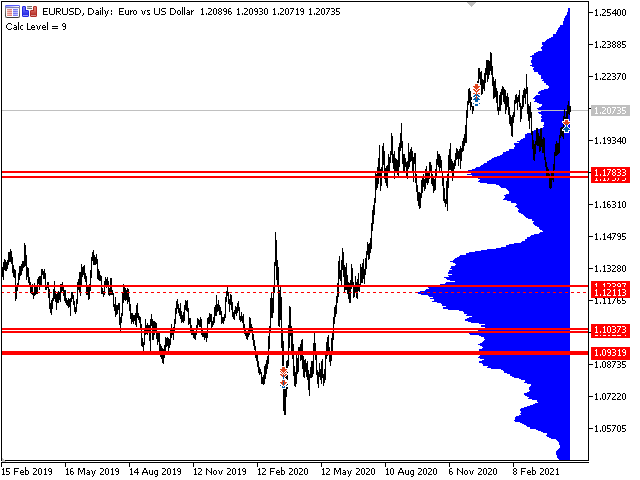
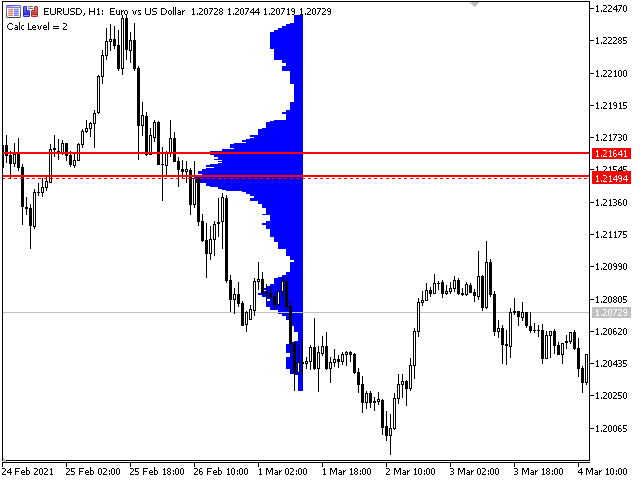
VPU Levels is a more advanced version of the Volume Prices Universal indicator. In this indicator, in addition to the histogram of horizontal volumes, the indicator itself determines the levels from which the user can work. The PeakLevel and Diffraction fields help to adjust the depth of reaction to the histogram and plotting levels.
VPU Levels is a reliable indicator of horizontal volumes. What does it show? First of all, the main idea of the indicator is to display at which price mark the price has been for the longest time. Thus, the display of price volumes on the price chart is formed. With the help of which you can very simply visually see the extremes of this chart, which primarily work as important levels. It can be as a well-defined extremum that will allow you to use a level from which you can work. Either an extremum with a wide top, which will set you a blurry level, is indistinct, or a certain corridor is a price interval and not a line. In any case, you get a tool that will allow you to see what really works and what ordinary indicators do NOT reflect.
How the indicator works. There are two key parameters: BackBars and BackBackBars. BackBars - sets the first bar from the price range, which is the indicator. BackBackBars - sets the number of bars. That is, the first bar and the number of bars are set. This means a certain period of time, on the basis of which the extrema chart will be formed and, as a result, the levels for the trader's work.
There is a bonus in the indicator. The basement displays the usual volumes, for comparison, if you somehow might need them.

