Support Resistance Breakout MT5
- 指标
- Temitayo Lawal
- 版本: 1.28
- 激活: 10
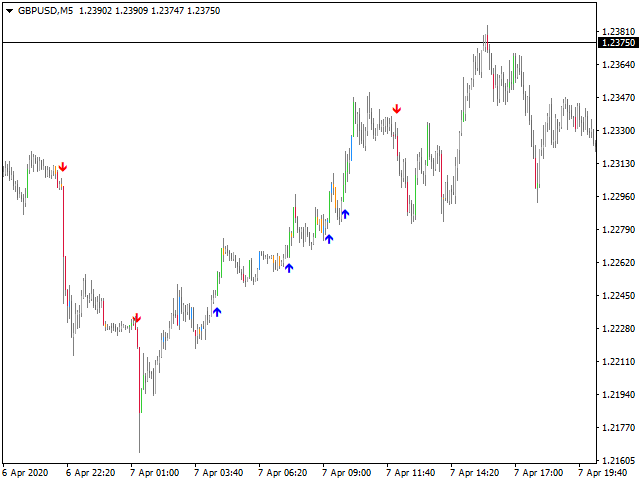
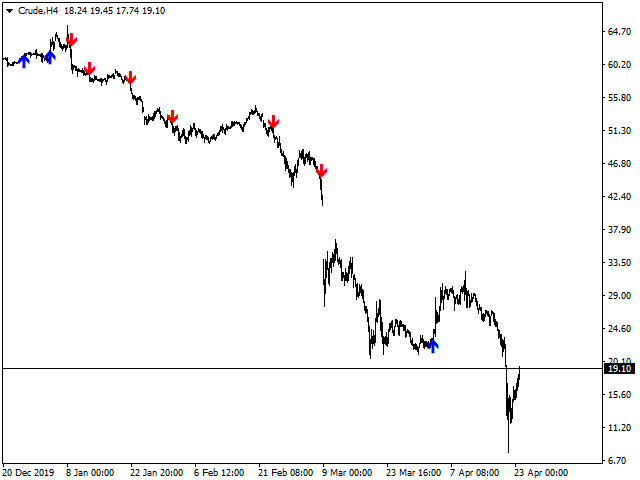
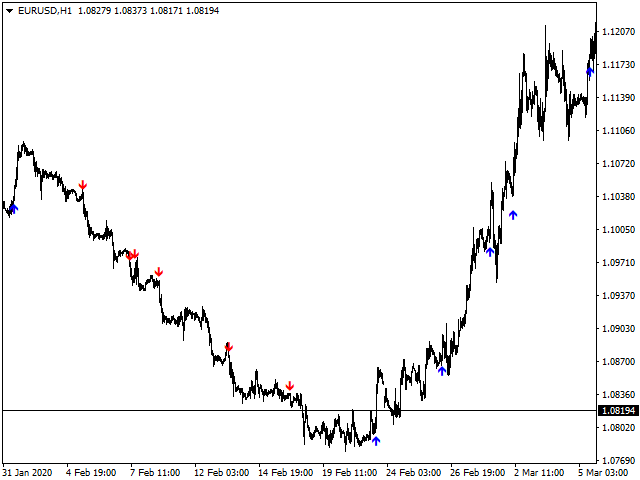
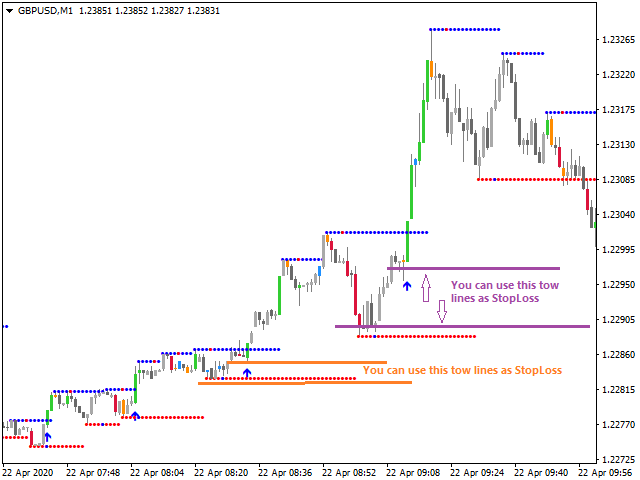
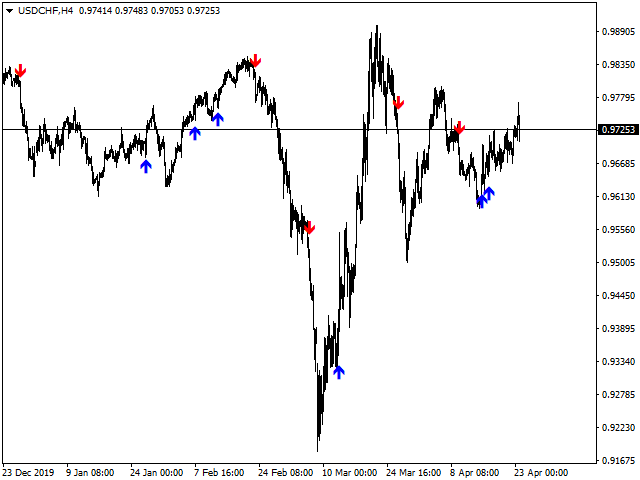
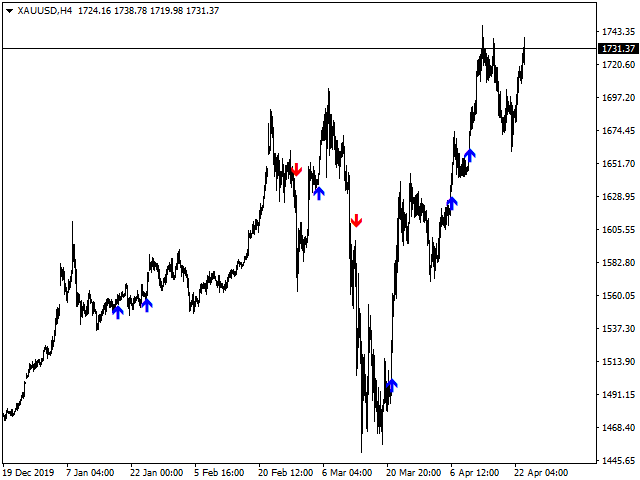
This indicator uses support and resistance, volume and some special formula to calculate the volume to filter the candles.
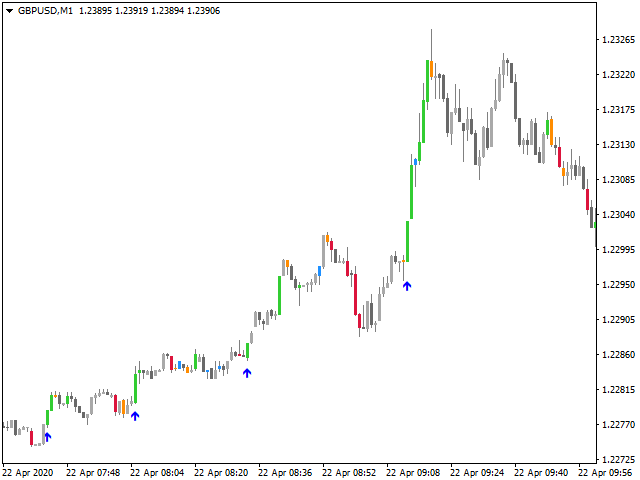
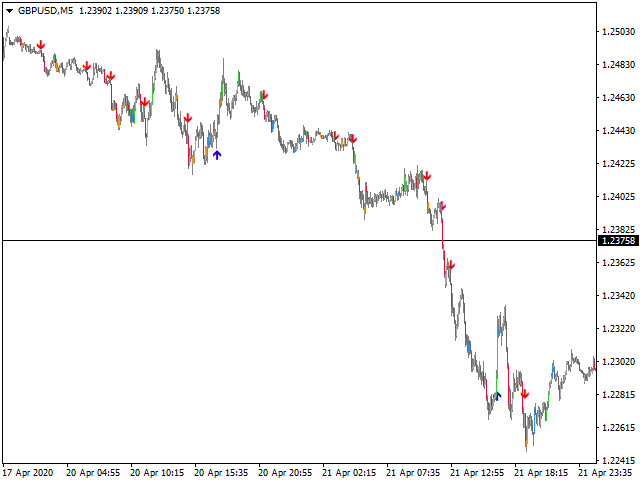
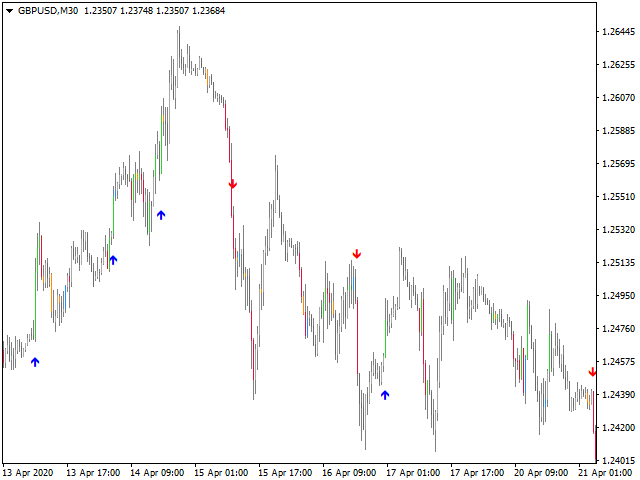
If the volume reaches a specific value, And at the same time, Candle breaks the support/resistance line, There would be a signal and we can enter the market.
Signals appear when the current candle closes. then you can enter the trade when a new candle appears. Please don't forget to follow your money management plan.
MT4 Version
Support/Resistance Breakout MT4 : https://www.mql5.com/en/market/product/65831
Indicator Capabilities:
- So simple.
- No Repaint, No Delay, No Lag
- Easy to use for non-experienced traders as well as professional traders.
- Low-risk entries.
- No other Indicator is needed.
- Popup Alerts, Push Notification, and Email alerts.
- Works with any symbols in any time frame.
- Can be used in Expert Advisors.
Indicator Parameters:
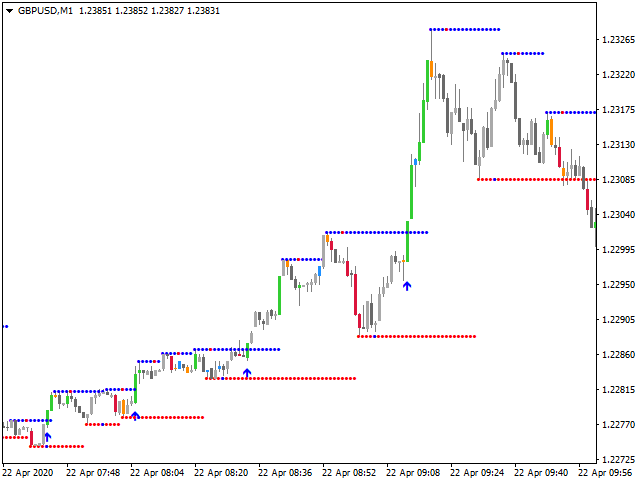
- Period to find Support/Resistance
- Final Signal Method (Rising, Exciting, Both)
- Draw Support and Resistance Line
- Show Fractals
- Show HigherHigh, HigherLow, LowerLow, LowerHigh
- Show Candle Types (Volume Analysis, Trend or None)
- Types of Alert