MultiTF trend function
- 指标
- Vasyl Temchenko
- 版本: 1.3
- 更新: 18 四月 2021
- 激活: 5
这是指标外壳中的一个函数。为指定数量的 TF(从 1 到 4)生成交易信号。不使用终端随附的指示灯。基本计算是使用 MACD 公式进行的,但使用的是经过修改的第三代 EMA(对趋势的突然变化反应更快)。
此外,功能:
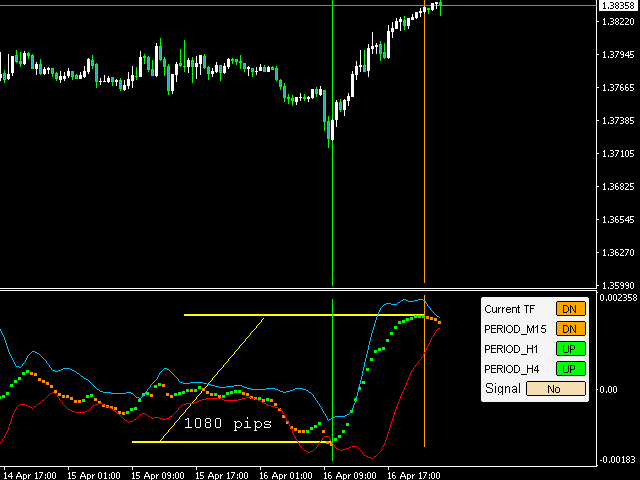
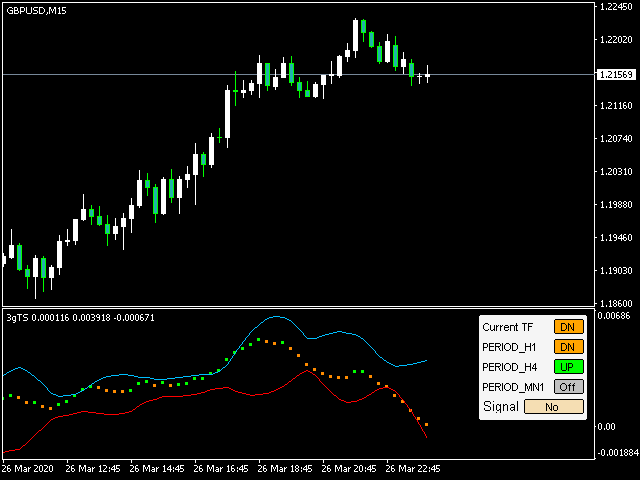
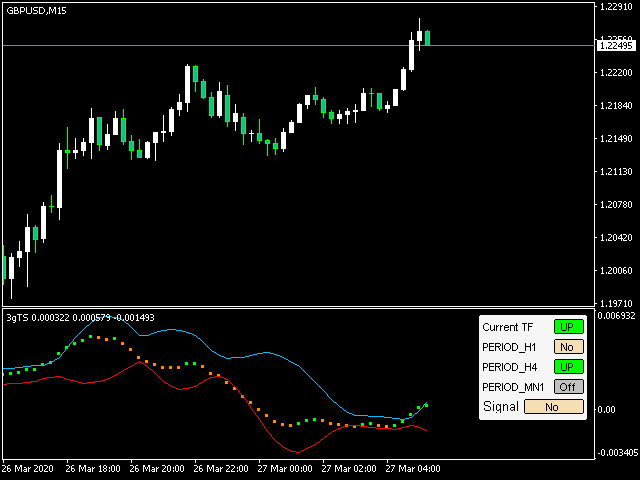
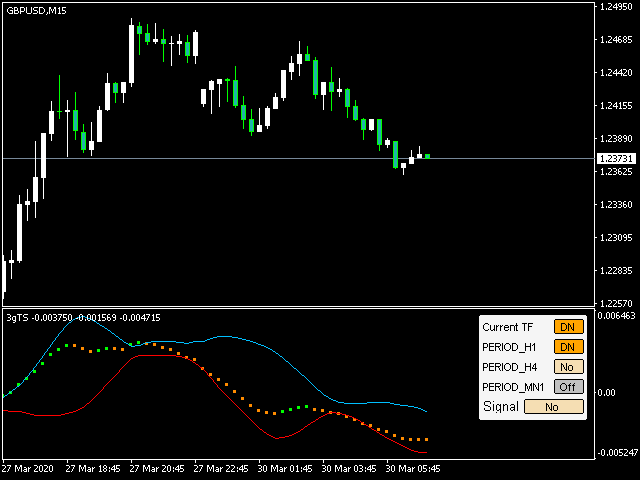
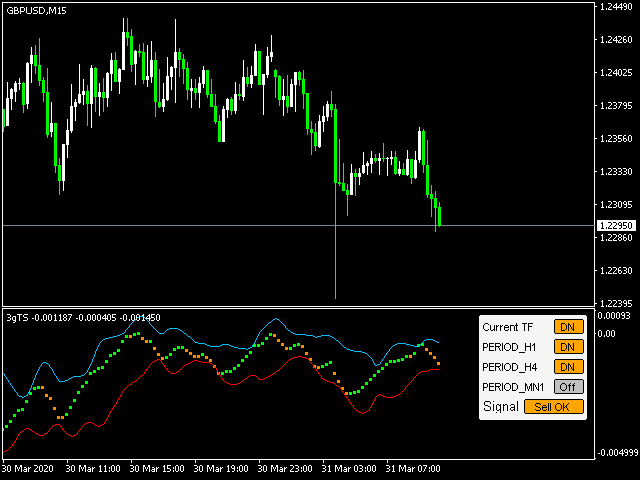
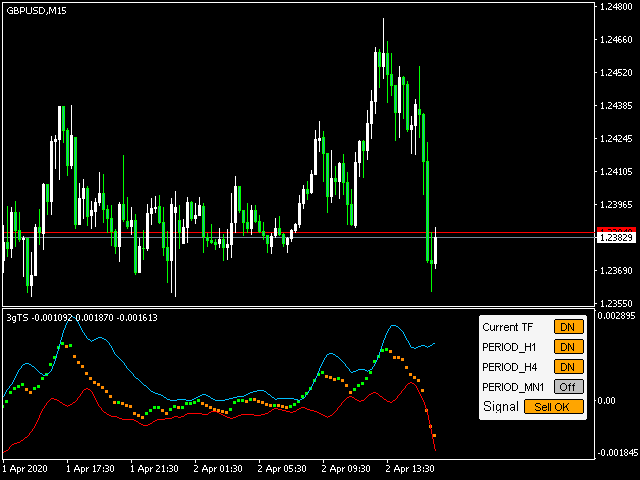
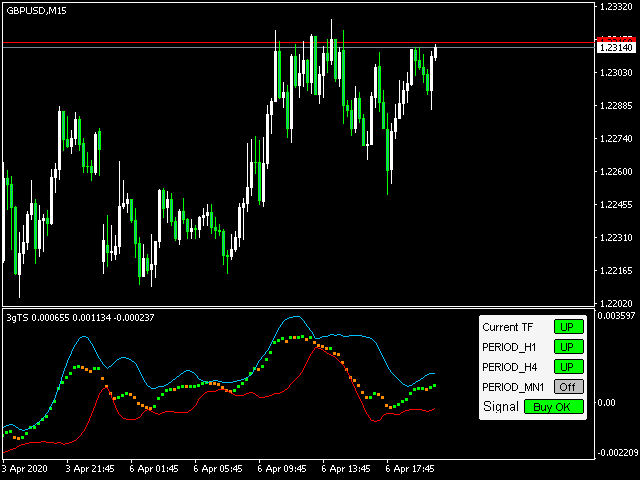
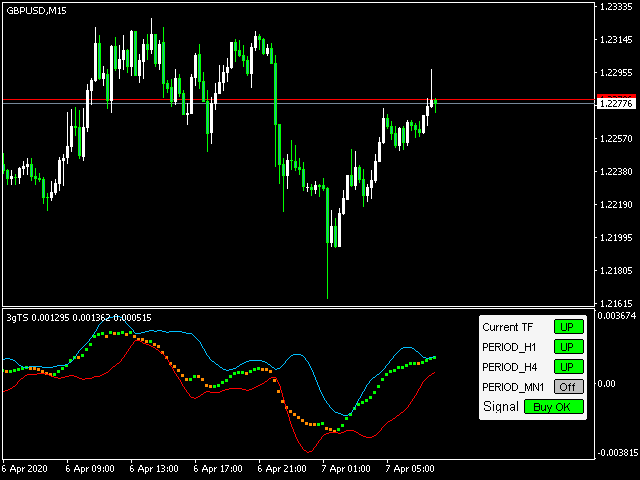
- 绘制两条显示趋势强度的波段。
- 检测趋势变化到相反的时刻,并通过警报和声音信号(如果允许)通知它。警报仅在趋势变化时弹出一次。如果至少有 2 个相同颜色的点,则为每个被监控的 TF 生成 UP 或 DN 信号。最终信号由所有允许的 TF 的指标形成。
可以关闭当前 TF 的信号 - 趋势将被绘制,但信号不会被考虑在内。这使您可以自由切换chart-TF以概览一般情况,而不会违反功能的正确性。我不建议让超过 2 个 TF 不必要地工作。或者允许一切,但在不等待最终上涨或下跌信号的情况下做出交易决定。在弱趋势(线之间的小差距,点几乎是水平的,颜色交替),我建议关闭盈利交易而不是交易。或者按照假定的趋势发展方向通过挂单进行交易。在强劲趋势下,允许交易市场订单
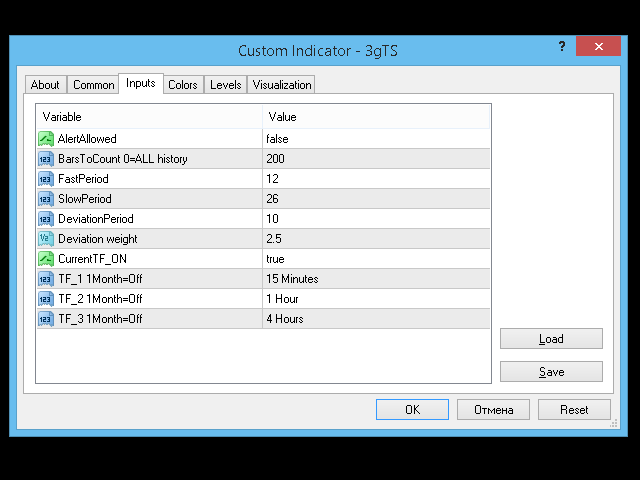
输入参数
- FastPeriod、SlowPeriod、DeviationPeriod、Deviation weight - 默认情况下的标准 MACD 参数。在绝大多数情况下,无需更改它们。
- CurrentTF_ON - 允许考虑当前 TF 的信号
- TF TF_1, TF_2, TF_3 - 选择小于 Monthly 的时段启用此 TF 的趋势控制
- BarsToCount - 限制查看历史的深度。切换 TF 时,较小的值会加快计算速度。 0 = 全文(不推荐)。
.