Multi Chart Crosshairs
- 指标
- Robert Gerald Wood
- 版本: 2.0
- 更新: 16 十一月 2023
- 激活: 10
This indicator is designed to make reviews of many charts on different timescales quicker, and easier to do.
- Track Time and Price across multiple charts
- Change Symbol on one chart and all other charts of the same symbol will be changed too.
- Easy to use, quick to master
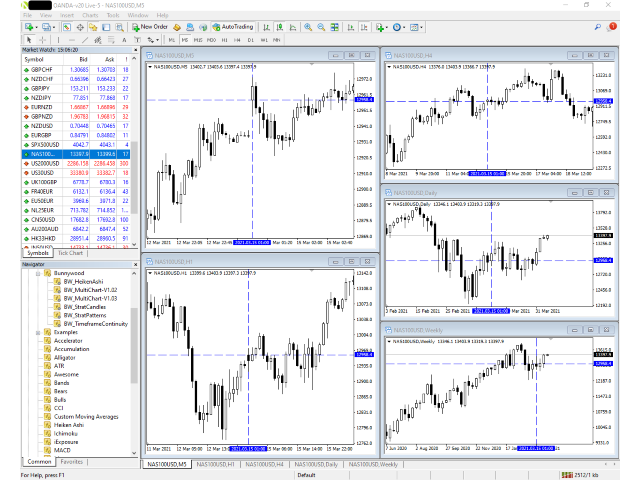
The indicator allows you to identify the price and time where the mouse pointer is on the current chart, across all other charts open on the same Symbol. This allows you to quickly see information on multiple charts whereas normally you have to spend some time identifying the same location.
You can also choose to track just Time across all open charts. This allows you to easily navigate when divergence hunting.
Should you change the Symbol in one chart, all the other charts of the same symbol will switch to the new Symbol, keeping their timeframe settings.
How to Use
When reviewing a chart, I like to look at several timeframes to identify trends and trading levels. I created this tool to help with that, and also for visual back testing, where I'm looking across several charts over an extended period.
The tool adds a crosshair to the screen which follows the mouse pointer. It is activated when either the CTRL or SHIFT key is down, so it's not always there, but is when you want it.
Once activated, you can point on any chart where you want to track, and on any other chart with the same Symbol, the crosshair will show the same time and price on that chart too. Charts in other windows will automatically scroll the display so that the time/price combination is central to the display.
You can add drawing elements to the chart with out affecting the crosshairs which remain visible until you press the ESC key. Once pressed, the ESC key causes the crosshairs to be hidden again until you need them again.
Demonstration
Please review the video that shows the indicator in use.
Hope you find it as useful as I do.
Thank you for your interest!


Very good indicator. Easy and very usefull for chart analytic. Thank you