EUR 5 of 8
- 专家
- Tomas Michalek
- 版本: 1.0
- 激活: 10
Plug & Play portfolio - series of high-quality EURUSD H1 strategies for maximized success.
The fifth strategy from the EUR-8 portfolio uses the direction of the MACD indicator for recognizing the trend and then set the pending order according to KeltnerChannel.
This fully automatic EA was Triple tested - backtest on 'Out of sample data', robustness tests and portfolio correlation.
Easy set-up. You define only risk amount and you are good to go.
| Learn why I do Monte Carlo, robustness and optimization profile and system parameter permutation tests on my EA's before I publish them. |
|---|
Benefits for you
Plug & Play system, so you don't have to read long blog or study excessive technical description, only to be able to run the strategy. Just attach it to the chart and let this strategy works for you.
Every position has predefined stoploss with configurable fixed amount (you can risk fixed percentage of your initial balance).
Strategy is developed by genetic algorithms on long data period (developed on 'in sample' and tested on 'out of samle') and it passed all 9 robustness tests, so the quality of the strategy is verified.
Technical parameters
· CustomComment - choose your comment to distinguish strategy, or keep default
· MagicNumber - choose your number to distinguish strategy, or keep default
· mmRiskedMoney - configurable fixed stoploss amount, so you can risk only portion of your initial balance. 100 $ by default.
Screenshots description
· Portfolio equity: combined backtest of all strategies together, for years 2003 to 2020.
· Portfolio parts equity: particular equities of strategies from the portfolio EUR-8, for years 2003 to 2020.
· Portfolio statistics: see the portfolio statistics from 2003 to 2020. You can see details like number of trades, return to drawdown ration and other parameters.
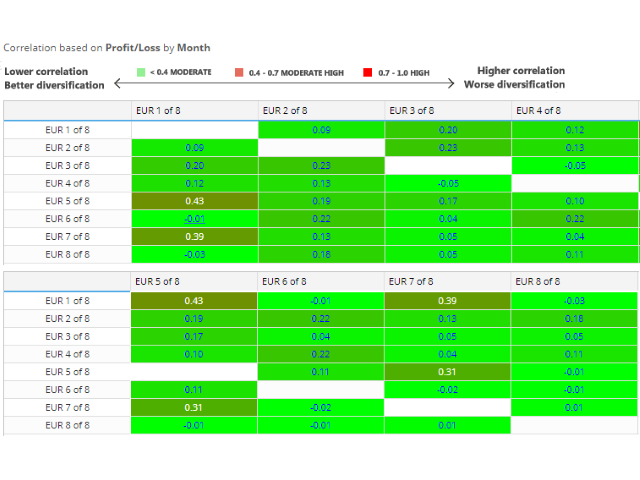
· Portfolio correlation: if two or more strategies have losses at the same month, it is not good for the portfolio. Portfolio correlation has to be taken seriously - see that no strategies correlate above 0.5, which means low correlation.
· Strategy equity: backtest of the strategy, tested on the data from Dukascopy, from 2003 to 2020.
· Strategy statistics: see the detailed statistics of the strategy backtest from 2003 to 2020.
· Monte Carlo analysis - randomized slippage, spread and historical data: simulation of real market conditions and test of strategy sensitivity to market volatility and liquidity. Lines similar to original backtest means good robustness of the strategy.
· Monte Carlo analysis - randomized trades order: test, which tells us whether the strategy is sensitive to specific market cycles. According to the picture, the strategy is not sensitive to the specific order of trades.
· Monte Carlo analysis - randomized strategy parameters: test against over-fitted strategy, which proves, that strategy is not over-fitted, as it has great backtest results even with changed parameters.
· Walk-forward matrix - complex series of simulations, where we optimize strategy parameters based on one period and then do the backtest on another period, comparing whether results are profitable. These steps are then repeated for the next time periods, which leads to the creation of a matrix of executed tests. The goal of this test is to find out, whether the strategy is over-fitted. If strategy won't work with slightly different parameters, it is most probably over-fitted and won't work in the future. You can see on the screenshot that the strategy was profitable for a lot of various optimization iteration on historical data.
· Classic Metatrader 5 report for 10 years: you can see clear results of the backtest with 99% model quality.

