Euro Fx Vix MT5
- 指标
- Manuel Alejandro Cercos Perez
- 版本: 4.0
- 更新: 14 七月 2022
- 激活: 20
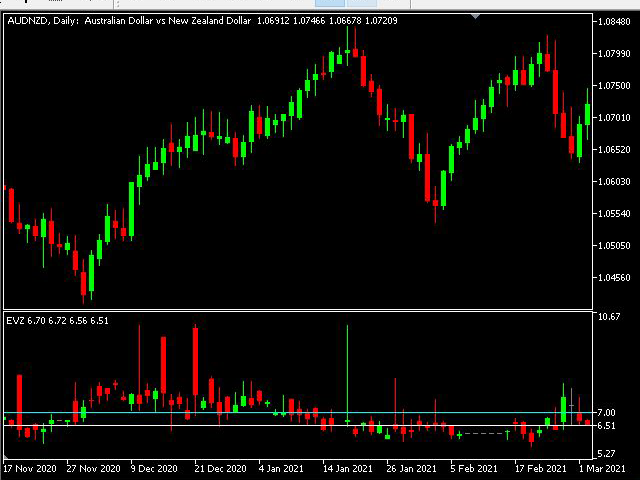
这个波动率指标对检测死市很有用。它基于EVZ指数,衡量欧元的波动性(但也可以应用于整个外汇市场)。高值代表市场的高成交量/波动性。如果它低于7,成交量低,交易时的风险更大。
对于使用No Nonsense Forex(NNFX)方法的交易者来说,这个指标对于回溯测试算法和测量EVZ对它们的影响很有用,或者只是在交易时能够直接在图表中读取。
下载 EVZ Reader(免费)以获得该指标正常工作所需的数据。
特点
- 该指标读取由EVZ阅读器程序检索的数据,这是该指标工作的必要条件。如果阅读器在一个图表中处于激活状态,EVZ几乎可以得到实时更新。
- 该指标的多个实例可以放置在几个图表中,而没有性能问题。
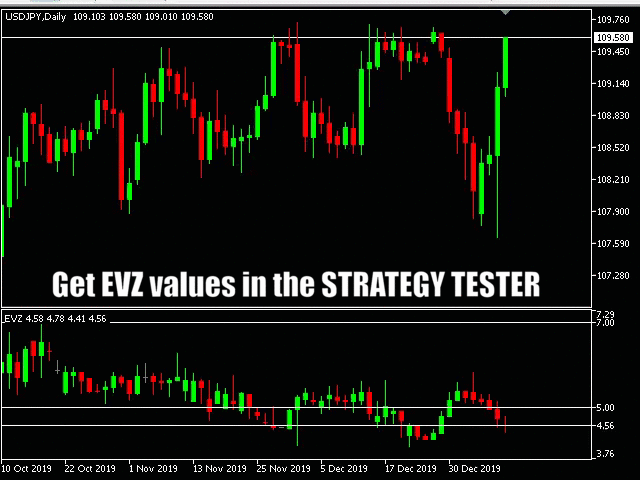
- 该指标在策略测试器中工作,其数值可以像其他指标一样被访问。
- 2008年8月以后,没有EVZ的数据。
- 有一些日子,外汇市场开盘,但不是EVZ。在这种情况下,会用最后一次EVZ收盘的价值创建一个平烛。
你也可以下载MetaTrader4的欧元外汇VIX。