• 概述
  • 评论 (14)
  • 评论 (19)

Weis Waves RSJ

4.56

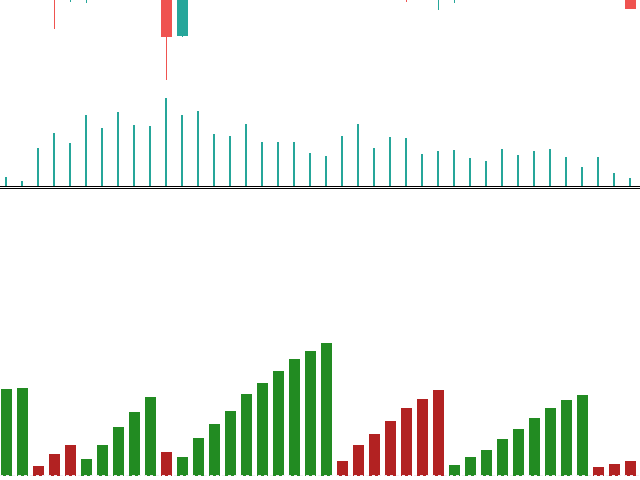
The Weis Waves RSJ Indicator sums up volumes in each wave.

This is how we receive a bar chart of cumulative volumes of alternating waves.

Namely the cumulative volume makes the Weis wave charts unique.

It allows comparing the relation of the wave sequence characteristics, such as correspondence of the applied force (expressed in the volume) and received result (the price progress).


If you still have questions, please contact me by direct message: https://www.mql5.com/en/users/robsjunqueira/


评论 14
Alessandro Lopes Da Silva
274
Alessandro Lopes Da Silva 2024.02.26 19:16 
 

Pessoal deixo aqui meu comentário e espero contribuir com voces! Esse indicador juntamente com medias moveis 9,21,50 no ativo US30 é uma maquina de fazer dinheiro, principalmente para quem trabalha com mesa proprietária. O melhor horário para operar é o de New York, excelentes gatilhos de entradas e saídas. Observação importante, procure sempre ir a favor da tendencia. No demais, muito obrigado Roberto Junqueira!!!

fj6hCuoc
119
fj6hCuoc 2023.09.12 09:46 
 

An excellent Volume Indicator

CARLOS CESTARI
33
CARLOS CESTARI 2022.03.31 05:12 
 

Muito bom, fica melhor se for usado junto com o Heiken_Ashi. Obrigado.

推荐产品
Weis Waves
Flavio Javier Jarabeck
2.83 (18)
The original author is David Weis, an expert in the Wyckoff Method. The Weis Wave is a modern adaptation of the 1930's Wyckoff Method, another expert in Tape Reading techniques and Chart Analysis. Weis Waves takes market volume and stacks it into waves according to price conditions giving the trader valuable insights about the market conditions. If you want to learn more about this subject you can find tons of videos in YouTube. Just look for "The Wickoff Method", "Weis Wave" and "Volume Spread
FREE
Value Chart Candlesticks
Flavio Javier Jarabeck
4.73 (11)
The idea of a Value Chart indicator was presented in the very good book I read back in 2020 , " Dynamic Trading Indicators: Winning with Value Charts and Price Action Profile ", from the authors Mark Helweg and David Stendahl. The idea is simple and the result is pure genius: Present candlestick Price analysis in a detrended way! HOW TO READ THIS INDICATOR Look for Overbought and Oversold levels. Of course, you will need to test the settings a lot to find the "correct" one for your approach. It
FREE
Waves Sizer
Flavio Javier Jarabeck
3.67 (6)
Wyckoff fans, enjoy! Ideally to be used with the Weis Waves indicator, but it can be easily used alone, the Waves Sizer puts the range (in resulting Price movement) done by the Price on its market swings. You can control how accurate or loose will be the swings. This tool is very helpful for visually know how much the Price has traveled in your Timeframe. This way you can confront this level of effort with the resulting Volume, etc... Weis Waves indicator: https://www.mql5.com/en/market/produc
FREE
Big Player Candles
Flavio Javier Jarabeck
4.91 (23)
If you heard about The Wyckoff Method, Volume Spread Analysis, etc... You are probably searching for the candlestick indicator that shows you the Volume spread all over the current bar, signaling every types of market status... You can control the several Market Levels with custom colors... It is up to you to decide how to use it. Our job is provide you with the indicator... If you like this indicator, all I am asking is a little Review (not a Comment, but a REVIEW! )...    This will mean A LO
FREE
Stackable VWAP
Flavio Javier Jarabeck
3.5 (4)
Volume Weighted Average Price (VWAP) is a trading benchmark commonly used by Big Players that gives the average price a Symbol has traded throughout the day. It is based on both Volume and price. Additionally we put in this indicator the MVWAP (Moving Volume Weighted Average Price). For those who do not know the usage and the importance od this indicator I recommend a great article about this subject at Investopedia ( https://www.investopedia.com/articles/trading/11/trading-with-vwap-mvwap.asp
FREE
Basic Vwap
james mugendi
Simple Vwap with the daily, weekly and monthly VWAP is the abbreviation for   volume-weighted average price , which is a technical analysis tool that shows the ratio of an asset's price to its total trade volume. It provides traders and investors with a measure of the average price at which a stock is traded over a given period of time. How it's used Identify entry and exit points:   Traders can use VWAP to determine when to buy or sell an asset.   Understand price trends :  Traders can use V
FREE
Tabajara V5
Flavio Javier Jarabeck
4.82 (34)
Metatrader 5 version of the famous Andre Machado's Tabajara indicator. If you don't know Andre Machado's Technical Analysis work you don't need this indicator... For those who need it and for those several friend traders who asked this porting from other platforms, here it is... FEATURES 8-period Moving Average 20-period Moving Average 50-period Moving Average 200-period Moving Average Colored candles according to the inflexion of the 20-period MA SETTINGS You can change the Period of all MA's
FREE
Quantitative Candlesticks Qstick
Flavio Javier Jarabeck
4 (2)
Qstick is a way to objectively quantify candlestick analysis and improve the interpretation of candlestick patterns. Qstick was developed by Tushar Chande and published in his book " The New Technical Trader - Boost Your Profit by Plugging Into the Latest Indicators (1994) ". Qstick is built based on a moving average of the difference between the Open and Close prices. The basis of the idea is that the Opening and Closing prices are the heart of candlestick analysis. We strongly recommend the re
FREE
Aggression Volume
Flavio Javier Jarabeck
4.14 (14)
Aggression Volume Indicator is the kind of indicator that is rarely found in the MQL5 community because it is not based on the standard Volume data provided by the Metatrader 5 platform. It requires the scrutiny of all traffic Ticks requested on the platform... That said, Aggression Volume indicator requests all Tick Data from your Broker and processes it to build a very special version of a Volume Indicator, where Buyers and Sellers aggressions are plotted in a form of Histogram. Additionally,
FREE
MIDAS Super VWAP
Flavio Javier Jarabeck
4.44 (9)
Imagine VWAP, MVWAP and MIDAS in one place... Well, you found it! Now you can track the movement of Big Players in various ways, as they in general pursue the benchmarks related to this measuring, gauging if they had good execution or poor execution on their orders. Traders and analysts use the VWAP to eliminate the noise that occurs throughout the day, so they can measure what prices buyers and sellers are really trading. VWAP gives traders insight into how a stock trades for that day and deter
FREE
Aggression Wave RSJ
JETINVEST
4.83 (6)
This indicator sums up the difference between the sells aggression and the buys aggression that occurred in each Candle, graphically plotting the waves of accumulation of the aggression volumes.   Through these waves an exponential average is calculated that indicates the direction of the business flow. Note: This indicator DOES NOT WORK for Brokers and/or Markets WITHOUT the type of aggression (BUY or SELL).   Be sure to try our Professional version with configurable features and alerts:  Agre
FREE
LT Donchian Channel
Thiago Duarte
4.83 (6)
Donchian Channel is an indicator created by Richard Donchian. It is formed by taking the highest high and the lowest low of the last specified period in candles. The area between high and low is the channel for the chosen period. Its configuration is simple. It is possible to have the average between the upper and lower lines, plus you have alerts when price hits one side. If you have any questions or find any bugs, please contact me. Enjoy!
FREE
Simple Weis Wave
Jean Jacques Huve Ribeiro
3.67 (3)
One of the best tools for analyzing volume, Weis Wave was idelized by David Weis, to facilitate the reading of directional flow. For the VSA method disciples it is an evolution of the practices created by Richard Wycoff, facilitating a predictive reading of the market, always seeking an accumulation and distribution of the negotiated contracts. Cumulative wave volume  Range of wave ( removed) Average Wave volume Ref "Tim Ord lectures" ( removed)
FREE
VisualVol EURUSD
Maxim Kuznetsov
The indicator highlights the points that a professional trader sees in ordinary indicators. VisualVol visually displays different volatility indicators on a single scale and a common align. Highlights the excess of volume indicators in color. At the same time, Tick and Real Volume, Actual range, ATR, candle size and return (open-close difference) can be displayed. Thanks to VisualVol, you will see the market periods and the right time for different trading operations. This version is intended f
FREE
VWAP and MVWAP
Flavio Javier Jarabeck
4.17 (6)
Volume Weighted Average Price (VWAP) is a trading benchmark commonly used by Big Players that gives the average price a Symbol has traded throughout the day. It is based on both Volume and price. Additionally we put in this indicator the MVWAP (Moving Volume Weighted Average Price). For those who do not know the usage and the importance od this indicator I recommend a great article about this subject at Investopedia ( https://www.investopedia.com/articles/trading/11/trading-with-vwap-mvwap.asp )
FREE
Wave Box Market Frenquency
Jean Jacques Huve Ribeiro
4.75 (4)
Totally linked to the result of a movement and the duration he had. Its height records how many ticks the asset walked during a given movement, its width shows us the duration that movement had. Its configuration must be in line with the Weis Wave Indicator configuration to observe the movement force and can indicate a possible accumulation or distribution of the movement;
FREE
FVGs
Andrii Hurin
5 (9)
A simple indicator that automatically highlights all FVGs (Fair Value Gaps) formed on the chart, as well as FVGs on history. It is possible to select colors for FVGs of different directions (long or short), select the time interval, select the color of middle point and you can also choose whether to delete filled FVGs or leave them on the chart (the option is beneficial for backtesting). The indicator can be very useful for those, who trade according to the concept of smart money, ICT, or simply
FREE
Rainbow MT5
Jamal El Alama
4 (1)
Description : Rainbow MT5 is a technical indicator based on Moving Average with period 34 and very easy to use. When price crosses above MA and MA changes color to green, then this is a signal to buy. When price crosses below MA and MA changes color to red, then this is a signal to sell. The Expert advisor ( Rainbow EA MT5 ) based on Rainbow MT5 indicator is now available here . MT4 version is available here .
FREE
Midas VWAP
Paulo Henrique Faquineli Garcia
4 (1)
Volume Weighted Average Price (VWAP) is a trading benchmark commonly used by Big Players that gives the average price a Symbol has traded throughout the day. It is based on both Volume and price. This indicator contains Daily VWAP and MIDAS' VWAP, which means you are able to anchor the beggining of MIDAS' calculations and, therefore you will be able to use this methodology to study price versus volume moves after anchor point. You will be able to anchor up to 3 HIGH MIDAS VWAP's and 3 LOW. Wish
FREE
Follow The Line MT5
Oliver Gideon Amofa Appiah
4.52 (29)
This indicator obeys the popular maxim that: "THE TREND IS YOUR FRIEND" It paints a GREEN line for BUY and also paints a RED line for SELL. (you can change the colors). It gives alarms and alerts of all kinds. IT DOES NOT REPAINT and can be used for all currency pairs and timeframes. Yes, as easy and simple as that. Even a newbie can use it to make great and reliable trades. NB: For best results, get my other premium indicators for more powerful and reliable signals. Get them here: https://www.m
FREE
Haven FVG   指标是一款市场分析工具,可在图表上突出显示低效区域(公平价值缺口,FVG),为交易者提供关键水平,以便进行价格分析和交易决策。 其他产品 ->  点击这里 主要特点: 自定义颜色设置: 多头 FVG 颜色   (Bullish FVG Color)。 空头 FVG 颜色   (Bearish FVG Color)。 灵活的 FVG 可视化: FVG 搜索的最大蜡烛数量。 FVG 区域可额外延伸指定数量的 K 线。 可选启用 FVG 填充。 中线(Middle Line): 可选择线条颜色和样式(例如虚线)。 可调整线条厚度,以提高精确度。 通用设置: 将 FVG 扩展到当前 K 线。 排除历史 FVG,并填充突出当前数据。 一种简单而有效的方法,可分析图表上的低效区域,并做出明智的交易决策。
FREE
Haven Key Levels PDH PDL
Maksim Tarutin
5 (2)
指标   "Haven Key Levels PDH PDL"   帮助交易者在图表上可视化关键水平。它会自动标记以下水平: DO (Daily Open)   — 当日开盘水平。 NYM (New York Midnight)   — 纽约午夜水平。 PDH (Previous Day High)   — 前一日的最高点。 PDL (Previous Day Low)   — 前一日的最低点。 WO (Weekly Open)   — 当周开盘水平。 MO (Monthly Open)   — 当月开盘水平。 PWH (Previous Week High)   — 上一周的最高点。 PWL (Previous Week Low)   — 上一周的最低点。 其他产品 ->  点击这里 工具定制选项: 选择颜色和线条粗细: 设置以下水平的颜色:   NYM, DO, WO, MO, PDH, PDL, PWH, PWL。 调整线条粗细。 水平线可见性控制: 启用或禁用以下水平线的显示:   NYM, PDH, PDL, DO, WO, MO, PWH, PWL。 显示   DO  
FREE
Server Clock
Flavio Javier Jarabeck
5 (4)
Many friends asked me for a simple, non-obtrusive, resource-friendly clock to track the time during their trades. It seems pretty obvious, but it is a must-have for those trading the market manually, waiting for the Market News, or just to visually know what time it is... Trading is an absorbing endeavor! So, here it is... Totally configurable, including Font Type, Font Size and Chart Location: Upper Left/Center/Right OR Lower Left/Center/Right, with a little twist of adjusting the Offset, just
FREE
Donchian Pro
Paulo Henrique Faquineli Garcia
5 (3)
The Donchian Channel Channels are among the most popular tools of technical analysis, as they visually convey to the analyst the limits within which most price movement tends to occur. Channel users know that valuable information can be obtained at any time, whether prices are in the central region of a band or close to one of the border lines. One of the best known techniques to explore these concepts is Bollinger Bands. However, John Bollinger was not the only one to research the application
FREE
Introduction This indicator detects volume spread patterns for buy and sell opportunity. The patterns include demand and supply patterns. You might use each pattern for trading. However, these patterns are best used to detect the demand zone (=accumulation area) and supply zone (=distribution area). Demand pattern indicates generally potential buying opportunity. Supply pattern indicates generally potential selling opportunity. These are the underlying patterns rather than direct price action. T
FREE
Trendline mt5 indicator
David Muriithi
3 (1)
Are you tired of drawing trendlines every time you're analyzing charts? Or perhaps you would like more consistency in your technical analysis. Then this is for you. This indicator will draw trend lines automatically when dropped on a chart. How it works Works similar to standard deviation channel found on mt4 and mt5. It has 2 parameters: 1. Starting Bar 2. Number of bars for calculation The   starting bar   is the bar which drawing of the trend lines will begin, while the   number of bars for c
FREE
White Weis Volume Ticks
Ricardo Almeida Branco
5 (4)
White Weis Volume This indicator shows the sum of the volume in each wave, bulish or bearish, as idealized by David Weis , but it brings an important addition , which is the marking of the bar with the highest volume of the wave (White Bar)! In coding the indicator, it was sought to optimize the code to require minimal processing during use and not to overload mt5. The indicator can be used for pre-trading analysis and study, where the trader analyzes possible points of support and resistance
RSI on Moving Average Indicator for MT5 Introduction The RSI on MA Indicator integrates Moving Average Crossovers with the Relative Strength Index (RSI) to enhance trend detection and momentum analysis. By merging these technical elements, it improves precision in identifying market movements. The indicator displays two oscillating lines ranging from 0 to 100, making it easier to pinpoint buy and sell opportunities while clarifying trend directions. RSI on Moving Average Indicator Specification
FREE
Daily High Low Danilo Monteiro
Danilo Hudson Couto Monteiro
# Indicador Daily High - Danilo Monteiro - MT5 ## Descrição O Daily High/Low Labels é um indicador personalizado para MetaTrader 5 que exibe automaticamente as máximas e mínimas diárias no gráfico, facilitando a identificação rápida dos níveis importantes de preço. O indicador marca os preços com etiquetas e linhas horizontais, permitindo uma visualização clara dos níveis críticos do dia atual e anterior. ## Principais Características ### 1. Marcação Automática - Exibe automaticamente as máxi
FREE
VWAP Indicator
LUC JACOBUS A VERHEECKE
4.13 (23)
Volume Weighted Average Price (VWAP) The volume weighted average price (VWAP) is a  trading   benchmark  used by traders that gives the average price a security has traded at throughout the day, based on both volume and price. It is important because it provides traders with insight into both the trend and value of a security. This indicator VWAP V2 is free and is the manual version of the extended Easy VWAP indicator (30 Euro), where the date and time properties are automatically entered. With
FREE
该产品的买家也购买
Trend Screener Pro MT5
STE S.S.COMPANY
4.85 (79)
使用趋势筛选指标释放趋势交易的力量:由模糊逻辑和多货币系统提供支持的终极趋势交易解决方案! 使用趋势筛选器(由模糊逻辑提供支持的革命性趋势指标)提升您的趋势交易。 它是一个强大的趋势跟踪指标,结合了超过 13 种高级工具和功能以及 3 种交易策略,使其成为使您的 Metatrader 成为趋势分析器的多功能选择。 限时优惠:趋势筛选指标终身仅需 50 美元。 ( 原价 250$ ) (优惠延长) 体验趋势筛选器 100% 无需重新绘制的准确性,确保您的交易决策不受过去价格变化的影响。 释放多时间框架和多货币功能的多功能性,使您能够以无与伦比的信心在外汇、商品、加密货币和指数领域进行交易。 利用 Trend Screener 的综合策略套件增强您的交易: - 趋势跟踪策略和趋势延续策略 :趋势筛选器的趋势跟踪策略提供清晰的趋势延续信号,让您有效捕捉趋势走势并管理风险。 - 反转策略和早期入场点策略 :趋势筛选器的反转策略可检测市场方向的潜在变化,使您能够预测趋势反转并利用疲弱的市场趋势。通过早期入场点,您可以在潜在的趋势变化之前定位自己 获取可观的利润。 - 倒卖策略: 趋势筛选器的倒卖
Описание индикатора MONEY Индикатор MONEY предназначен для анализа волатильности и выявления значительных рыночных движений (всплесков). Он использует ATR (Average True Range) для определения момента, когда цена выходит за пределы обычного диапазона, и сигнализирует об этом трейдеру с помощью стрелок на графике. Основные параметры: • Минимальное количество свечей – задает период для анализа всплесков. • Алерты (уведомления) – включение или отключение звуковых и текстовых сигналов. • Период AT
Golden Trend Indicator MT5
Noha Mohamed Fathy Younes Badr
4.88 (17)
Golden Trend indicator  is The best indicator for predicting trend movement this indicator never lags and never repaints and never back paints    and give  arrow buy and sell    before the candle appear  and it will help you and  will make your trading decisions clearer its work on all currencies and  gold and crypto and all time frame This unique  indicator uses very secret algorithms to catch the  trends, so you can trade using this indicator and see the trend clear on charts  manual guide and
Algo Pumping
Ihor Otkydach
5 (4)
PUMPING STATION – 您的专属“全包式”交易策略 我们为您推出PUMPING STATION —— 一款革命性的外汇指标,它将使您的交易变得更加有趣且高效。这不仅仅是一个辅助工具,而是一套完整的交易系统,具备强大的算法,帮助您开始更加稳定的交易。 购买本产品,您将免费获得: 专属设置文件:用于自动配置,实现最大化性能。 逐步视频教程:学习如何使用PUMPING STATION策略进行交易。 Pumping Utility:专为PUMPING STATION打造的半自动交易机器人,让交易变得更加方便和简单。 购买后请立即联系我,我将为您提供所有额外资源的访问权限。 PUMPING STATION如何工作: 趋势监控:能够即时识别市场趋势方向。趋势是您最好的朋友。 进场信号:图表上的箭头会提示您何时进场以及交易方向。 明确的交易目标:指标会自动识别最佳的平仓时机。 回调交易:内置的基于布林带的价格通道可检测修正结束并发出新趋势开始的信号。 效率分析:如果当前设置效果较差,系统会自动提示。只需调整PUMPING STATION,即可获得最佳性能。 功能强大: 推送和邮件通知:即
FX Power MT5 NG
Daniel Stein
5 (13)
FX Power:分析货币强度,助您做出更明智的交易决策 概述 FX Power 是一款专业工具,帮助您全面了解主要货币和黄金在任何市场条件下的真实强度。通过识别强势货币用于买入,弱势货币用于卖出, FX Power 简化了交易决策,并帮助您发现高概率的交易机会。不论您是想跟随趋势还是通过极端的 Delta 值预测反转,这款工具都能完美适应您的交易风格。别再盲目交易——用 FX Power 让您的交易更加智慧。 1. 为什么 FX Power 对交易者极具价值 实时货币和黄金强度分析 • FX Power 实时计算并显示主要货币和黄金的相对强度,助您全面了解市场动态。 • 监控领先或落后资产,轻松识别值得交易的货币对。 全面的多时间框架视图 • 跟踪短期、中期和长期时间框架的货币和黄金强度,以便将您的交易策略与市场趋势保持一致。 • 无论是快进快出的短线交易还是更长期的投资策略, FX Power 都能为您提供所需的信息。 Delta 动态分析用于趋势和反转 • 极端 Delta 值常常预示反转机会,而平缓的 Delta 变化则确认趋势延续。 • 使用 Delta 分析,轻
Grabber System MT5
Ihor Otkydach
5 (5)
向您介绍一款优秀的技术指标——Grabber,它是一套即开即用的“全包式”交易策略。 在一个代码中集成了强大的市场技术分析工具、交易信号(箭头)、提醒功能和推送通知。 每位购买该指标的用户还可免费获得以下内容: Grabber辅助工具:用于自动管理已开仓位 视频操作指南:逐步教学如何安装、设置和使用该指标进行交易 原创Set文件:可快速自动配置,帮助实现最佳交易效果 忘掉其他策略吧!只有Grabber能够真正激励你在交易中攀登新高峰! Grabber策略的主要特点: 交易周期:从M5到H4 适用资产:任意,但我推荐我亲自测试过的品种(GBPUSD、GBPCAD、GBPCHF、AUDCAD、AUDUSD、AUDSGD、AUDCHF、NZDUSD、NZDCAD、EURCAD、EURUSD、EURAUD、EURGBP、EURCHF、USDCAD、USDSGD) 交易时间:全天候 24/7 交易效果:我分享自己的真实交易结果,并在此教学如何操作: https://www.mql5.com/ru/market/product/134563?source=Site+Market+MT5+Indic
支撑和阻力筛选器是 MetaTrader 的一个级别指标,它在一个指标内提供多种工具。 可用的工具有: 1. 市场结构筛选器。 2. 看涨回调区。 3. 看跌回调区。 4.每日枢轴点 5.每周枢轴点 6. 每月枢轴点 7. 基于谐波形态和成交量的强大支撑和阻力。 8. 银行级区域。 限时优惠:HV 支撑和阻力指示器仅售 50 美元且终生可用。 (原价 125$) 通过访问我们的 MQL5 博客,您可以找到我们所有带有分析示例的高级指标: 单击此处 主要特点 基于谐波和音量算法的强大支撑和阻力区域。 基于谐波和成交量算法的看涨和看跌回调区域。 市场结构筛选器 每日、每周和每月的枢轴点。 文档 所有支持和阻力筛选器文档(说明)和策略详细信息均可在我们 MQL5 博客的这篇文章中找到: 单击此处。 接触 如果您有任何问题或需要帮助,请通过私信联系我。 作者 SAYADI ACHREF,金融科技软件工程师,Finansya 创始人。
FX Volume MT5
Daniel Stein
4.82 (17)
FX Volume:从经纪商视角洞察真实市场情绪 简要概述 想要提升您的交易策略? FX Volume 可提供零售交易者和经纪商的持仓实时数据——远早于诸如 COT 之类的延迟报告。不论您希望获得持续稳定的收益,还是想在市场中多一分制胜的砝码, FX Volume 都能帮您识别重大失衡、确认突破以及完善风险管理。立即开启体验,让真实的成交量数据为您的交易决策带来革新! 1. 为什么 FX Volume 对交易者格外有用 极具准确度的早期预警 • 快速捕捉有多少交易者正在买入或卖出某个货币对——比大多数人提前一步。 • FX Volume 是 唯一 能够整合多家零售经纪商真实成交量数据并以简洁方式呈现的工具。 强力风险管理 • 及时识别多头或空头仓位的巨大不平衡,这往往预示着潜在的趋势反转,帮助您更自信地设置止损和目标位。 • 独家而真实的数据让每一次交易决策更具可靠性。 优化进场与出场点 • 发现“过度集中”的交易(大多数交易者都在同一方向),并通过真实成交量来确认突破。 • 避免依赖常见指标可能带来的误导信号,而是利用真实的实时成交量。 适配各种交易策略 • 将 FX
FX Levels MT5
Daniel Stein
5 (4)
FX Levels:适用于所有市场的高精度支撑与阻力 快速概览 想要精准确定适用于任何市场(外汇、指数、股票或大宗商品)的支撑与阻力吗? FX Levels 将传统的“Lighthouse”方法与前沿的动态分析相结合,实现近乎通用的准确性。依托真实经纪商经验和自动化的每日与实时更新, FX Levels 帮助您捕捉价格反转点、设置合理的盈利目标,并自信地管理交易。立即使用,体验更准确的支撑/阻力分析如何助力您的交易更上层楼! 1. 为什么 FX Levels 对交易者非常有利 极度精准的支撑 & 阻力区 • FX Levels 专为不同经纪商提供的行情源和时间设置而设计,可生成几乎相同的价位区,解决数据不一致的常见问题。 • 这意味着无论您在哪里交易,都能获得稳定一致的水平线,为策略打下更加牢固的基础。 结合传统与先进技术 • 通过将久经考验的“Lighthouse”方法与动态分析相融合, FX Levels 不仅限于每日刷新,还可针对新的价格波动进行即时更新。 • 您可以选择经典的静态方式,或实时捕捉新出现的水平,以贴近最新的市场行为。 识别清晰的反转点 • FX Lev
Gold Stuff mt5
Vasiliy Strukov
4.93 (178)
Gold Stuff mt5 是专为黄金设计的趋势指标,也可用于任何金融工具。 该指标不会重绘,也不会滞后。 推荐时间框架 H1。 购买后立即联系我以获得设置和个人奖励!   你可以在我的个人资料中找到它。   重要! 购买后立即与我联系,以获得说明和奖金!   您可以免费收到我们的强力支持和趋势扫描指标的副本,请私信。大部头书!   设置 绘制箭头 - 打开关闭。 在图表上绘制箭头。 警报 - 打开关闭声音警报。 电子邮件通知 - 打开关闭。 电子邮件通知。 Puch-notification - 打开关闭。 推送通知。 接下来,调整色域。 Gold Stuff mt5 是专为黄金设计的趋势指标,也可用于任何金融工具。 该指标不会重绘,也不会滞后。 推荐时间框架 H1。 购买后立即联系我以获得设置和个人奖励!   设置 绘制箭头 - 打开关闭。 在图表上绘制箭头。 警报 - 打开关闭声音警报。 电子邮件通知 - 打开关闭。 电子邮件通知。 Puch-notification - 打开关闭。 推送通知。 接下来,调整色域。
TPSpro RFI Levels MT5
Roman Podpora
4.55 (20)
指示       俄罗斯 -        英语   建议 与指示器一起使用     -       TPSpro 趋势专业版 -   MT4版本       交易中的一个关键要素是做出买卖交易工具决定的区域或水平。尽管主要参与者试图隐藏他们在市场中的存在,但他们不可避免地会留下痕迹。我们的任务是学习如何识别这些痕迹并正确解释它们。 主要功能: 向卖家和买家显示活跃区域! 该指标显示所有正确的初始买入和卖出脉冲水平/区域。激活这些水平/区域后,开始寻找切入点,水平会改变颜色并填充特定阴影。此外,还会显示箭头,以便更直观地了解情况。 显示更高时间范围内的级别/区域(MTF 模式) 添加了使用更高时间间隔显示级别/区域的功能。此外,该指标还具有自动趋势检测功能(   TPSproTREND PRO   )。 用于交易的单独专业的逐步算法。 该算法专为日内交易而设计,既可顺势交易,也可逆势交易。每个活动模板均提供详细说明。 适用于多种时间范围 。 TPSpro RFI 水平指标可用于图表上的任何时间范围,从一分钟(M1)开始一直到每月(MN)。 图形和声音警报。 该指标提供图形和声音指示,
Basic Harmonic Patterns Dashboard MT5
Mehran Sepah Mansoor
4.13 (8)
该仪表盘显示所选符号的最新可用谐波形态,因此您可以节省时间并提高效率 /  MT4 版本 。 免费指标:  Basic Harmonic Pattern 指标列 Symbol:   显示所选符号 Trend:     看涨或看跌 Pattern:    形态类型(Gartley、蝴蝶、蝙蝠、螃蟹、鲨鱼、Cypher 或 ABCD) Entry:     入口价格 SL: 止损价 TP1: 第一止盈价 TP2: 第二次获利价格 TP3: 第三次获利价格 Current price:    当前价格 Age (in bars):   最后绘制的模式的年龄 主要输入 Symbols :   从 "28 种主要货币对 "或 "选定符号 "中选择。 Selected Symbols :   希望监控的符号,用逗号分隔("EURUSD,GBPUSD,XAUUSD")。如果您的经纪商为货币对设置了后缀或前缀,您必须在以下两个参数中添加(货币对前缀或货币对后缀)。 Max Iteration:   调整模式的最大迭代次数(如果该值越小,则模式越少,性能越快;如果该值越大,则模式越多,性能越慢)
TPSproTREND PrO MT5
Roman Podpora
4.72 (18)
VERSION MT4        —        ИНСТРУКЦИЯ RUS           —        INSTRUCTIONS  ENG 主要功能: 准确的输入信号,无需渲染! 如果出现信号,它仍然相关!这是与重提指标的一个重要区别,重提指标可以提供信号然后改变信号,这可能导致存款资金的损失。现在您可以以更高的概率和准确度进入市场。还有一个功能是在箭头出现后为蜡烛着色,直到达到目标(止盈)或出现反转信号。 显示止损/获利区域 为了提高搜索切入点时的视觉清晰度,创建了一个模块,该模块最初显示买入/卖出区域,在该区域中搜索进入市场的最佳点。用于处理止损水平的附加智能逻辑有助于随着时间的推移减小其大小,从而降低进入交易(移动 sl)时的初始风险。 显示较高时间范围内的最小值/最大值(MTF 模式) 添加了一项功能,可以显示较高时间间隔的最小/最大校正位置,并显示趋势变化。此外,MIN/MAX 现在有编号,显示修正内容。 风险回报率 (RR) 使用指标算法,可以检测精确的入场点,平均风险回报比超过1k2。这也伴随着视觉效果,例如,收到信号后会出现蜡烛的彩色草图。 无论
IX Power MT5
Daniel Stein
4.86 (7)
IX Power:解锁指数、大宗商品、加密货币和外汇市场洞察 概述 IX Power 是一款多功能工具,可分析指数、大宗商品、加密货币和外汇市场的强弱表现。 FX Power 提供针对货币对的最高精度,利用所有可用货币对数据进行分析,而 IX Power 专注于基础资产的市场数据。这使得 IX Power 成为非外汇市场的理想选择,同时在需要简单外汇分析时也非常可靠。它可以无缝适用于任何图表,提供清晰的、有行动价值的洞察,帮助提升您的交易决策。 1. 为什么 IX Power 对交易者非常有价值 多市场强弱分析 • IX Power 分析指数、大宗商品、加密货币和外汇市场的强弱表现,为每个市场提供量身定制的洞察。 • 监控 US30、WTI、黄金、比特币等资产的表现,发现交易机会。 适用于更广泛的市场 • 对于外汇交易, FX Power 提供无与伦比的精度,通过分析所有相关货币对。 • IX Power 专注于基础资产的市场数据,非常适合非外汇市场及简化的外汇分析。 实时适应性 • 借助自适应算法, IX Power 实时响应市场数据变化,保持分析的最新性。 • 实时更新
Matrix Arrow Indicator MT5
Juvenille Emperor Limited
5 (13)
矩阵箭头指标 MT5   是一种独特的 10 合 1 趋势,遵循   100% 非重绘多时间框架指标 ,可用于所有符号/工具: 外汇 、 商品 、 加密货币 、 指数 、 股票 。 Matrix Arrow Indicator MT5 将在其早期阶段确定当前趋势,从多达 10 个标准指标中收集信息和数据,它们是: 平均定向运动指数 (ADX) 商品渠道指数 (CCI) 经典 Heiken Ashi 蜡烛 移动平均线 移动平均收敛散度 (MACD) 相对活力指数 (RVI) 相对强弱指数 (RSI) 抛物线SAR 随机振荡器 威廉姆斯的百分比范围 当所有指标给出有效的买入或卖出信号时,相应的箭头将打印在图表上,在下一根蜡烛/柱线开盘时,指示强劲的上升趋势/下降趋势。用户可以选择使用哪些指标,并可以单独调整每个指标的参数。 Matrix Arrow Indicator MT5 仅从选定的指标中收集信息,并仅根据其数据打印箭头。   Matrix Arrow Indicator MT5   还可以为所有新信号发送终端、推送通知或电子邮件警报。无论您是黄牛、日内交易者还是波段交易者, Mat
Trend Line Map Pro MT5
STE S.S.COMPANY
4.09 (11)
趋势线图指标是趋势筛选器指标的插件。它用作趋势筛选器(趋势线信号)生成的所有信号的扫描仪。 它是基于趋势筛选器指标的趋势线扫描仪。如果您没有 Trend Screener Pro Indicator,Trend Line Map Pro 将无法使用。 It's a Trend Line Scanner based on Trend Screener Indicator. If you don't have Trend Screener Pro Indicator,     the Trend Line Map Pro will not work . 通过访问我们的 MQL5 博客,您可以下载趋势线图指标的免费版本。购买前试用,不受 Metatrader Tester 限制。 :  点击这里 1. 容易获得的优势 根据货币和时间范围显示买入和卖出信号。 评估自图表中出现箭头以来价格上涨或下跌的点数。 (趋势筛选指标箭头) 显示信号的时序。 获取多时间范围和多货币警报以购买和出售警报。 2. 如何使用趋势线图 如何显示买卖信号仪表板? 如果您有任何问题或需要帮助,请通过私
Quantum TrendPulse
Bogdan Ion Puscasu
5 (13)
介绍 Quantum TrendPulse   ,这是一款终极交易工具,它将 SuperTrend   、   RSI 和 Stochastic 的强大功能整合到一个综合指标中,以最大限度地发挥您的交易潜力。该指标专为追求精准和效率的交易者而设计,可帮助您自信地识别市场趋势、动量变化以及最佳进入和退出点。 主要特点: 超级趋势整合: 轻松跟随当前的市场趋势并乘上盈利浪潮。 RSI 精度: 检测超买和超卖水平,非常适合把握市场逆转时机,可用作 SuperTrend 的过滤器 随机精度: 利用随机振荡在波动的市场中寻找隐藏的机会, 用作超级趋势的过滤器 多时间范围分析: 从 M5 到 H1 或 H4,在不同时间范围内关注市场动态。 可定制的警报: 当您的自定义交易条件得到满足时收到通知,这样您就不会错过任何交易。 无论您是新手还是经验丰富的交易员,   Quantum TrendPulse 都能为您提供所需的优势,帮助您增强策略并自信地进行交易。借助这一强大的指标,将洞察力转化为利润 — 掌控您的交易! ***购买 Quantum TrendPulse,即可免费获得 Quantum Tr
FourAverageMT5
Mikhail Sergeev
5 (2)
FourAverage是趋势检测中的一个新词。 随着信息技术的发展和大量的参与者,金融市场越来越不适合用过时的指标进行分析。 传统的技术分析工具,如移动平均线或随机指标,其纯粹形式无法确定趋势的方向或其逆转。 一个指标可以根据14年的历史指示未来价格的正确方向,而不改变其参数吗? 与此同时,不要失去充足的横向市场走势? 答:可以。 我们的团队开发了一个指标,具有相当强大和有效的机制来适应不断变化的市场条件。 2025年,领先的趋势指标"FourAverage"正进入新的发展阶段。 现代加密货币和股票市场似乎是为此指标创建的。 独特的平滑公式允许您调整(识别模式)指标的任何特征的货币对或其他工具。 现在,为了盈利,一个指标就足够了,而这仅仅是个开始。 与其他工具结合使用或作为信号滤波器,FourAverage的好处是巨大的。 该指标有一个内置函数,绘制箭头并在指标上显示前一笔交易的结果。 这使得检查历史非常方便。 这是非常容易使用这个趋势指标。 1)确定具有良好增长潜力的资产。 2)使用一组内置指标设置或选择您自己的选项。 3)您正在等待指标的信号来开启交易。 4)打开一个位置,并获得利
FX Dynamic:借助可定制的 ATR 分析,追踪波动率与趋势 概述 FX Dynamic 是一款强大的工具,通过计算平均真实波幅(ATR)来为交易者提供日内和日间波动性方面的深度见解。通过设置 80%、100%、130% 等关键波动率阈值,您可以快速识别潜在的盈利机会,或者在市场超出常规范围时及时得到预警。 FX Dynamic 可根据您经纪商的时区进行调整,帮助您保持一致的波动率衡量标准,并能与 MetaTrader 平台完美结合,实现实时分析。 1. 为什么 FX Dynamic 对交易者极具价值 实时 ATR 洞察 • 仅需一眼便可了解日间与日内波动水平。当价格触及或突破 80%、100%、130% 的 ATR 阈值时,会发出提示,让您知道市场是否达到临界水平。 • 在波动完全爆发前预判可能的衰竭或突破走势。 多市场通用 • 适用于外汇、商品、指数等多种资产。 FX Dynamic 可以自动识别经纪商时区,也可手动进行调整。 • 您可选择只专注于某一特定品种,或在多市场保持一致的 ATR 标准。 更智能的风险管理 • 利用 ATR 门槛来优化止损或止盈位置。当市场
CBT Quantum Maverick 高效的二元期权交易系统 CBT Quantum Maverick 是一款精心设计的高性能二元期权交易系统,专为追求精准、简单和纪律的交易者打造。无需自定义,该系统经过优化,可直接使用并产生高效结果。只需遵循信号操作,稍加练习即可掌握。 主要特点: 信号精准度: 基于当前K线生成下根K线交易信号,无频繁重绘。 市场多样性: 专为二元期权交易设计,兼容多种经纪商和资产类别,适应不同交易偏好。 兼容性: Deriv Synthetic Charts :适用于任何时间框架。 OTC Charts :来自如 Quotex、PocketOption、Binomo、Stockity、IQOption、Exnova、OlympTrade、Deriv、Binolla 和 Homebroker 的经纪商,可导入 MT5(一周内提供免费导入支持,之后需支付服务费用)。 外汇、加密货币和商品市场 :扩展资产利用。 高收益二元资产 :建议使用90%以上的高回报率资产。 额外优势: 全面的交易计划: 提供系统化和纪律性交易的分步支持计划。 高效时间利用: 每天仅需一
- Lifetime update free Contact me for instruction, any questions! Related Product:  Gold Trade Expert MT5 - Non-repaint - I just sell my products in Elif Kaya Profile, any other websites are stolen old versions, So no any new updates or support. Introduction The breakout and retest strategy is traded support and resistance levels. it involves price breaking through a previous level.  The break and retest strategy is designed to help traders do two main things, the first is to avoid false breako
首先,值得强调的是,这个交易工具是非重绘、非重画和非滞后的指标,非常适合专业交易。 在线课程,用户手册和演示。 智能价格行动概念指标是一个非常强大的工具,既适用于新手,也适用于经验丰富的交易者。它将超过20个有用的指标合并到一个指标中,结合了高级交易思想,如内圈交易员分析和智能资金概念交易策略。该指标侧重于智能资金概念,提供有关大型机构交易方式的见解,帮助预测它们的动向。 它在流动性分析方面尤其擅长,有助于理解机构的交易方式。它擅长预测市场趋势,并仔细分析价格波动。通过将您的交易与机构策略对齐,您可以更准确地预测市场走向。该指标多才多艺,擅长分析市场结构,识别重要的订单区块,并识别各种模式。 它擅长识别BOS和CHoCH等模式,理解动量的转变,并突出显示供需强劲的关键区域。它还擅长发现强大的不平衡,并分析价格创造更高高点或更低低点的模式。如果您使用斐波那契回撤工具,该指标可以满足您的需求。它还可以识别相等的高点和低点,分析不同的时间框架,并通过仪表板显示数据。 对于使用更高级策略的交易者,该指标提供了工具,如公平价值差指标和优惠和折扣区域的识别。它特别关注高时间框架订单区块,并
Trend Hunter MT5
Andrey Tatarinov
5 (2)
Trend Hunter 是外汇、加密货币和差价合约市场的趋势指标。 该指标的一个特点是,它可以自信地跟随趋势,当价格略微刺穿趋势线时不会改变信号。 指标不会重新绘制;收盘后会出现入市信号。 当沿着趋势移动时,指标会显示趋势方向上的其他入场点。 根据这些信号,您可以使用较小的止损进行交易。 趋势猎人是一个诚实的指标。 当您将鼠标悬停在指标信号上时,会显示该信号的潜在利润和可能的止损。 当出现新信号时,您可以收到以下通知: 警报 推送通知 通过电子邮件通知 电报中的通知 图表的屏幕截图也会发送到 Telegram,因此您无需打开终端即可做出交易决定。 指标信号可以在电报频道中在线查看 https://www.mql5.com/zh/market/product/11085#!tab=comments&page=13&comment=50356403 趋势猎人扫描仪可帮助您评估其他货币对和时间范围的趋势方向。 您还可以使用扫描仪接收其他仪器的入场信号。 要自动化交易,您可以使用使用指标信号进行交易的顾问  该指标通过位于图表下方的便捷面板进行控制。 MT4 版本 https://www.
首先,值得强调的是,这个交易系统是一个非重绘、非重画和非滞后的指标,这使得它非常适合手动和机器人交易。 在线课程,手册和下载预设。 “智能趋势交易系统 MT5”是专为新手和经验丰富的交易者量身定制的综合交易解决方案。它结合了超过 10 个优质指标,具有 7 多个强大的交易策略,使其成为适用于各种市场条件的多功能选择。 趋势跟随策略:提供精确的入场和止损管理,以有效地跟随趋势。 反转策略:识别潜在的趋势反转,使交易者能够利用区域市场的机会。 剃头策略:专为快速准确的日内交易和短期交易而设计。 稳定性:所有指标都不会重绘、不会重画和不会滞后,确保可靠的信号。 定制:支持自定义策略,以满足个人交易偏好。超过 7 种策略和组合可帮助您找到最佳策略。 信号清晰度:提供箭头信号,以指示清晰的入场和退出点。 实时警报:通过交易进出警报使交易者保持了解。 深入分析:提供更高时间框架的趋势分析和实时交易监控。 自适应颜色编码:利用蜡烛颜色编码来显示成交量、趋势和反转蜡烛信号。通过蜡烛颜色分析市场方向。 “智能趋势交易系统 MT5”赋予交易者必要的工具,以便在各种市场条件下做出明智和战略性的交易决策。无论
Royal Scalping Indicator M5
Vahidreza Heidar Gholami
5 (6)
Royal Scalping Indicator is an advanced price adaptive indicator designed to generate high-quality trading signals. Built-in multi-timeframe and multi-currency capabilities make it even more powerful to have configurations based on different symbols and timeframes. This indicator is perfect for scalp trades as well as swing trades. Royal Scalping is not just an indicator, but a trading strategy itself. Features Price Adaptive Trend Detector Algorithm Multi-Timeframe and Multi-Currency Trend Low
Gold Trend 5
Sergei Linskii
3.5 (2)
黄金趋势 - 这是一个很好的股票技术指标。该指标算法分析资产的价格走势,并反映波动性和潜在进入区。 最佳指标信号: - 卖出 = 红色柱状图 + 红色短指针 + 同方向黄色信号箭头。 - 买入 = 蓝色柱状图 + 蓝色多头指针 + 同方向水蓝色信号箭头。 该指标的优点 1. 该指标生成的信号准确度高。 2. 只有当趋势发生变化时,才能重新绘制已确认的箭头信号。 3. 您可以在任何经纪商的 MetaTrader 5 交易平台上进行交易。 4. 您可以交易任何资产(货币、金属、加密货币、股票、指数等)。 5. 最好在 H1 时间框架(中期交易)上进行交易。 6. 在指标设置中可更改个别参数(TF、颜色等),以便每位交易者都能轻松定制适合自己的指标。 7. 该指标既可作为交易系统的主要补充,也可作为独立的交易系统使用。   注意:交易的入場準確性和盈利能力僅取決於交易者的技能。 任何指標都只是交易者的助手,而不是行動指南。黃金法則 - 根據趨勢開單,獲利並等待下一個最佳訊號。 MetaTrader 4 黄金趋势指标版本  祝大家交易好运,稳定盈利!
Auto Order Block with break of structure based on ICT and Smart Money Concepts (SMC) Futures Break of Structure ( BoS )             Order block ( OB )            Higher time frame Order block / Point of Interest ( POI )    shown on current chart           Fair value Gap ( FVG ) / Imbalance   -  MTF      ( Multi Time Frame )    HH/LL/HL/LH  -  MTF      ( Multi Time Frame )  Choch  MTF      ( Multi Time Frame )  Volume Imbalance     ,  MTF          vIMB Gap’s Power of 3 Equal High / Low’s  
Volumatic VIDyA MT5
Duc Hoan Nguyen
5 (2)
Special offer : ALL TOOLS , just $35 each! New tools   will be   $30   for the   first week   or the   first 3 purchases !  Trading Tools Channel on MQL5 : Join my MQL5 channel to update the latest news from me Volumatic VIDYA (Variable Index Dynamic Average) 是一款高级指标,旨在跟踪趋势并分析每个趋势阶段中的买卖压力。通过使用可变指数动态平均值 (Variable Index Dynamic Average) 作为核心动态平滑技术,该工具在关键市场结构水平上提供了关于价格和交易量动态的重要洞察。 查看更多 MT4 版本:  Volumatic VIDyA MT4 查看更多产品:    所有产品 To use iCustom for EA, please see here:  Create EA (iCustom) with VO
Atomic Analyst MT5
Issam Kassas
4.32 (19)
首先值得强调的是,该交易指标是非重绘、非延迟的指标,这使其成为手动和机器人交易的理想选择。 用户手册:设置、输入和策略。 Atomic Analyst是一种PA价格行动指标,利用价格的力量和动量来寻找市场上更好的机会。配备了高级过滤器,可帮助去除噪音和假信号,并提高交易潜力。使用多层复杂的指标,Atomic Analyst扫描图表,并将复杂的数学计算转化为任何初学者都能理解并用来做出一致交易决策的简单信号和颜色。 “Atomic Analyst”是专为新手和经验丰富的交易者量身定制的综合交易解决方案。它将高级指标和一流功能融合为一体的交易策略,使其成为所有类型交易者的多功能选择。 日内交易和剥头皮策略:专为快速准确的日内交易和短期交易而设计。 日内和摆动交易策略:可用作追求价格大幅波动的日内和摆动交易者的可靠工具。 多货币和市场:凭借其可靠的精度,在不同的工具和市场上运作。 多个时间框架:可在多个时间框架上使用,性能良好。 稳定性:所有指标均不重绘、不重绘和不滞后,确保可靠的信号。 信号清晰度:提供箭头信号,用于清晰的入场和出场点。 实时警报:通过交易入场、SL和TP警报通知交易者
ATrend
Zaha Feiz
4.77 (13)
ATREND: 工作原理及使用方法 工作原理 “ATREND”指标针对MT5平台设计,旨在通过结合多种技术分析方法为交易者提供强有力的买卖信号。该指标主要利用平均真实波幅(ATR)来测量波动性,并结合趋势检测算法来识别潜在的市场动向。 购买后请留言,您将获得特别的赠品。 主要特点: - 动态趋势检测:该指标评估市场趋势并相应调整信号,帮助交易者与当前市场条件对齐策略。 - 波动性测量:通过使用ATR,该指标衡量市场波动性,这对于确定最佳止损(SL)和止盈(TP)水平至关重要。 - 信号可视化:该指标在图表上直观地表示买卖信号,增强交易者的决策能力。 操作步骤 输入和设置: - 时间框架:此输入允许您设置指标计算的主要时间框架,默认值为15分钟。 - 时间框架2:此输入可用于定义额外分析的辅助时间框架,默认值为1分钟。 - 移动:此参数允许您将指标的计算向回移动,默认值为0。 - SLATR:此输入定义用于根据ATR计算止损水平的乘数,默认值为2.56。 - TPATR:此输入定义用于根据ATR计算止盈水平的乘数,默认值也为2.56。 - AlertsOn:启用或禁用交易信号的警报,
作者的更多信息
Candle Timer Countdown
JETINVEST
4.75 (83)
Candle Timer Countdown 显示当前柱线关闭并形成新柱线之前的剩余时间。 它可以用于时间管理。 MT4版本在这里! 功能亮点 跟踪服务器时间而不是本地时间 可配置的文本颜色和字体大小 符号每日变化的可选可视化 优化以减少 CPU 使用率 输入参数 显示每日变化:真/假 文本字体大小 文字颜色 如果您仍有疑问,请通过直接消息与我联系: https://www.mql5.com/zh/users/robsjunqueira/ 如果可能,请留下您的评论和评论,以帮助向社区传播信息。 还可以了解我们的其他指标和专家顾问。 我有几种有用的指标和专家顾问。 如果您有任何建议,请随时提出建议,这样我才能改进产品,使持续改进永无止境。
FREE
MACD Intraday Trend
JETINVEST
4.77 (48)
MACD 日内趋势是通过改编自 Gerald Appel 在 1960 年代创建的原始 MACD 而开发的指标。 通过多年的交易,观察到通过使用斐波那契比例更改 MACD 的参数,我们可以更好地呈现趋势运动的连续性,从而可以更有效地检测价格趋势的开始和结束。 由于其检测价格趋势的效率,还可以非常清楚地识别顶部和底部的背离,从而更好地利用交易机会。 请务必尝试我们具有可配置功能和警报的专业版本: MACD Intraday Trend PRO 特征 适用于任何货币对 在任何时间范围内工作 适用于 Renko 图表 如果您仍有疑问,请通过直接消息与我联系: https://www.mql5.com/zh/users/robsjunqueira/ ----------------------------------------- 如果可能,请留下您的评论和评论,以帮助向社区传播信息。 还可以了解我们的其他指标和专家顾问。 我有几种有用的指标和专家顾问。 如果您有任何建议,请随时提出建议,这样我才能改进产品,使持续改进永无止境。
FREE
Tabajara VWAP Ogro RSJ
JETINVEST
4.82 (33)
Setup Tabajara 是由一位被称为“华尔街的 OGRO”的巴西交易员创建的。 这种设置的想法是向交易者表明当前的价格趋势和应该在图表中寻找的操作类型。 手术 它通过将蜡烛的收盘价和 VWAP 定位到上午 10:40 和之后的 20 个周期的算术平均值来实现这一点,以 4 种可能的颜色绘制蜡烛: 绿色 -> 价格呈上升趋势(搜索购买入口点) 黑色 -> 看涨趋势中的价格修正(搜索购买切入点) 红色 -> 价格在下降趋势中下降(搜索销售切入点) 白色 -> 在下降趋势中修正价格(搜索销售切入点) 另外,我还在脚本中放入了以下指标: 8 个时期的指数平均值:识别短期价格变动 50 个周期的算术平均值:确定中期价格变动 80 个时期的指数平均值:确定中期价格变动 200 个周期的算术平均值:确定长期价格变动 如果您仍有疑问,请通过直接消息与我联系: https://www.mql5.com/zh/users/robsjunqueira/
FREE
Candle Timer Countdown 显示当前柱线关闭并形成新柱线之前的剩余时间。 它可以用于时间管理。 MT5版本在这里 ! 功能亮点 跟踪服务器时间而不是本地时间 可配置的文本颜色和字体大小 符号每日变化的可选可视化 优化以减少 CPU 使用率 输入参数 显示每日变化:真/假 文本字体大小 文字颜色 如果您仍有疑问,请通过直接消息与我联系: https://www.mql5.com/zh/users/robsjunqueira/ 如果可能,请留下您的评论和评论,以帮助向社区传播信息。 还可以了解我们的其他指标和专家顾问。 我有几种有用的指标和专家顾问。 如果您有任何建议,请随时提出建议,这样我才能改进产品,使持续改进永无止境。
FREE
Pivot Point Fibo RSJ
JETINVEST
4.33 (18)
枢轴点斐波那契 RSJ 是一个指标,它使用斐波那契汇率追踪当天的支撑线和阻力线。 这个壮观的指标使用斐波那契汇率通过枢轴点创建多达 7 个支撑位和阻力位。 价格如何尊重该支撑和阻力的每个水平真是太棒了,在那里可以感知操作的可能进入/退出点。 特征 多达 7 个支撑位和 7 个阻力位 单独设置级别的颜色 输入 枢轴类型 Pivot Fibo RSJ1 = Fibo ratio 1 计算 Pivot Fibo RSJ2 = Fibo ratio 2 计算 Pivot Fibo RSJ3 = Fibo ratio 3 计算 Pivot Fibo Classic = 经典枢轴计算 最低枢轴级别 旋转 3 个级别 旋转 4 个级别 旋转 5 个级别 枢轴 6 个级别 旋转 7 个级别 如果您仍有疑问,请通过直接消息与我联系: https://www.mql5.com/zh/users/robsjunqueira/
FREE
蜡烛计数器是一个指标,用于打印当天第一根蜡烛的蜡烛数量。 当天的第一根蜡烛将是数字 1,在此计数中,每根新蜡烛都会增加 1。 输入参数 从偶数、奇数或全部中选择 从蜡烛到打印数字的距离 文本字体大小 文字字体颜色 如果您仍有疑问,请通过直接消息与我联系: https://www.mql5.com/zh/users/robsjunqueira/ ----------------------------------------- 如果可能,请留下您的评论和评论,以帮助向社区传播信息。 还可以了解我们的其他指标和专家顾问。 我有几种有用的指标和专家顾问。 如果您有任何建议,请随时提出建议,这样我才能改进产品,使持续改进永无止境。
FREE
MACD 日內趨勢 PRO 是通過改編自 Gerald Appel 在 1960 年代創建的原始 MACD 而開發的指標。 通過多年的交易,觀察到通過使用斐波那契比例更改 MACD 的參數,我們可以更好地呈現趨勢運動的連續性,從而可以更有效地檢測價格趨勢的開始和結束。 由於其檢測價格趨勢的效率,還可以非常清楚地識別頂部和底部的背離,從而更好地利用交易機會。 特徵 MACD 日內趨勢 PRO 指標適用於任何貨幣對、任何時間範圍以及 Renko 圖表。 可以通過選擇 6 種模式來設置趨勢檢測速度: 最快的 快速地 普通的 減緩 最慢 資源 它有 6 個可配置的警報: MACD回調信號線 MACD穿越信號線 MACD穿過零水平 信號線過零電平 MACD 變化趨勢顏色 信號線變化趨勢顏色 對於每個警報,可以配置: 彈出 聲音(有 13 種聲音可用。) 智能手機通知 彈出窗口和聲音 彈出窗口和智能手機通知 聲音和智能手機通知 彈出窗口、聲音和智能手機通知 與智能交易系統或其他指標集成 有 8 個緩衝區可用於訪問和與專家顧問或其他指標集成,即使關閉警報,它們也會被填滿,它們是: 緩衝
MACD 日内趋势是通过改编自 Gerald Appel 在 1960 年代创建的原始 MACD 而开发的指标。 通过多年的交易,观察到通过使用斐波那契比例更改 MACD 的参数,我们可以更好地呈现趋势运动的连续性,从而可以更有效地检测价格趋势的开始和结束。 由于其检测价格趋势的效率,还可以非常清楚地识别顶部和底部的背离,从而更好地利用交易机会。 请务必尝试我们具有可配置功能和警报的专业版本: MACD Intraday Trend PRO 特征 适用于任何货币对 在任何时间范围内工作 适用于 Renko 图表 如果您仍有疑问,请通过直接消息与我联系: https://www.mql5.com/zh/users/robsjunqueira/ ----------------------------------------- 如果可能,请留下您的评论和评论,以帮助向社区传播信息。 还可以了解我们的其他指标和专家顾问。 我有几种有用的指标和专家顾问。 如果您有任何建议,请随时提出建议,这样我才能改进产品,使持续改进永无止境。
FREE
VWAP Fibo Bands RSJ
JETINVEST
4.9 (10)
VWAP Fibo Bands RSJ is an indicator that traces the lines of the daily VWAP and from it creates bands using Fibonacci proportions. This spectacular indicator creates 10 band levels through the selected VWAP period using Fibonacci ratios. It is fantastic how the prices respect each level of the bands, where it is possible to realize that almost every time the price closes above / below a level of the bands he will seek the next one. If close above will seek to reach the level above and if close
FREE
Tabajara Ogro
JETINVEST
4.75 (12)
Setup Tabajara was created by a Brazilian trader known as  "The OGRO of Wall Street" . The idea of this setup is to indicate to the trader the current trend of prices and  the type of operation should be looked for in the graph. Operation It does this through the relation of the closing price position and the     of 20 periods, by painting the candles in 4 possible colors : Green -> Price rising in upward trend (Search entry points for PURCHASE) Black -> Price correcting in Bullish Trend (Sear
FREE
MACD 日內趨勢 PRO 是通過改編自 Gerald Appel 在 1960 年代創建的原始 MACD 而開發的指標。 通過多年的交易,觀察到通過使用斐波那契比例更改 MACD 的參數,我們可以更好地呈現趨勢運動的連續性,從而可以更有效地檢測價格趨勢的開始和結束。 由於其檢測價格趨勢的效率,還可以非常清楚地識別頂部和底部的背離,從而更好地利用交易機會。 特徵 MACD 日內趨勢 PRO 指標適用於任何貨幣對、任何時間範圍以及 Renko 圖表。 可以通過選擇 6 種模式來設置趨勢檢測速度: 最快的 快速地 普通的 減緩 最慢 資源 它有 6 個可配置的警報: MACD回調信號線 MACD穿越信號線 MACD穿過零水平 信號線過零電平 MACD 變化趨勢顏色 信號線變化趨勢顏色 對於每個警報,可以配置: 彈出 聲音(有 13 種聲音可用。) 智能手機通知 彈出窗口和聲音 彈出窗口和智能手機通知 聲音和智能手機通知 彈出窗口、聲音和智能手機通知 與智能交易系統或其他指標集成 有 8 個緩衝區可用於訪問和與專家顧問或其他指標集成,即使關閉警報,它們也會被填滿,它們是: 緩衝
枢轴点斐波那契 RSJ 是一个指标,它使用斐波那契汇率追踪当天的支撑线和阻力线。 这个壮观的指标使用斐波那契汇率通过枢轴点创建多达 7 个支撑位和阻力位。 价格如何尊重该支撑和阻力的每个水平真是太棒了,在那里可以感知操作的可能进入/退出点。 特征 多达 7 个支撑位和 7 个阻力位 单独设置级别的颜色 输入 枢轴类型 Pivot Fibo RSJ1 = Fibo ratio 1 计算 Pivot Fibo RSJ2 = Fibo ratio 2 计算 Pivot Fibo RSJ3 = Fibo ratio 3 计算 Pivot Fibo Classic = 经典枢轴计算 最低枢轴级别 旋转 3 个级别 旋转 4 个级别 旋转 5 个级别 枢轴 6 个级别 旋转 7 个级别 如果您仍有疑问,请通过直接消息与我联系: https://www.mql5.com/zh/users/robsjunqueira/
FREE
Vwap RSJ
JETINVEST
4.88 (8)
VWAP RSJ is an indicator that plots the Hourly, Daily, Weekly and Monthly  VWAP Lines. Large institutional buyers and   mutual funds   use the VWAP ratio to help move into or out of stocks with as small of a market impact as possible. Therefore, when possible, institutions will try to buy below the VWAP, or sell above it. This way their actions push the price back toward the average, instead of away from it. Based on this information I developed this indicator that combines 4 types of VWAP Tim
FREE
This simple indicator paints with a darker color on the volume bar when the quantity traded is above the average of select number of periods of the volume itself, highlighting the moments when there was a large volume of deals above the average. It is also possible to use a configuration of four colors where the color tone shows a candle volume strength. The indicator defaults to the simple average of 20 periods, but it is possible to change to other types of averages and periods. If you like t
FREE
Aggression Wave RSJ
JETINVEST
4.83 (6)
This indicator sums up the difference between the sells aggression and the buys aggression that occurred in each Candle, graphically plotting the waves of accumulation of the aggression volumes.   Through these waves an exponential average is calculated that indicates the direction of the business flow. Note: This indicator DOES NOT WORK for Brokers and/or Markets WITHOUT the type of aggression (BUY or SELL).   Be sure to try our Professional version with configurable features and alerts:  Agre
FREE
This simple indicator paints with a darker color on the volume bar when the quantity traded is above the average of select number of periods of the volume itself, highlighting the moments when there was a large volume of deals above the average. It is also possible to use a configuration of four colors where the color tone shows a candle volume strength. The indicator defaults to the simple average of 20 periods, but it is possible to change to other types of averages and periods. If you like t
FREE
This indicator calculates the difference between the SELL aggression and the BUY aggression that occurred in each Candle, plotting the balance of each one graphically. Note: This indicator DOES NOT WORK for Brokers and/or Markets WITHOUT the type of aggression (BUY or SELL). Be sure to try our   Professional   version with configurable features and alerts:   Delta Agression Volume PRO Settings Aggression by volume (Real Volume) or by number of trades (Tick Volume) Start of the Aggression Delta
FREE
Funcionamento: O Painel  Netting Panel RSJ  funciona com   qualquer ativo   e em   qualquer tempo gráfico . Ele funciona em contas do tipo " Netting " e " Hedge ", mas gerencia apenas uma posição por ativo, por isso o nome   Netting.   Se ele for executado em contas do tipo " Hedge ", ele fará o gerenciamento e proteção   apenas da posição mais antiga , ou seja, da primeira posição que foi aberta por ele. Em contas " Netting " quando os botões " SELL " ou " BUY " forem pressionados,   ocorrerá
FREE
RENKO PRICE ACTION ATR 是通过构建 Renko 图表开发的“智能交易系统”,其中每个 BRICK 的大小都通过用户选择的时间段的 ATR 计算得出。 Renko 图表旨在滤除微小的价格变动,从而使交易者更容易关注重要趋势。 由于其检测价格趋势的效率,还可以清楚地识别支撑和阻力以及顶部和底部背离,从而更好地利用交易机会。 手术 RENKO PRICE ACTION ATR 适用于任何货币对。 RENKO PRICE ACTION ATR 具有出色的实时更新性能。 设置 ATR Calculation Timeframe:用户选择的 RENKO PRICE ACTION ATR 周期,以应用 ATR 的平均值并计算/重新计算每个 BRICK 的大小。 ATR 计算平均周期:用户选择的 ATR 平均周期为 RENKO PRICE ACTION ATR 执行每个 BRICK 的大小计算。 ATR 大小的百分比:用于形成每个 BRICK 的计算大小的百分比。 如果您还有问题,请通过直接消息与我联系:  https://www.mql5.com/zh/users/ro
指标供需 RSJ PRO 计算并在图表上绘制“供应”和“需求”区域,识别区域类型(弱、强、已验证、已证明),并在区域重新测试的情况下显示它的次数被重新测试。 “供应”区是出现供大于求的价格区域,导致价格下跌。 “需求”区域是需求大于供应的价格区域,从而推高价格。 请务必尝试我们具有可配置功能和警报的专业版本: Suppy Demand RSJ PRO 区域分类 弱:价格区域,如果重新测试,可能会被违反。 强:价格区域已经改变了趋势方向,不太可能很快被重新测试。 已验证:强价区,最多有1-3次复测,但价格未能突破该区。 证明:强势价格区域,有3次或以上复测,但价格未能突破该区域。 Broken/Turncoat:被打破的价格区域,在支撑的情况下成为阻力,在阻力成为支撑的情况下。 设置 显示区域标签和信息:真实案例在区域的右侧写下区域类型和重新测试的次数(如果适用)。 注意:仅当图表偏移选项处于活动状态时才有效。 字体颜色:设置文本的颜色 字体大小:设置字体大小 如果您仍有疑问,请通过直接消息与我联系: https://www.mql5.com/zh/users/robsju
Aggression Wave PRO 是一个指标,用于监测买卖谈判的侵略量的分歧、强度和连续性。 Agrression Wave PRO 具有允许您查看超过当天累积增量的功能。 注意:该指标不适用于没有攻击类型(买入或卖出)的经纪商和/或市场。加密货币和外汇不提供此类信息,也就是说,它不能与它一起使用。 手术     可以设置音量类型:         真实交易量(在此模式下,每笔资产交易的交易量都会被计算在内)         Ticks Volume(在此模式下,将统计资产的交易数量。)     可以定义计算的开始时间:         当前日期         最后一天         LAST_TWODAYS         LAST_FOURDAYS         上个星期         上个月         LAST_6MONTHS         去年         LAST_2YEARS         ALL_AVAILABLE_DAYS     可以配置信号线:         方法:SMA / EMA / SMMA / LWMA      
Delta Aggression Volume PRO is an indicator developed to monitor the strength and continuity of the aggression volume of sell and buy negotiations. Note: This indicator DOES NOT WORK for Brokers and/or Markets WITHOUT the type of aggression (BUY or SELL). Cryptocurrencies and Forex do not provide this type of data, that is, it does not work with them. O Delta Agrression Volume PRO has features that allow you to view beyond the delta volume of the day. Operation Multi symbols  (those who provid
指标供需 RSJ PRO 计算并在图表上绘制“供应”和“需求”区域,识别区域类型(弱、强、已验证、已证明),并在区域重新测试的情况下显示它的次数 被重新测试。 “供应”区是出现供大于求的价格区域,导致价格下跌。 “需求”区域是需求大于供应的价格区域,从而推高价格。 区域分类 弱:价格区域,如果重新测试,可能会被违反。 强:价格区域已经改变了趋势方向,不太可能很快被重新测试。 已验证:强价区,最多有1-3次复测,但价格未能突破该区。 证明:强势价格区域,有3次或以上复测,但价格未能突破该区域。 Broken/Turncoat:被打破的价格区域,在支撑的情况下成为阻力,在阻力的情况下成为支撑。 设置 视觉设置: 显示弱区:将显示分类为弱的区域。 显示未测试区域:将显示未测试区域。 Show Broken Zones:显示被破坏的区域 合并区域:指标将非常接近的区域转换为更宽的区域 扩展区域:指标将检查是否有与绘制区域对应的先前限制,并将扩展相同 计算设置: 用于分析的蜡烛数量:指标将用于对区域进行分类的蜡烛数量。 它可以在 500 到 5000 根蜡烛之间。 ATR 周期:用于计算 AT
Trend WDO B3
JETINVEST
5 (1)
Trend WDO B3 是为 MT5 平台创建的专业交易系统,并优化与巴西 B3 上的 MINI DOLAR INDEX (WDO) 配合使用. 系统在多个时间段(1M、5M、15M、30M、H1、H4、D1)中使用模糊逻辑来识别价格趋势,根据计算结果在每个时间段应用权重。 识别趋势后,系统根据平均波动率设置止损单(买入或卖出),开仓时,EA通过追踪止损进行交易,始终追求利润最大化. 主要特点 不使用鞅 不使用网格 在图表上显示通过模糊算法计算出的趋势 适用于任何时间范围 可配置的工作时间 可配置的开口间隙控制 可配置的批量增加动态模式 4 个可配置的追踪止损水平 通过访问包含产品手册和视频的博客了解更多详细信息和信息:  https://www.mql5.com/pt/blogs/post/745864 如果您还有问题,请通过直接消息与我联系:  https://www.mql5.com/zh/users/robsjunqueira/
Trend WIN B3
JETINVEST
5 (4)
Trend WIN B3 是为 MT5 平台创建的专业交易系统,并优化与巴西 B3 上的 MINI FUTURE INDEX (WIN) 配合使用. 系统在多个时间段(1M、5M、15M、30M、H1、H4、D1)中使用模糊逻辑来识别价格趋势,根据计算结果在每个时间段应用权重。 识别趋势后,系统根据平均波动率设置止损单(买入或卖出),开仓时,EA通过追踪止损进行交易,始终追求利润最大化. 主要特点 不使用鞅 不使用网格 在图表上显示通过模糊算法计算出的趋势 适用于任何时间范围 可配置的工作时间 可配置的开口间隙控制 可配置的批量增加动态模式 4 个可配置的追踪止损水平 通过访问包含产品手册和视频的博客了解更多详细信息和信息:  https://www.mql5.com/pt/blogs/post/745842 如果您还有问题,请通过直接消息与我联系:  https://www.mql5.com/zh/users/robsjunqueira/
SniperBot EURUSD
JETINVEST
5 (1)
EA 使用波动率、点差、频率和时机来决定何时交易。 EA 使用限价单方法开仓。 在这种情况下,滑点至多在执行条目时为正。 EA 使用追踪止盈逻辑,因为系统的重点是在保护您的资本的同时赚钱。 大多数交易都很快关闭,就像狙击手爆头一样。 主要特点 不使用鞅 不使用网格 优化货币对:EURUSD 时间范围:M5 请注意这一点:该 EA 每天只在一段时间内进行交易,从展期前几分钟到展期后几分钟。 您不需要 .set 文件,所有设置都存储在 EA 中 如果您的经纪商使用后缀(例如 XXXXXX.a),您不必担心,因为 EA 会自动识别。 如何安装 该系统是独立的,应该在 VPS 上持续运行。 建议在低点差 ECN 经纪商上运行 EA。 该帐户可以是 Netting 或 Hedging。建议杠杆为 1:500。 在 M5 时间范围内运行 EURUSD 对 选择固定手数或启用自动手数 如果您选择了自动手数,您应该为每 0.01 手选择货币关系 低风险:200,正常风险:100,高风险:50 推荐账户余额:100$ 如果您仍有疑问,请通过直接消息与我联系: https://www.mql5.c
Sniper Major
JETINVEST
5 (1)
EA 使用波动率、点差、频率和时机来决定何时交易。 EA 使用限价单方法开仓。 在这种情况下,滑点至多在执行条目时为正。 EA 使用追踪止盈逻辑,因为系统的重点是在保护您的资本的同时赚钱。 大多数交易都很快关闭,就像狙击手爆头一样。 主要特点 不使用鞅 不使用网格 优化的货币对:EURUSD |英镑兑美元 |美元兑日元 |美元兑瑞郎 时间范围:M5 请注意这一点:该 EA 每天只在一段时间内进行交易,从展期前几分钟到展期后几分钟。 一张图表设置:您只需要一张图表即可交易所有优化的交易品种 多种货币对支持 您不需要 .set 文件,所有设置都存储在 EA 中 如果您的经纪商使用后缀(例如 XXXXXX.a),您不必担心,因为 EA 会自动识别。 如何安装 该系统是独立的,应该在 VPS 上持续运行。 建议在低点差 ECN 经纪商上运行 EA。 该帐户可以是 Netting 或 Hedging。建议杠杆为 1:500。 在 M5 时间范围内运行 EURUSD 对 启用多对 = 设置为 TRUE 选择固定手数或启用自动手数 如果您选择了自动手数,您应该为每 0.01 手选择货币关系
筛选:
Damian Blaha
386
Damian Blaha 2025.03.27 04:11 
 

отличный индикатор

JETINVEST
305561
来自开发人员的回复 Roberto Sant Ana Junqueira 2025.03.27 10:41
tks for the review
Flaviona
124
Flaviona 2025.03.23 21:52 
 

用户没有留下任何评级信息

JETINVEST
305561
来自开发人员的回复 Roberto Sant Ana Junqueira 2025.03.25 10:47
tks for the review
Rafal Krzysztof Manuszewski
2326
Rafal Krzysztof Manuszewski 2024.10.06 17:09 
 

👍

JETINVEST
305561
来自开发人员的回复 Roberto Sant Ana Junqueira 2024.10.08 17:59
Obrigado por seu Review
Alessandro Lopes Da Silva
274
Alessandro Lopes Da Silva 2024.02.26 19:16 
 

Pessoal deixo aqui meu comentário e espero contribuir com voces! Esse indicador juntamente com medias moveis 9,21,50 no ativo US30 é uma maquina de fazer dinheiro, principalmente para quem trabalha com mesa proprietária. O melhor horário para operar é o de New York, excelentes gatilhos de entradas e saídas. Observação importante, procure sempre ir a favor da tendencia. No demais, muito obrigado Roberto Junqueira!!!

JETINVEST
305561
来自开发人员的回复 Roberto Sant Ana Junqueira 2024.02.26 19:18
Obrigado por seu Review Alessandro
fj6hCuoc
119
fj6hCuoc 2023.09.12 09:46 
 

An excellent Volume Indicator

JETINVEST
305561
来自开发人员的回复 Roberto Sant Ana Junqueira 2024.02.26 19:18
tks for the review
CARLOS CESTARI
33
CARLOS CESTARI 2022.03.31 05:12 
 

Muito bom, fica melhor se for usado junto com o Heiken_Ashi. Obrigado.

JETINVEST
305561
来自开发人员的回复 Roberto Sant Ana Junqueira 2024.02.26 19:19
obrigado pelo review
robkey
24
robkey 2022.02.13 11:19 
 

muito bom obrigado

JETINVEST
305561
来自开发人员的回复 Roberto Sant Ana Junqueira 2024.02.26 19:19
obrigado pelo review
mchelpmf
186
mchelpmf 2022.02.05 14:31 
 

The indicator has potential, it is promising

JETINVEST
305561
来自开发人员的回复 Roberto Sant Ana Junqueira 2024.02.26 19:19
tks for the review
T0uro22
34
T0uro22 2021.10.31 20:30 
 

Gostei... obrigado

JETINVEST
305561
来自开发人员的回复 Roberto Sant Ana Junqueira 2023.09.15 16:34
obrigado pelo review
Guilherme Guimaraes Dias
756
Guilherme Guimaraes Dias 2021.08.31 03:37 
 

用户没有留下任何评级信息

JETINVEST
305561
来自开发人员的回复 Roberto Sant Ana Junqueira 2021.09.03 21:49
Obrigado Guilherme
Fabio_Novaes
175
Fabio_Novaes 2021.06.30 21:44 
 

用户没有留下任何评级信息

JETINVEST
305561
来自开发人员的回复 Roberto Sant Ana Junqueira 2021.06.30 23:10
tks
33359
82
33359 2021.06.23 06:10 
 

Хороший индикатор.

JETINVEST
305561
来自开发人员的回复 Roberto Sant Ana Junqueira 2021.06.30 16:05
Tks for your review.
Marilise Ravaglio Da Cunha Junqueira
386
 

用户没有留下任何评级信息

JETINVEST
305561
来自开发人员的回复 Roberto Sant Ana Junqueira 2021.06.30 16:05
Tks for your review.
30886094
14
30886094 2021.05.03 21:00 
 

Olá roberto, tudo bem? Indicador perfeito e muito bom. Ele esta me ajudando bastante. Parabéns!

Abraços,

Abel

JETINVEST
305561
来自开发人员的回复 Roberto Sant Ana Junqueira 2021.06.30 16:05
Tks for your review.
回复评论