Pivot Point Multi Method
- 指标
- Zhilwan Hussein
- 版本: 1.30
- 激活: 5
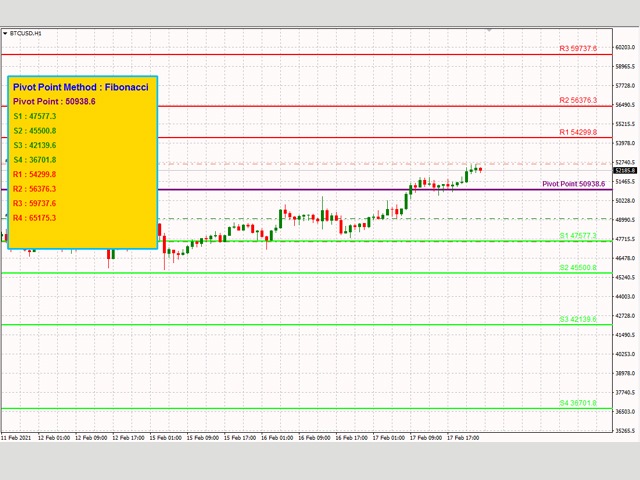
Pivot Point Multi Method is a fully automatic pivot point indicator and indicate support and resistances (S1,S2,S3,S4,R1,R2,R3,R4) based on four Methods that you can select on of them
Pivot point detection and drawing support resistances Methods(Classic ,Camarilla ,Woodie ,Fibonacci)
Pivot Point Multi Method is working on all time frames and all currency pairs and gold silver and crypto currencies .
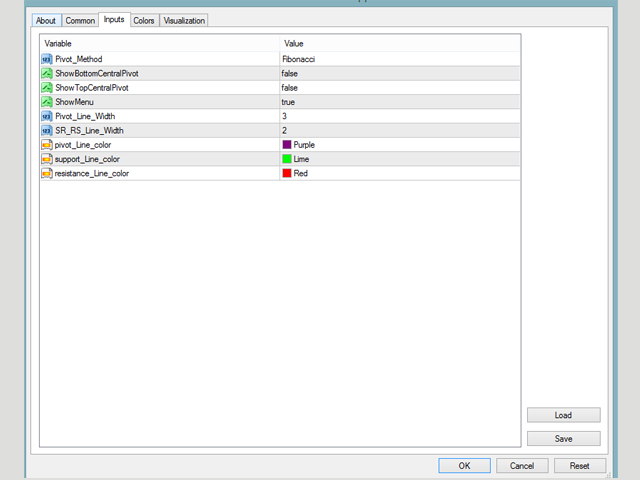
Recommended Setting :
- Pivot_Method select one of the methods (Classic ,Camarilla ,Woodie ,Fibonacci)
- ShowBottomCentralPivot show or hide bottom Central pivot
- ShowTopCentralPivot show or hide top central pivot
- ShowMenu show or hide menu in chart
- Pivot_Line_Width insert pivot line width
- SR_RS_Line_Width insert support and resistance line width
- pivot_line_color select pivot line color
- support_line_color select support line color
- resistance_line_color select resistance line color
#pivotPoint
#pivotpoint
#support resistance
#support
#resistance
#multimethod
#multi method
#Classic
# Camarilla
#Woodie
#Fibonacci