Growing Bands Sh
- 指标
- Nikolay Likhovid
- 版本: 1.1
- 更新: 18 十一月 2021
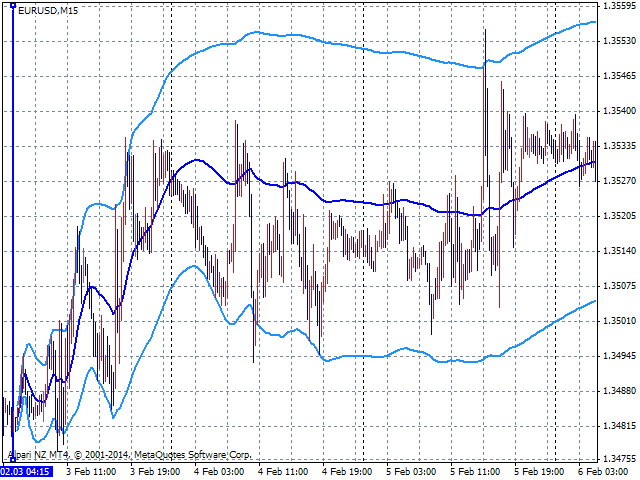
Do you use dynamic ranges (like Bollinger Bands or Envelopes) in your trading? A fixed period is usually used for such calculations. But is such approach relevant to the very nature of the market? In fact, the price chart consists of a series of successive processes - trends and flats. In this case, we can talk about the internal development logic inside a single process only. Therefore, the nature of the market is better described by dynamic ranges designed for the processes occurring "here and now".
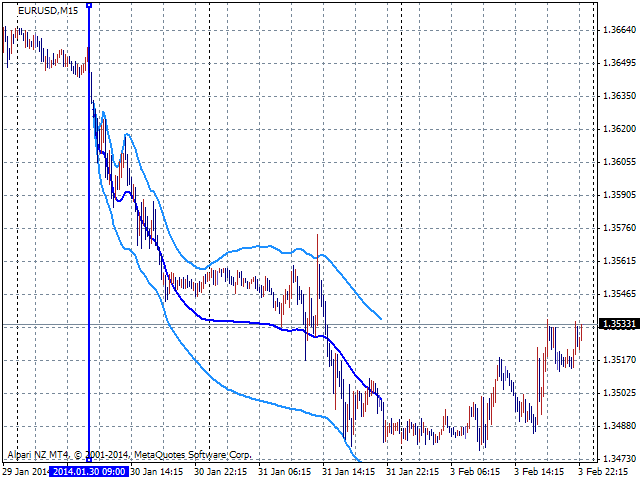
Growing Bands Sh is a product using such an approach. Instead of setting a period, you should set the beginning of the process currently occurring on the market. Since traders usually can easily highlight this moment on the chart, this approach is not only the most versatile, but also the most natural.
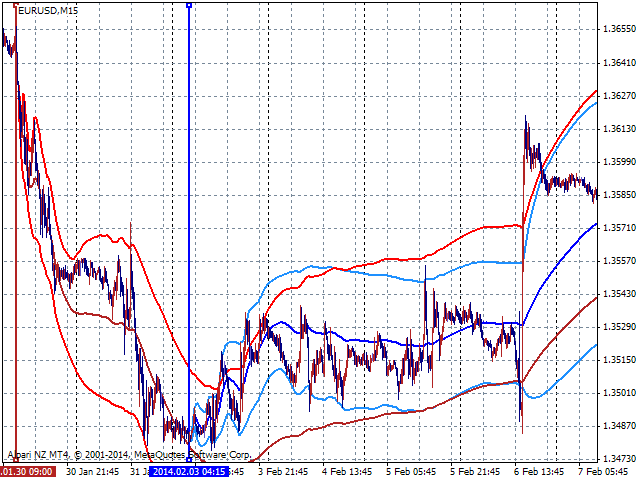
Calculation start time depends on the location of an object with a certain name on the chart. The default name is SGB. You can specify any name via the indicator's appropriate parameter. Different names allow you to simultaneously track different processes when several indicator copies are launched on the chart. For example, you may allocate "older" and "younger" processes.
If there is no required object on the chart during the launch, the indicator creates a vertical line with the necessary name near the chart's right edge. To change the calculation start point, double left-click the line to highlight and drag it to the desired location. Generally, any object can be used. Only its name and location on the chart matter.
Calculations are performed when opening new bars. Obviously, calculations on each tick have no point for such an indicator. Besides, they cause additional load on the terminal. Therefore, the indicator should be relaunched for immediate recalculation after changing the starting point. Otherwise, the results of the new calculation appear only after a new bar is opened.
Growing Bands Sh is a demo version of Growing Bands paid indicator. Unlike the full version, it does not handle the last 100 bars of the chart. If for some reason an object setting the start time is located in that area, the alert is displayed at each new bar.
The indicator has four parameters:
- K - set the band width;
- GBName - set the name of the object indicating the start location;
- MidColor - set the range midline color;
- BorderColor - set the range border color.










Einen Stern für das Demo. Man sieht nicht viel. Eine andere Einschränkung wäre sicher besser gewesen.Habe ich gelöscht.