Advanced reversal system RRR 1 to 5
- 指标
- Andrii Malakhov
- 版本: 1.0
- 激活: 5
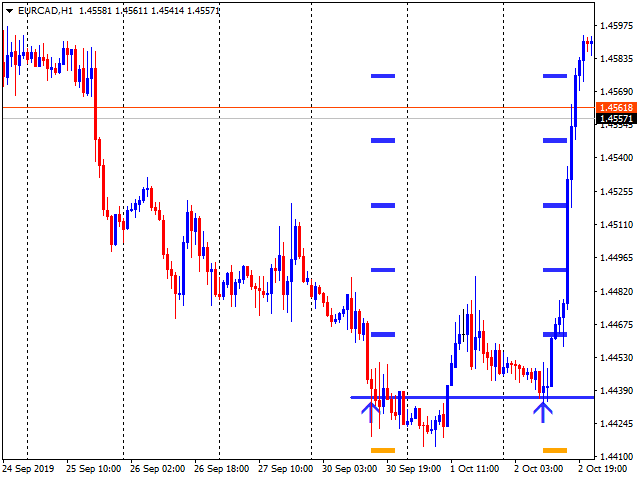
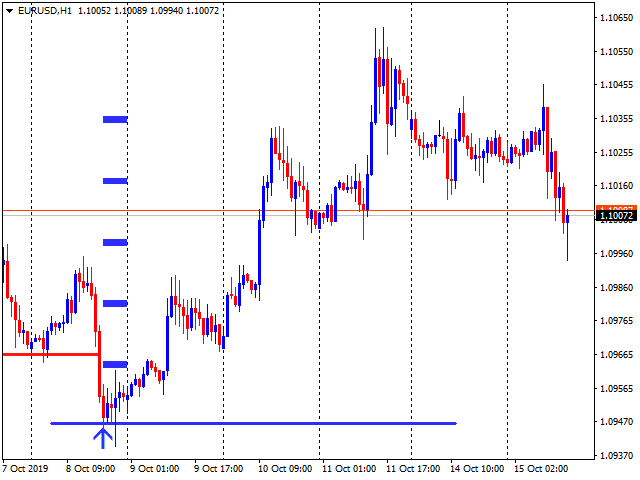
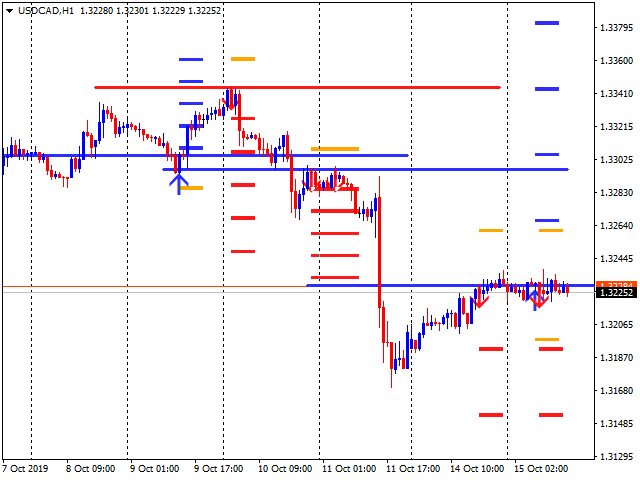
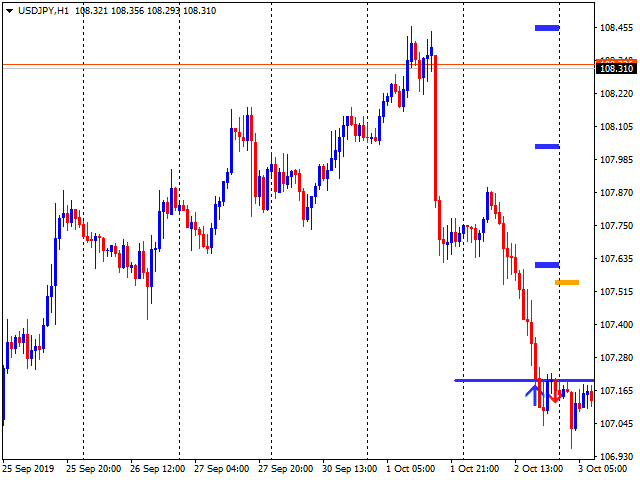
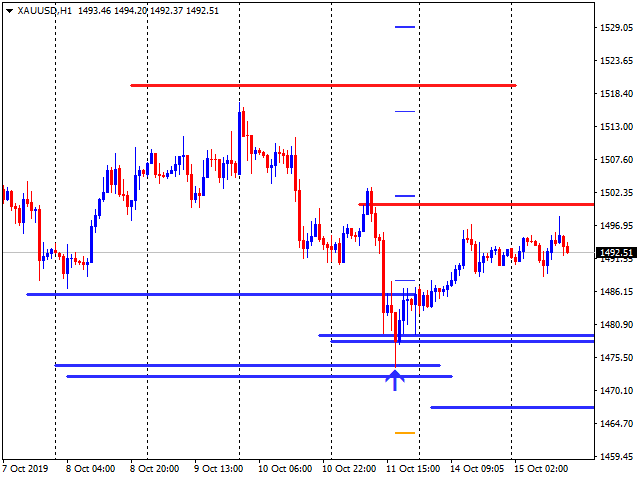
The indicator shows entry points with Risk-Reward-Ratio 1 to 5. Main timeframe H1. Works on every pair. The main logic - is to find a reversal level, and then track the price reaction to this level. Doesn't need any settings. As a standard, it paint 5 levels of the same take-profit (red / blue for sellers and buys) and 1 stop-loss level - orange.
ATTENTION! The full version of indicator. You can test full work of indicator free only on the USDCAD pair here https://www.mql5.com/en/market/product/42903
Indicators algorithm:
1) first looks for oblique mirrors (oblique mirror levels).
2) from the mirror level draw the entry level at a certain distance from the price.
3) waits for the moment until the price touch to this level.
4) depending on how the price approached the level - touched it or break it, the indicator makes recommendations to buy for a reversal or sell to continue the movement after a retest.
Indicator settings for H1:
- sell_color- color of sell levels and arrows
- buy_color - color of buy levels and arrows
- Max history - how deep to go through history (300 bars by default)
- TP count - how many to draw the same take-profit (5 by default)
- Entry point wait bars - how many bars to draw the reversal level (300 bars by default)
- Show angle mirrors - show oblique mirrors (oblique mirror levels)
- Show arrows - show entry arrows
- Show alerts - show alerts
- Send alerts and push messages - send alerts and push messages