Winshots ADX Trend Scanner
- 指标
- Pawel Michalowski
- 版本: 1.5
- 更新: 18 三月 2024
- 激活: 5
朝着强劲趋势方向交易可以降低风险并增加潜在利润。通常,平均方向指数(ADX)用于确定价格何时出现强劲趋势。在许多情况下,它是最终的趋势指标!毕竟,这种趋势可能是您的朋友,但这肯定有助于了解您的朋友是谁。
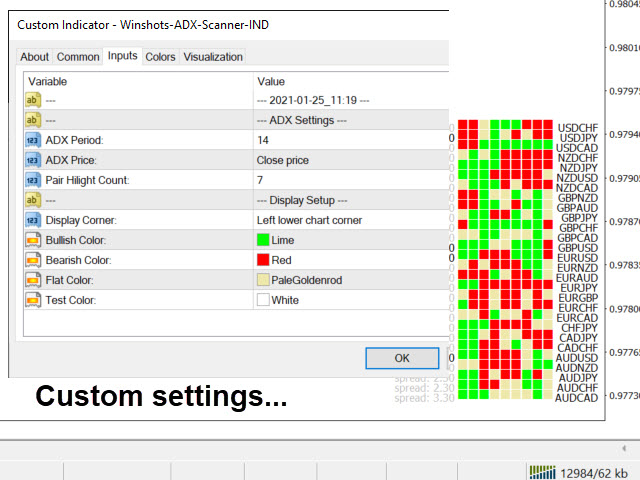
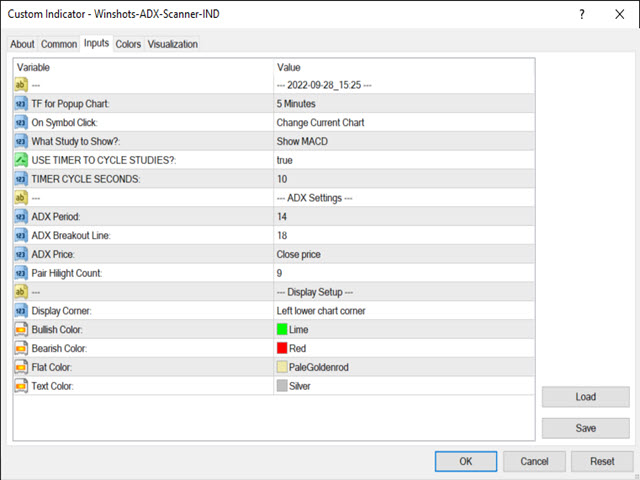
ADX用于量化趋势强度。 ADX的计算基于给定时间内价格范围扩展的移动平均值。尽管可以使用其他时间段,但是默认设置为14条。 ADX可用于任何交易工具,例如外汇对,股票,共同基金,交易所买卖基金,期货和加密货币。
ADX绘制为一条单线,其值的范围从零的低到100的高。无论价格是上涨还是下跌,它都会记录趋势强度。通常,将标准ADX指标与两个方向运动指标(DMI)线绘制在同一窗口中,从中可以得出ADX。
但是,当您使用标准的ADX指示器时,它可能会使所有直线曲折和交叉。不仅如此,当您在不同的乐器和不同的时间范围之间切换时,ADX线可能会沿相反的方向交叉,从而使您更加困惑!
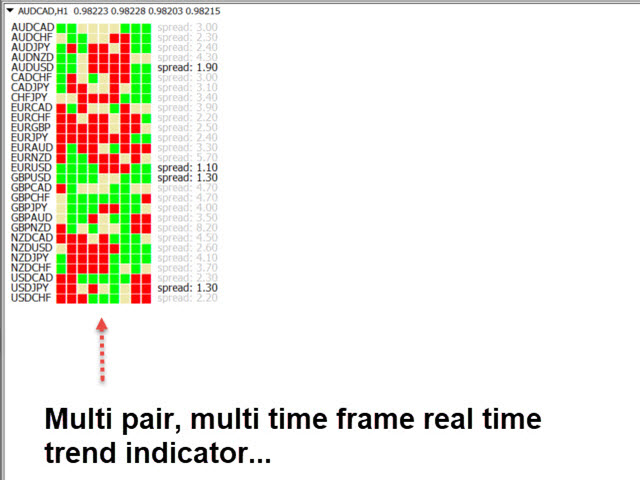
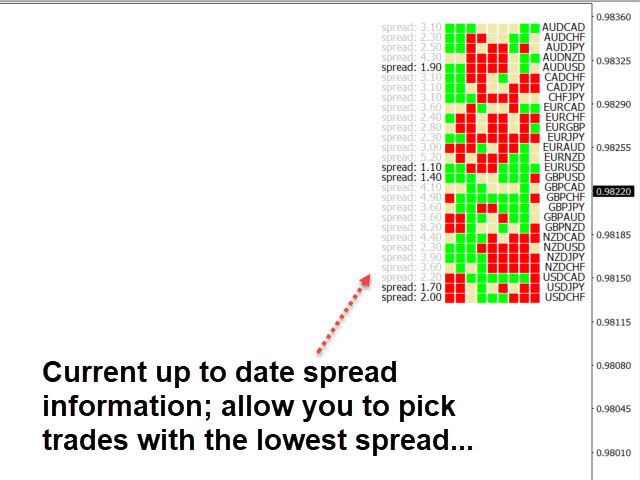
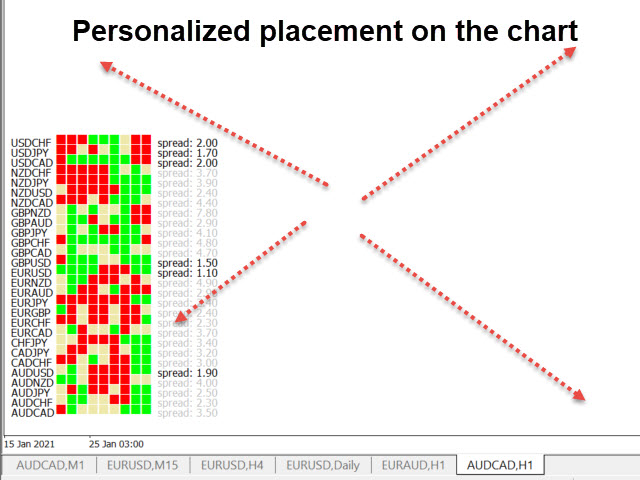
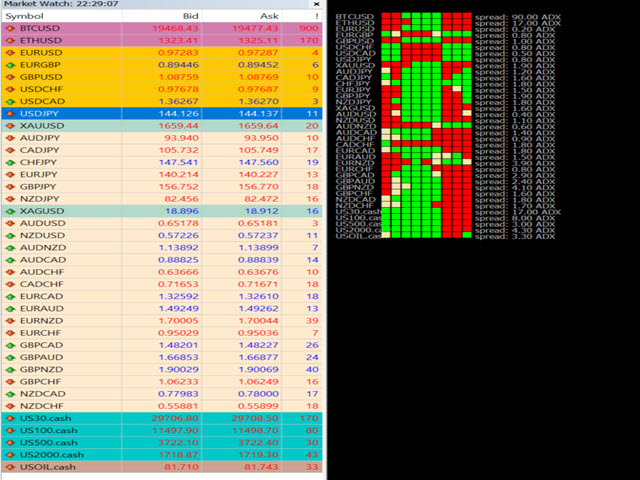
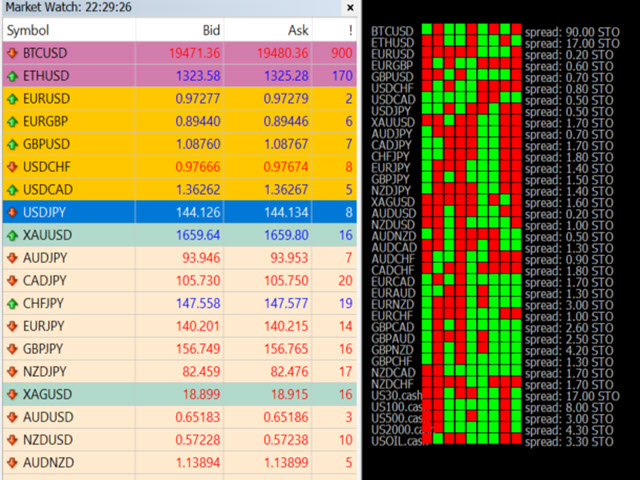
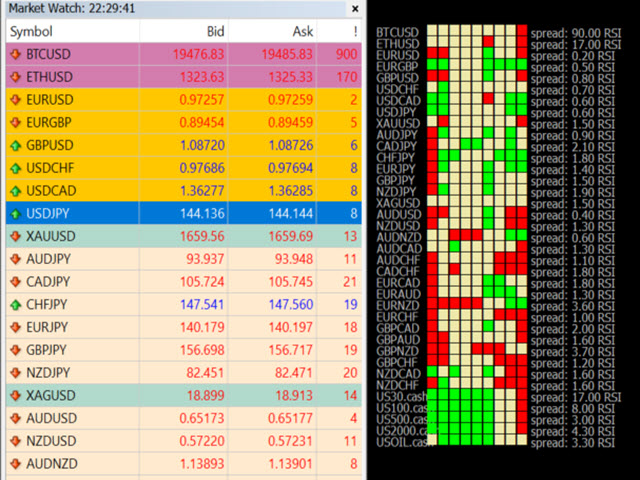
Winshots ADX趋势扫描仪指示器可以解决此问题。在一个简单的视图中,您可以在许多不同的外汇货币对上的所有时间范围内快速确定ADX趋势的状态!是的,你没看错。无需再点击不同外汇对的不同时间范围,看着像热意大利面条那样纵横交错的ADX线。除了准确显示每个FX对和每个时间框架上的趋势外,Winshots ADX趋势扫描仪指示器还突出显示了在所有时间框架上都具有强烈趋势的FX对。此附加功能使您可以快速确定市场上是否有强劲的动力,以及在您选择的时间内是否值得交易。
用户没有留下任何评级信息