Relative Equilibrium Index
- 指标
- Andrey Sorokin
- 版本: 1.2
- 更新: 30 一月 2023
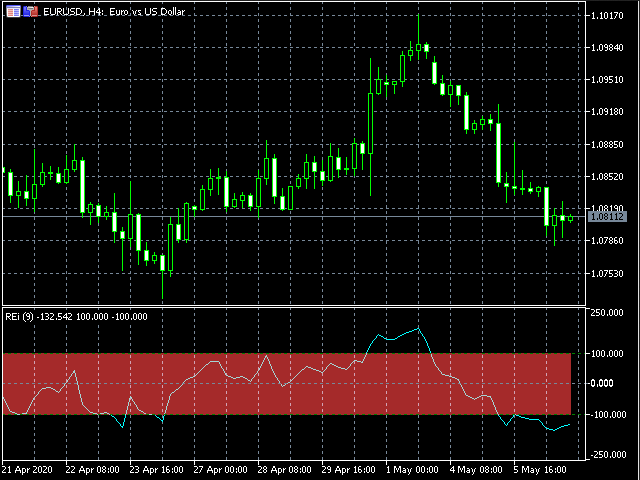
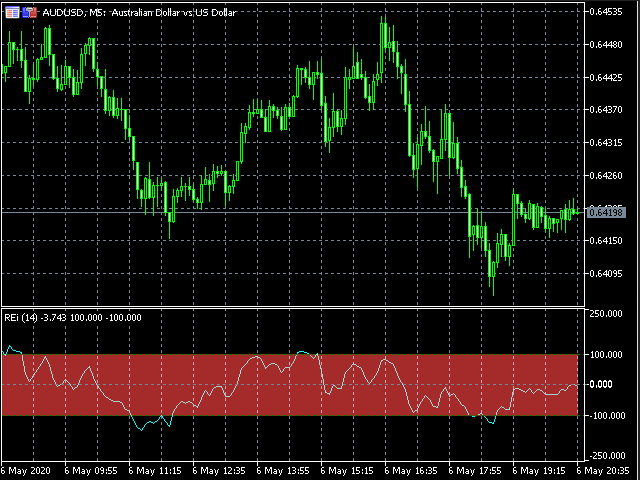
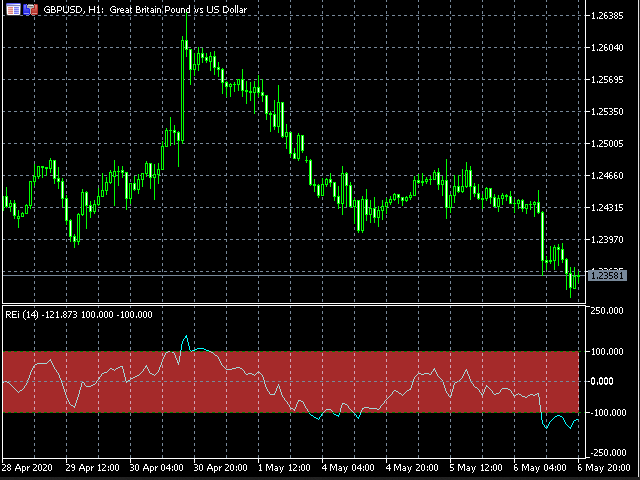
The Relative Equilibrium index (REi) is a technical analysis indicator that shows the direction and strength of a trend and indicates the probability of its change. It shows the ratio of the average price increase to the average fall over a certain period of time. The value of the index allows you to assess whether buyers or sellers had a stronger influence on the price over a set period of time and to assume further developments. The indicator is characterized by simplicity of interpretation and quality of signals. The entry points given by the indicator show a good risk-profit ratio in an active market. The indicator line draws figures of technical analysis - "head-shoulders", "double top" and others that are used when making trading decisions.
Settings:
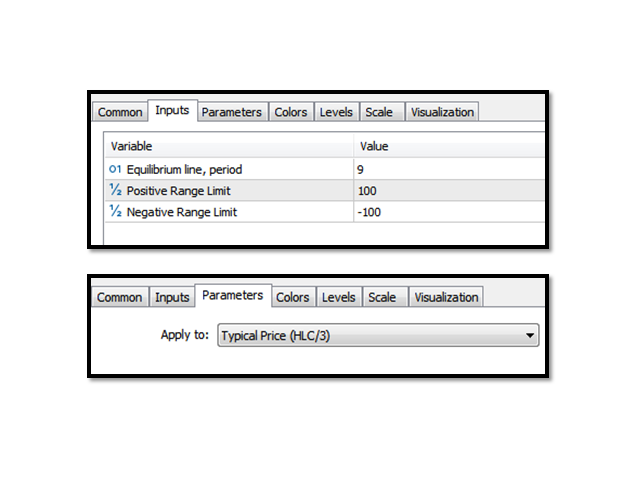
The indicator does not require complex settings. The only parameter, REi Period, is set to "9" by default, and in most cases this value is effective. However, in certain phases of the market in certain time frames, other settings may prove to be better.
Signals:
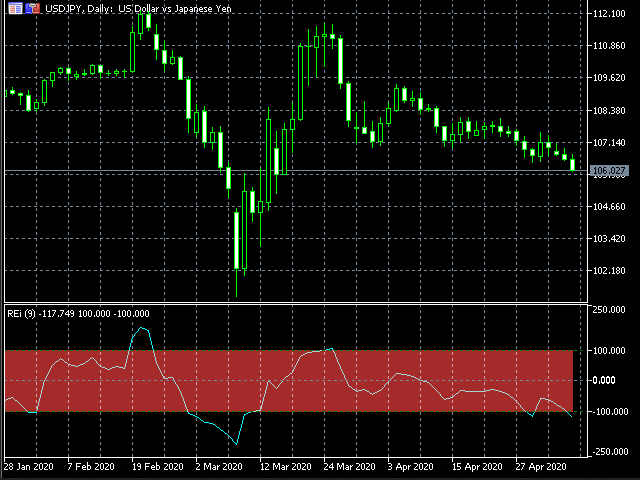
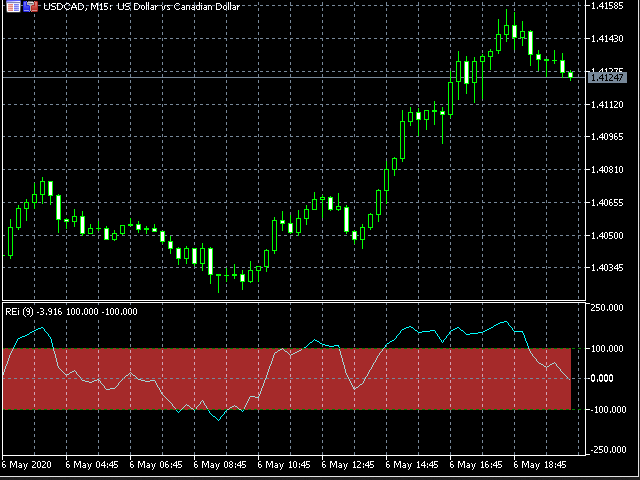
• overbought/oversold - when the REi indicator value is above "100" or below " -100", respectively;
• crossing the zero level line-indicates a change in the trend, if above" 0 "the bullish trend, if below" 0 " the bearish trend;
• divergence / convergence — when the indicator line forms extremes in the direction opposite to the price movement;
• technical analysis figures are applicable to the indicator chart and help predict the beginning and end of a trend with high probability;
• the trend on the indicator usually coincides with the trend on the price chart up to any of the above events.
The REi indicator can be used as a filter. You can't buy when the market is already overbought and the indicator line is above the positive range limit. You can't sell when the market is already oversold and the indicator line is below the negative range limit.







bardzo dobry