Double Trend Signals
- 指标
- Shiffolika Kapila
- 版本: 2.0
- 激活: 10
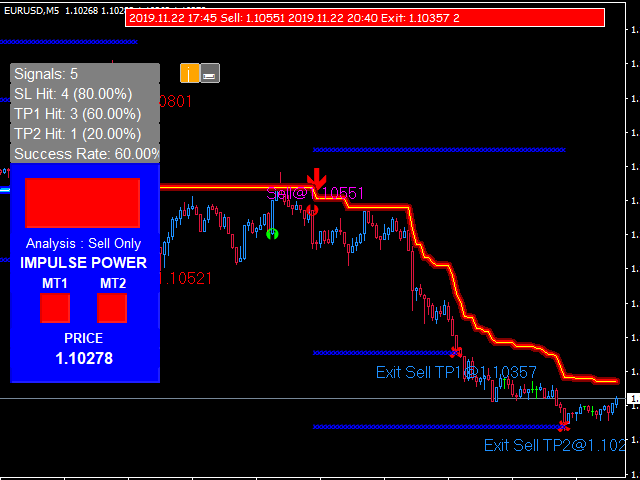
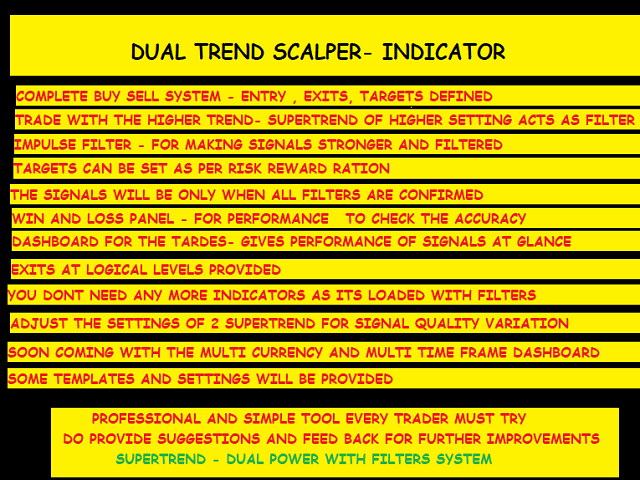
Dual Trend Scalper
Advantages You Get
Easy, visual and effective trend detection. you can find the IMPULSE COLOR PANEL FOR QUICK TREND DETECTION
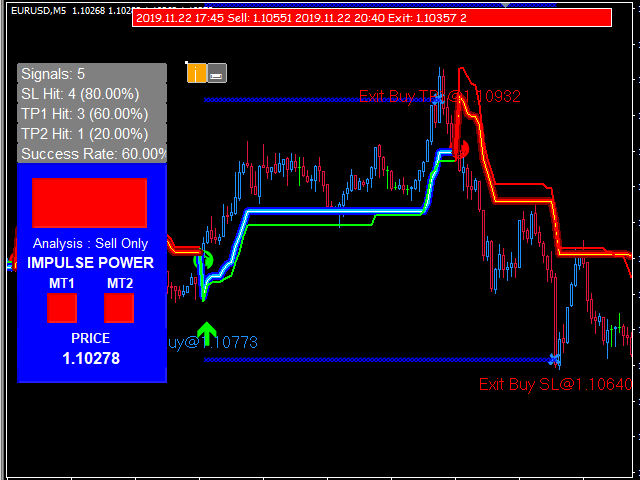
Gives you the ability to filter and further improve your trading strategies. YOU HAVE TREND DETECTION IMPULSE FILTER , AS WELL AS 2 LEVELS OF SUPERTREND.
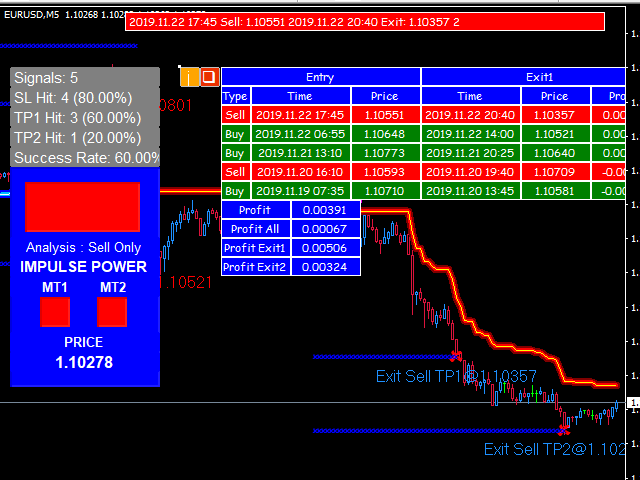
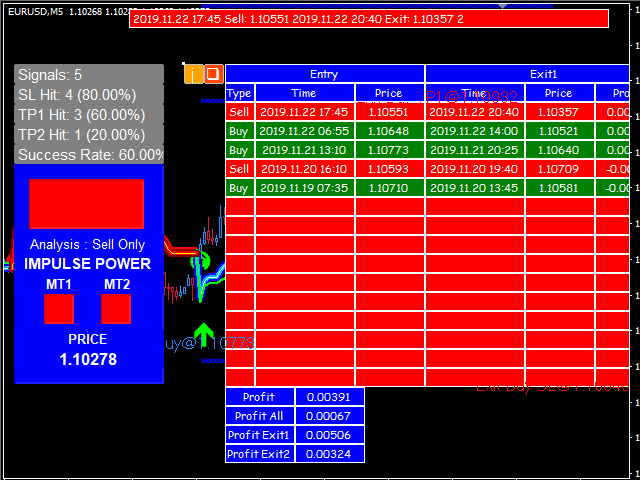
Enhanced statistics calculation following the entry point, take profit and exit signal. ENTRY CAN BE AS PER VARIATION OF SETTINGS AND PARAMETERS, SL AND TARGETS ALSO CAN BE ADJUSTED
Never repaints, never backpains, never recalculates. THERE IS A SHIFT PROVIDE=0 WILL BE MORE AGGRESSIVE AND THE 1 SETTING AS AFTER CLOSE OF BAR AND TREND.
Signals strictly on the "Close of the bar".-USE SHIFT =1
Works in all symbols and all timeframes.
Integrated pop-up, email, push notification and sound alerts.( MOBILE NOTIFICATION WILL GET ADDED)
INPUT :
Show Original Arrow 1 = true
Show Original Arrow 2=true
Show Original Line 1=true
Show Original Line 2=false
SuperTrend 1 Setting
Nbr_Periods1 = 30;
Multiplier1 = 3.0;
SuperTrend2 = ">>==
SuperTrend 2 Setting
Nbr_Periods2 = 10;
Multiplier2 = 2.0;
MACD Filter Setting
NOFILTER,
FILTER_M1,
FILTER_M1_M2,
MACDSelect = FILTER_M1_M2;
TimeFrame1 = PERIOD_CURRENT;
TimeFrame2 = PERIOD_M15;
Fast_EMA_Period = 12;
Slow_EMA_Period = 26;
Signal_Period = 9;
Applied_Price = PRICE_CLOSE;
SignalShift = 0;
UseTimeSession = false;
SessionDateStart = D'2019.01.01 00:00';
SessionDateEnd = D'2019.12.31 23:59';
EntryOnly = FALSE;
Can Exit by Opposite Signal = false;
IndicatorAlerts = true;
EntryAlerts = true;
ExitAlerts = true;
Reentry = false;
">>====Target/stop based Setting====<<";
ShowExit1 = true;
ShowExit2 = true;
ADR_SL=2.5;
ADR_TP1=3;
ADR_TP2=5;
RightAlign = true;
LinesShiftRight = 10;
LabelsColor = DimGray;
LabelsFontSize = 10;
LabelsShiftHorizontal = 10;
LabelsShiftVertical = 1;
ADR for SL/TP ***";
ADR for calculation SL/TP
ADRTimeFrame=30;
ADRPeriod=50;
ArrowEntryBuyStyle = 233;
ArrowEntrySellStyle = 234;
ArrowExitStyle = 251;
DistanceEntryLabel = 100;
DistanceExitLabel = 15;
WidthArrowEntry = 3;
WidthArrowExit = 3;
ColorTextBuy = DodgerBlue;
ColorTextSell = Magenta;
ColorTextExitBuy = Red;
ColorTextExitSell = DodgerBlue;
FontSizeLabel = 12;
"========= Dashboard Setting ===========";
Show_Information = true;
SoundClick = "Alert.wav";
FontSize = 8;
Corners = Left;