Scalper Assistant
- 指标
- Pavel Verveyko
- 版本: 1.1
- 更新: 4 八月 2022
- 激活: 5
The indicator is a trading system for short-term trading.
Scalper Assistant helps to determine the direction of the transaction, and also shows the entry and exit points.
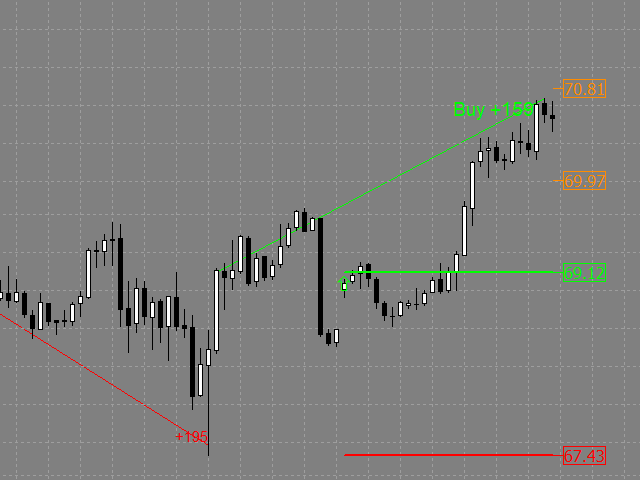
The indicator draws two lines (possible points for opening positions).
At the moment of the breakdown of the upper line up (and when all trading conditions are met), an up arrow appears (a buy signal), as well as 2 goals.
At the moment of the breakdown of the lower line down (and when all trading conditions are met), a down arrow (a sell signal) appears, as well as 2 targets.
When the price moves in the direction of the target, the maximum movement length in points is displayed.
When the second goal is reached, the transaction is considered closed.
The indicator was developed for time periods: M5, M15, M30, H1.
Scalper Assistant has a system of alerts about the opening and closing of the signal.
Settings:
- Ind_Period - the period of the indicator.
- color_Buy - the color of the buy signal.
- color_Sell - the color of the sell signal.
- color_Target - the color of the targets.
- price_levels_Thickness - the thickness of the signal lines.
- price_levels_Style - style of signal lines.
- price_levels_Back - display of signal lines in the background.
- text_Size - font size.
- text_Font - font.
- Past_Signals - display of the history of the indicator signals.
- past_signals_Tickness - the thickness of the indicator signal lines.
- past_signals_Syle - the style of the indicator signal lines.
- past_signals_Back - display of indicator signal lines in the background.
- past_signals_text_Size - font size of closed signals.
- Alert_ID - is a unique name for identifying alerts.
- Send_Notification - notification to the mobile terminal.
- Send_Alert - standard terminal alert.