SL Trend Screener
- 指标
- Chalin Saranga Jayathilake
- 版本: 1.4
- 更新: 24 十二月 2021
- 激活: 5
| if you want more information please pm me |
|---|
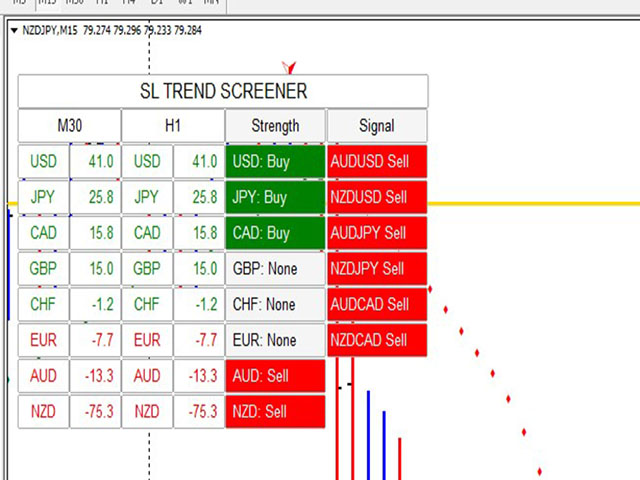
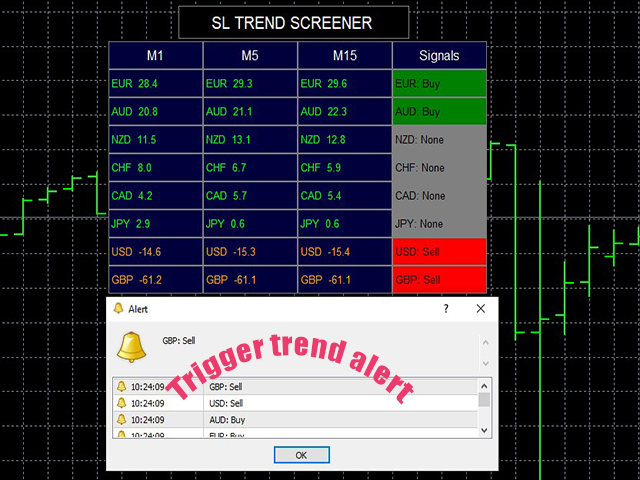
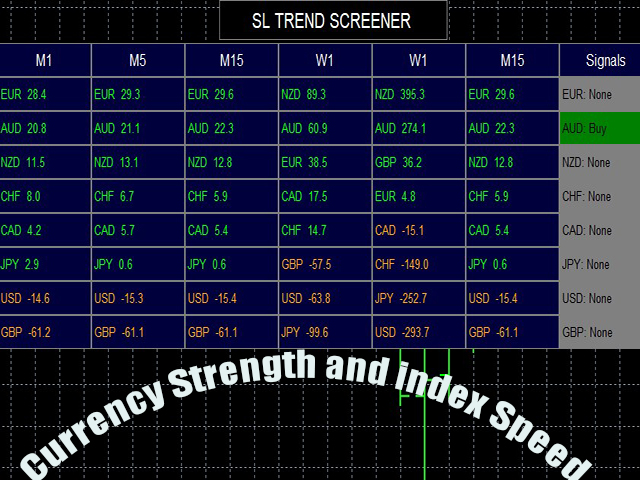
HI guys this my developing indicator 1st version alert logic work well..
this indicator using can you stronger currency and top weaker currency find well,this;s indicator multy
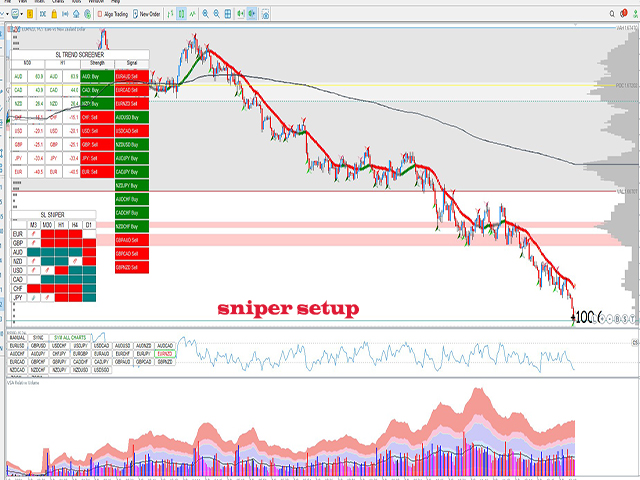
MTF time frame strength work.very good for SL trend screener intraday trader and long time trader, very easily
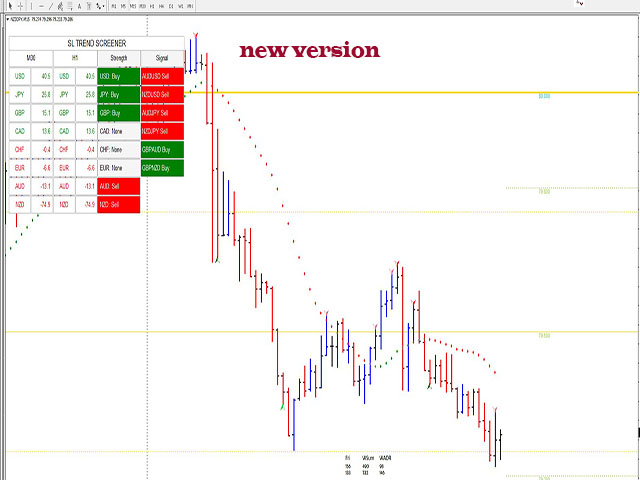
can you watch stronger and weaker index.I hope to more improve this future further,thank you
This is one of the very few effective and working indicators of the strength of currencies on mql5: compact, clear and easy to read. Excellent technical support and responsiveness from the author! Many thanks to the author and continued search for new ideas and implementations!