Stochatic Pivot
- 指标
- David Gitau Gakunga
- 版本: 1.0
- 激活: 5
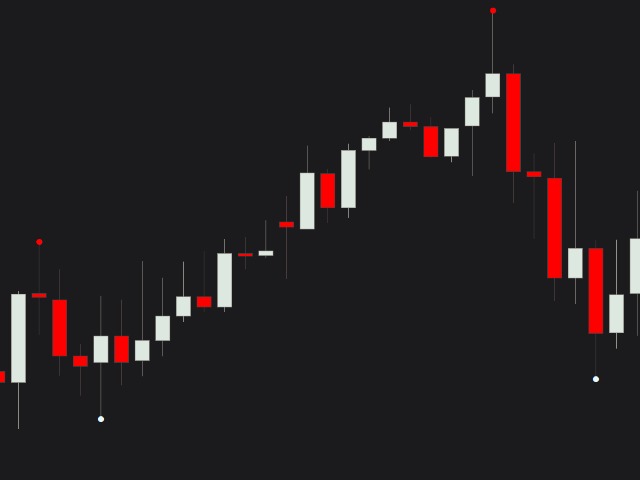
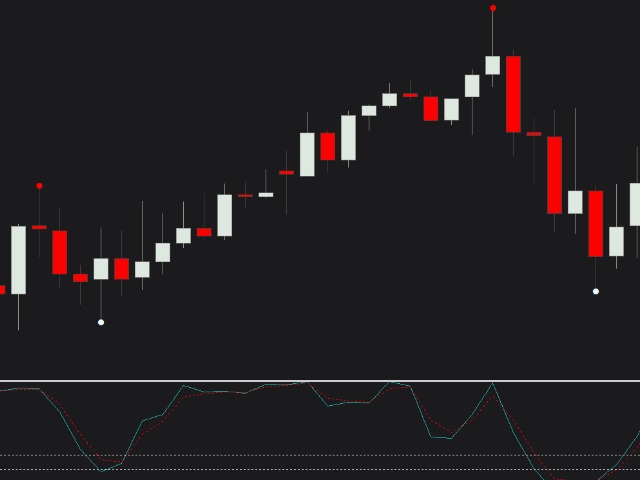
Stochastic Pivot draws a point on the chart at Stochastic overbought or oversold.
During overbought periods, this indicator will draw the pivot point at the high of the highest candle and at the low of the lowest candle during oversold periods.
NB : All pivots are updated 'on tick' and 'on any chart event' immediately
Settings
| Name | Description |
|---|---|
| Upper Limit | Set Stochastic Overbought Level |
| Lower Limit | Set Stochastic Oversold Level |
| %KPeriod | Set Stochastic K Period |
| %DPeriod | Set Stochastic D Period |
| Slowing | Set Stochastic Slowing |
| Method | Set moving average method( Simple, Exponential, Smoothed and Linear Weighted ) |
| Price | Set Stochastic Price( Low/High, Close/Close) |
//---
For MT4 : Stoch Pivot MT4
//---
Enjoy