Stochastic Scanner
- 指标
- Taofeek Bello
- 版本: 1.30
- 更新: 6 十月 2023
- 激活: 15
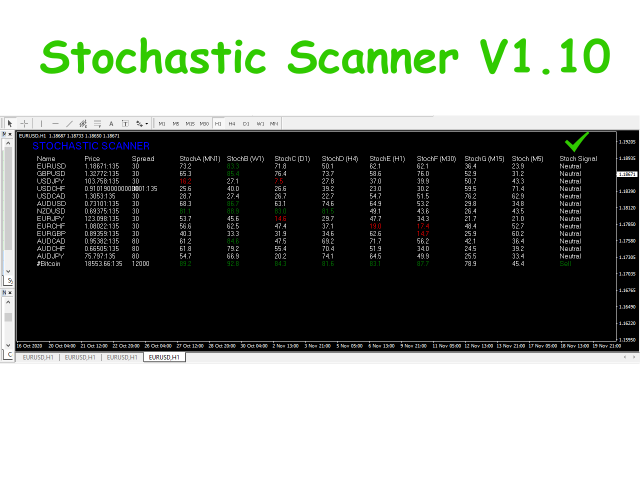
This is an indicator that shows the value of Stochastic of different timeframe on a single chart window. It also shows the average stochastic value of all the values of Stochastic (MN1, W1, 1D, 4H, 1H, 30M, 15M and 5M) shown. It can be used to know the oversold and overbought of any instrument.
who can use it?
All types of traders. Be it-
- Scalper
- Swing traders
- News traders
- Long term traders
Input Parameters
- %K period - Value of %K period of stochastic used;
- %D period - Value of %D period of stochastic used;
- Slowing - Value of Slowing period of stochastic used
- MA Method - Moving Average value method used in Stochastic calculation
- Price Field - Value of Price Field used in Stochastic calculation
- Stoch Upper Level - Upper level of value of stochastic for its colour to change to GREEN
- Stoch Lower Level - Lower level of value of stochastic for its colour to change to RED
Installation of the Indicator
1. Drag and drop the Indicator into all charts of pairs to trade and click okay.
2. After clicking okay, the indicator will be loaded or shown on the chart. It refreshes after 2secs
How to use it
Order Input
Open Buy order when Average Stoch Value turn RED or is at or below 20 and (i.e Oversold)
Buy Sell order when Average Stoch Value turn GREEN or is at or above 80 (i.e Overbought)
Order Exit
Open order can be exit when the colour of Average Stoch Value changes to WHITE