RaptorT Cumulative and Cumulative Volume Delta
- 指标
- Federico Bari
- 版本: 1.1
- 更新: 12 十一月 2020
- 激活: 5
RaptorT: Cumulative Volume and Cumulative Volume Delta (Buying Selling Pressure)
Introduction
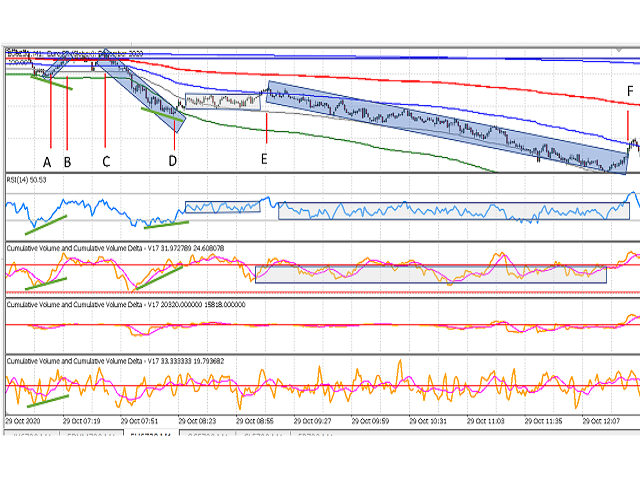
RaptorT CV & CVD (CVD is also known as Buying/selling Pressure or Book Pressure) offers two basic and meaningful indicators for trading having volumes as main index and weigh of the market interest. It gives good insights in combination with VWAP line and its four upper and lower standard deviations, developing PVP (Peak Volume Price, the equivalent of the POC for the old Market Profile), Volume Profile and Volume Profile Delta as well as standard RSI and MACD for divergences identification, oversold/oversell areas and other analysis. RaptorT CV & CVD are calculated from each single tick of the set period of time.
WARNING: since RaptorT CV & CVD uses rough data and the calculation is based on the detection and bufferization of each single tick and the related data, the user BEFORE downloading and install the indicator shall ensure under its responsibility that the broker and data feeder on which he/she is connected provides ticks data, direction (ask/bid) of the tick and volumes of the tick. In case real volumes are not available the indicator can work with volumes calculated on ticks counting as typical drawback. Besides, if the user desires to display the indicator on a past time range with respect the moment on which he started the MT5 application, for instance the past 24 hours, he/she must ensure that the broker and data feeder allow at downloading full past ticks data set.
RaptorT CV & CVD indicator characteristics
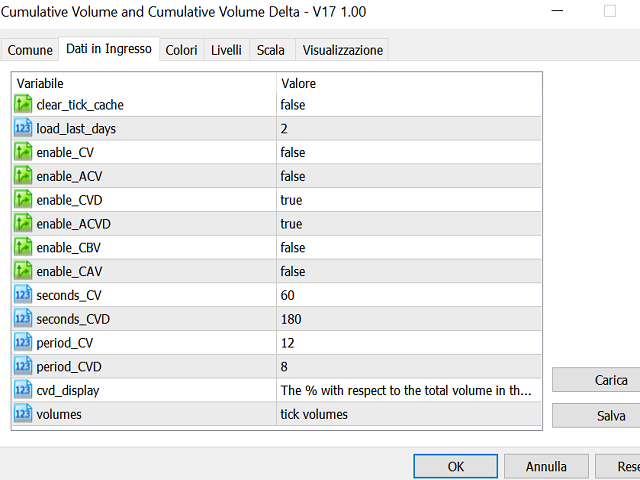
· Cumulative Volume: the line is composed by dots representing the sum of the exchanged real or tick volumes in the last N seconds, where N is a parameter that the user can freely set. The mobile sum is useful to reduce local variations on the time dimension and to show the increasing and decreasing trend of exchanged volumes. The CV indicator allows also to show the average over M periods, where a period is equal to the candlestick selected timeframe. For instance, on M.1 timeframe, a CV with N=180s and with enabled average line on M=8 will show the sum of exchanged volumes over the last 180s, i.e. 3 candles, and the average of this line calculated over the last 8 line dots equal to the last 8 minutes. CV is always not negative; the lowest exchanged volume is 0.
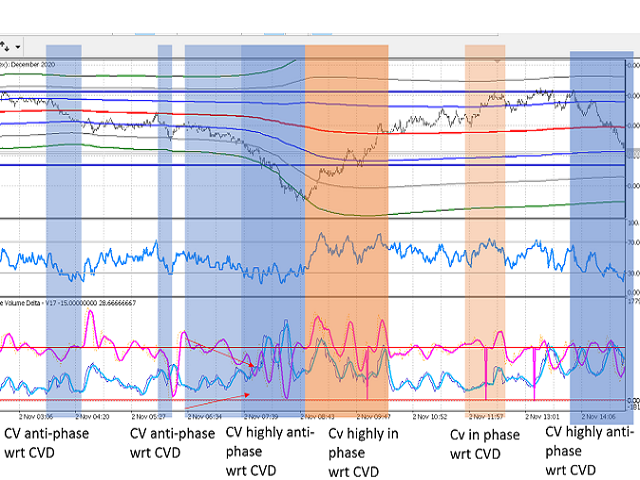
· Cumulative Volume Delta: the line is composed by the difference of ask volumes and bid volumes in the considered period. This indicator has a sign since could be negative or positive. Since the calculation considers the sum of the last N seconds, not necessarily equal to the CV one, what matter is the direction of the CVD indicator (increasing or decreasing) rather than its sign (negative or positive). Obviously, a positive sign over an increasing CVD trend is a further confirmation of possible increasing price trend because there are much more sellers in the market than buyers. Unidirectional trades (not buy, not ask, but ask/buy) are helved and summed to ask and bid volumes, so that making the difference they are neglected. The user can enable the average line that is calculated in the same way of the CV indicator. The user can choose three ways of calculation of the CVD indicator
o Actual: simply the difference of ask and bid volumes in the considered period of time.
o Percentage: the difference is divided by the total volume and multiplied by 100. This amplify the CVD trend despite the total exchanged volumes. CVD curves are magnified.
o Actual x Volume: this innovative way of visualization highlights strong trends toward ask or bid direction when they happen in combination with meaningful total traded volumes. If the total traded volume is low, the Actual x Volume line is compressed around the zero. The calculation of the CVD Actual is a bit different, on candlestick time slot and then summed, to overcome false directions that could happen with very high volumes traded.
Important note: the trader uses these indicators over its own full responsibility knowing that the following observations could be not always true. The following observations are intended just to give an incipit for each trader exploration of its own way of CV & CVD usage. The traders are invited to share their experience of usage of this indicator for the knowledge growing of the whole traders community.
