Historical Memory ZigZag MT4
- 指标
- Marat Sultanov
- 版本: 1.0
- 激活: 20
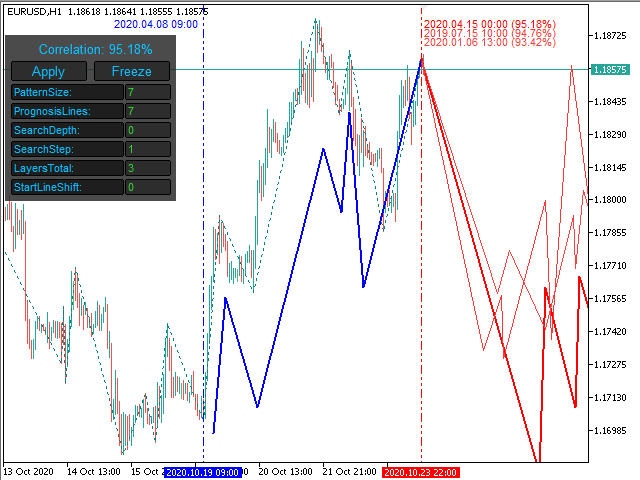
Do you want to see the future lines of the ZigZag indicator?
This indicator will help you do that because the indicator model is based on two indicators: Historical Memory and ZigZag. So it can forecast the ZigZag lines. Very useful as an assistant, acts as a key point to forecast the future price movement.
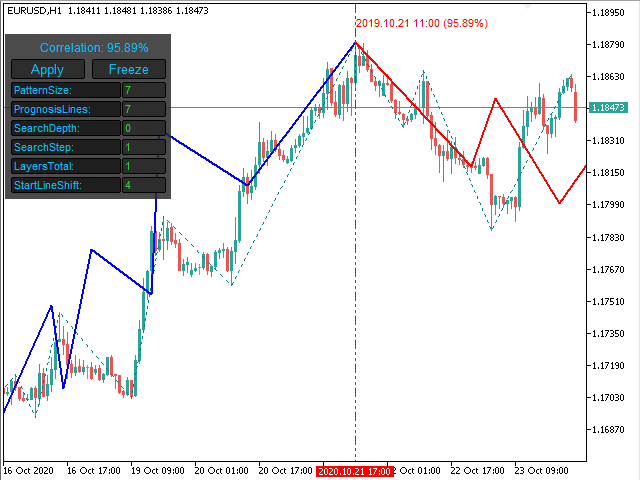
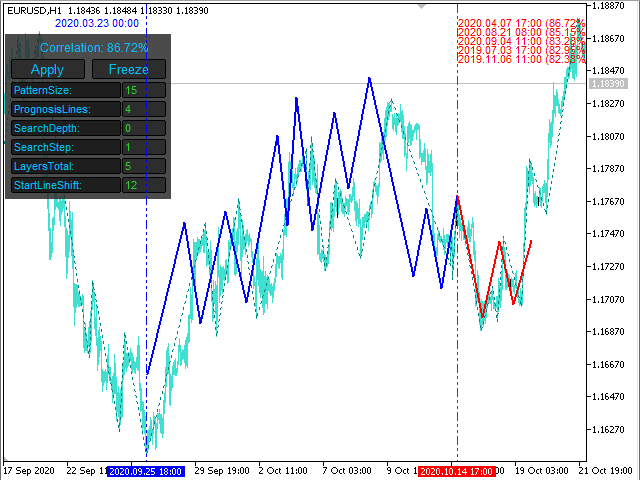
The forecast is made using the method of searching the most similar part in the history (pattern) to the current one. The indicator is drawn as a line that shows the result of change of the ZigZag lines. Moreover, you can visually find and compare the quality of a history pattern with an actual pattern. In addition to all the above, the indicator is able to make a forecast taking into account not a single found pattern, but multiple (in the indicator it is called layers).
It also has a GUI.
Input parameters
The indicator ZigZag
- Depth - number of bars on which the ZigZag node will not be built if the Deviation condition was not met.
- Deviation - deviation (the difference between extremums of bars that is considered sufficient for building a new node).
- Back Step - the minimum number of bars between the maximums (minimums).
Forecast
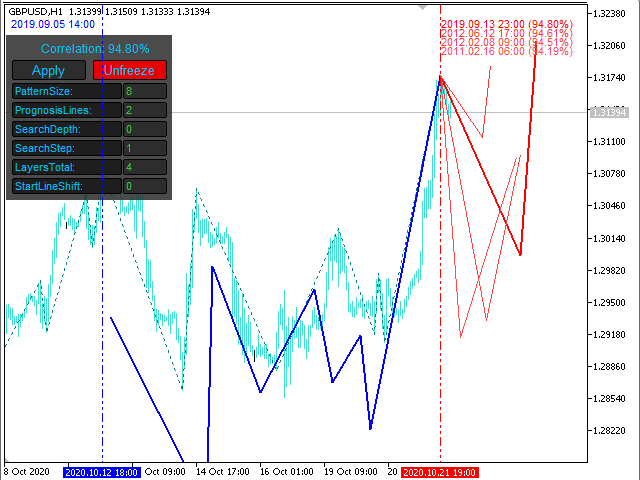
- Prediction Freeze - allows to freeze displayed forecast.
- Layers Show Mode - layer display mode: 'ALL' - all layers will be shown as separate lines; 'AVERAGE' - a multi-layer view as a smoothed line.
- Show All Backward Lines - backward lines of all layers will be displayed.
- Pattern: Size(in ZZ nodes)[1...] - the size of the pattern in ZZ nodes.
- Prediction: the number of ZZ nodes[1...] - the number of ZZ nodes used for the forecast.
- Searching: depth of history(in ZZ nodes)(0 - all ZZ nodes) - the depth of the history used to search for the best correlation.
- Searching: Step(in ZZ nodes) - search step: the higher step value provides a higher speed with a lower search quality.
- Prediction: Layers total [1...20] - the number of layers (no more than 20): the more layers, the greater the variability of the forecast.
- Searching: From ZZ node (in history) - the forecast begins from this node of the ZZ.
Graphics
- Objects Name Prefix - prefix name of the graphic objects.
- Layer 1: color - the line color of the first (main) layer.
- Layer 2: color - the line color of the second layer.