Pattern Trader No Repaint
- 指标
- Elmira Memish
- 版本: 4.0
- 更新: 8 十一月 2020
- 激活: 5
Pattern Trader No Repaint Indicator
MT5 Version of the indicator: https://www.mql5.com/en/market/product/57462
Advanced Chart Patterns Tracker MT4: https://www.mql5.com/en/market/product/68550
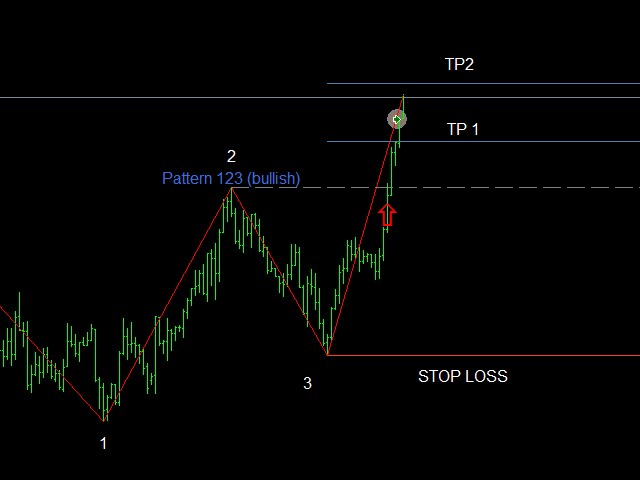
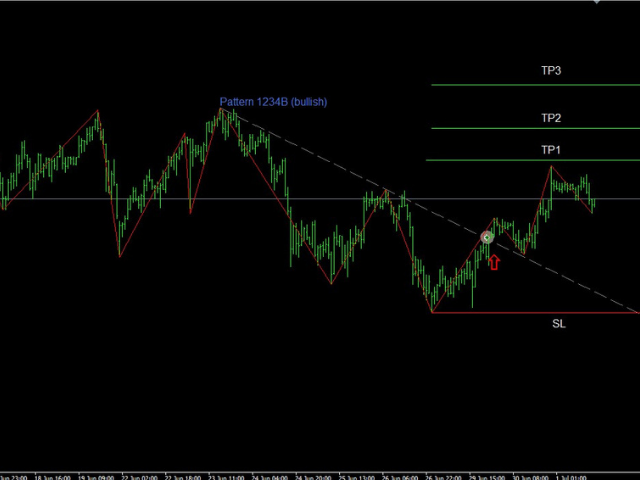
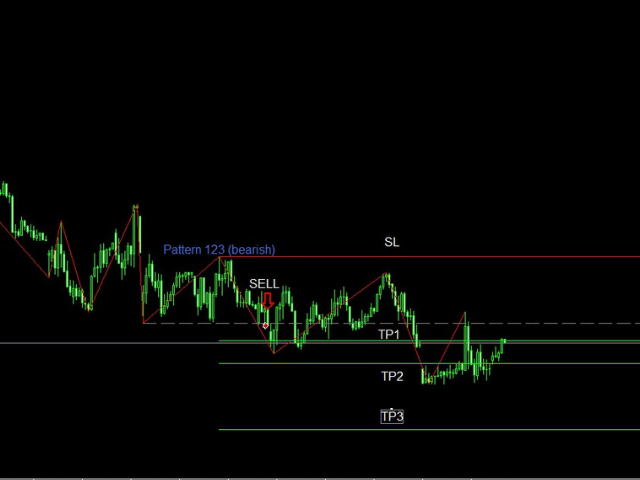
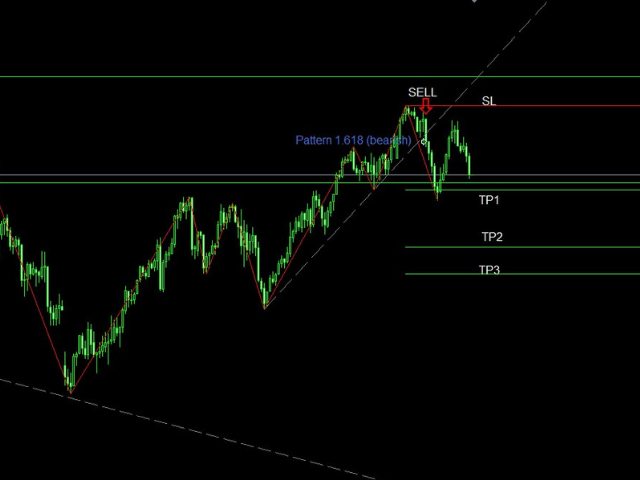
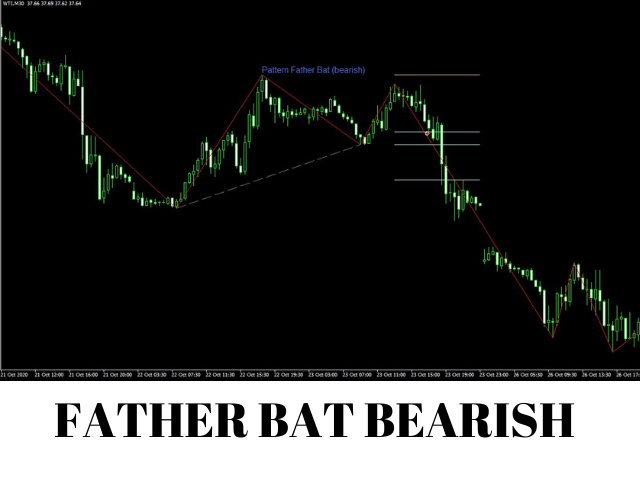
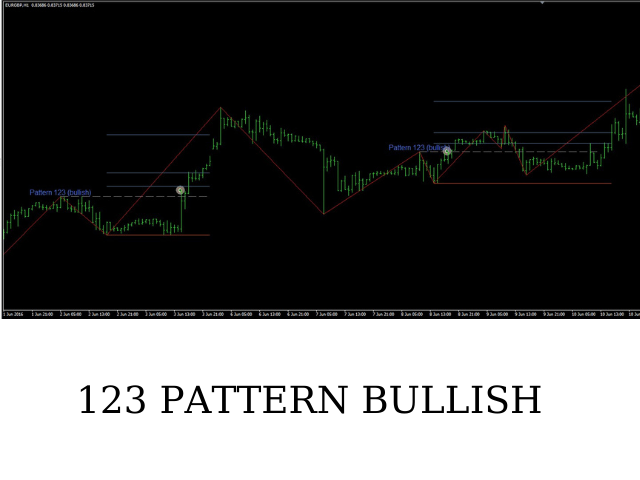
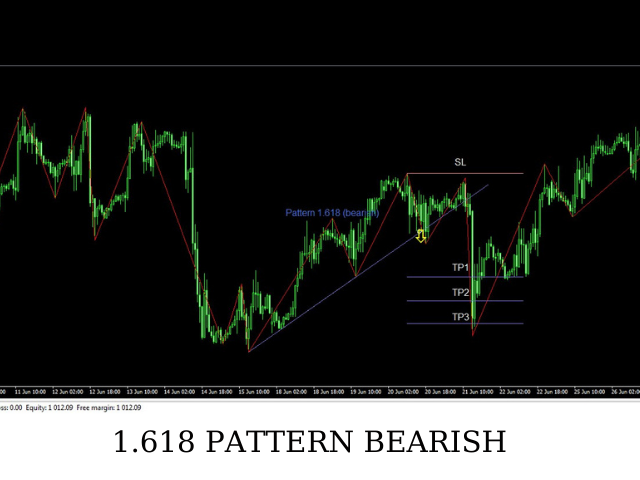
Indicator searches for 123 Pattern, 1234 Pattern, Double Top, Double Bottom Patterns , Head and Shoulders, Inverse Head and Shoulders and ZigZag 1.618 Pattern.
Pattern Trader indicator uses Zig Zag Indicator and Improved Fractals to determine the patterns.
Targets and Stop Loss Levels are defined by Fibonacci calculations.
Those levels must be taken as a recommendation. The trader may use different tools like Moving Avarages, Murrey Math or Support / Resistance to set his/her own levels.
Advantages:
- Pattern Trader draws buy / sell arrows with stop loss and target levels.
- User friendly
- Simple Settings
- High Accuracy
- No Repaint
Inputs of the Indicator:
Zig Zag Settings: 12 5 3 Default ( 12 5 3 and 21 16 8 most recommended)
Candle Close: Arrow to appear at the breakout or wait for the candle closing
Choose Patterns to view by True/False
Alert and Notifiations: True if you would like to receive alerts and notifications
Color Options: Choose the colors for Stop Loss and Target Lines for each pattern.
Keep Patterns: True if you like to see the completed patterns in the history.
You can contat us for your further questions!

用户没有留下任何评级信息