Following
- 指标
- Vladimir Perervenko
- 版本: 1.21
- 更新: 17 十一月 2021
- 激活: 5
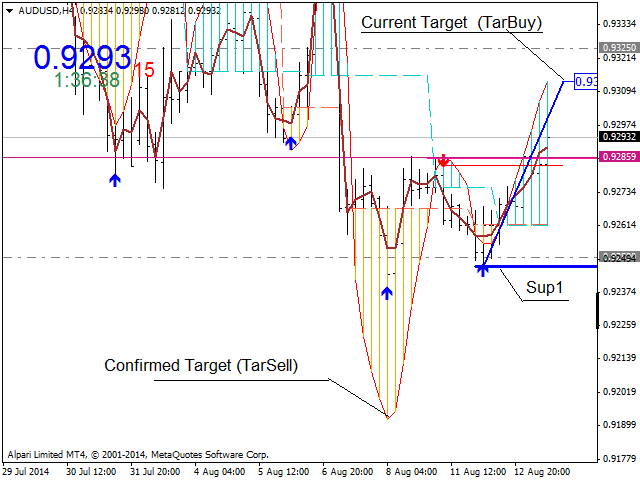
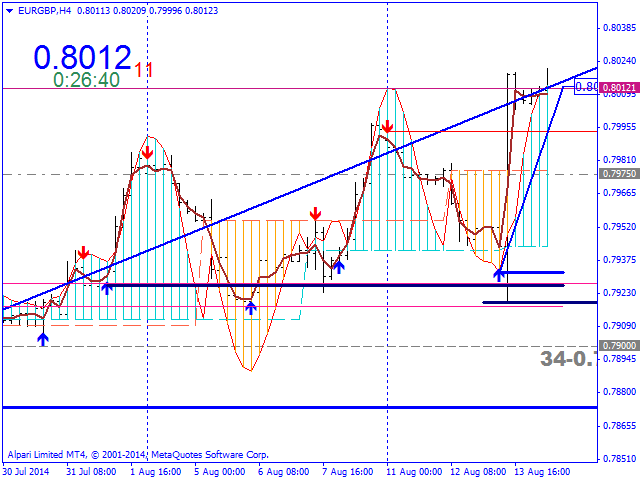
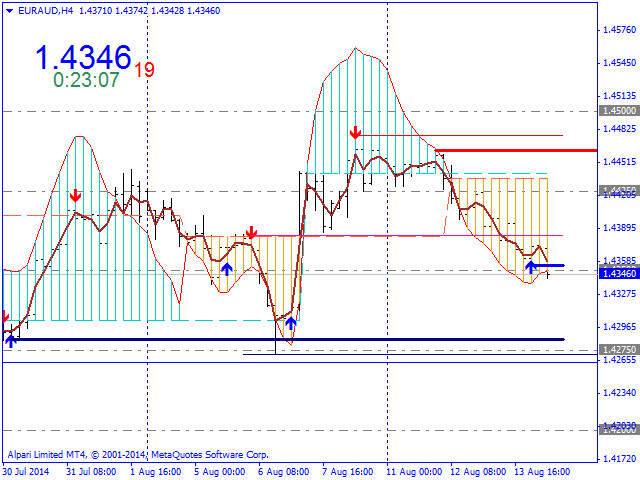
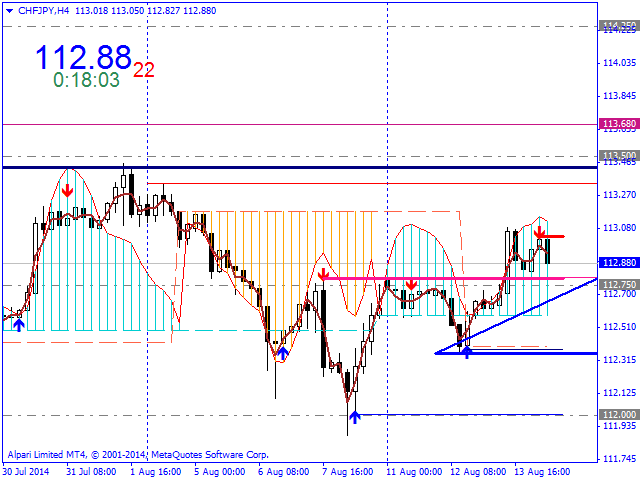
"Follow the Market Desire".
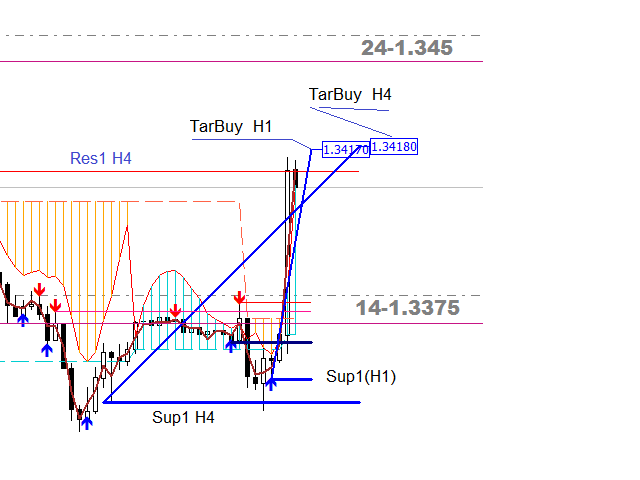
The indicator shows the market "Desire" (force) on the current and the higher timeframe (TF), indicates the current and confirmed targets, identifies and shows the resistance (Res) and support (Sup) lines of the current and/or older TF.
Not always the Desire on a TF coincides with the possibility (real price movement), but the confirmed target is always achieved in the following "lives". Not always neighboring TFs have identical Desires. Every TF lives its own life, and very often its Desire is opposite to that of the neighboring TFs.
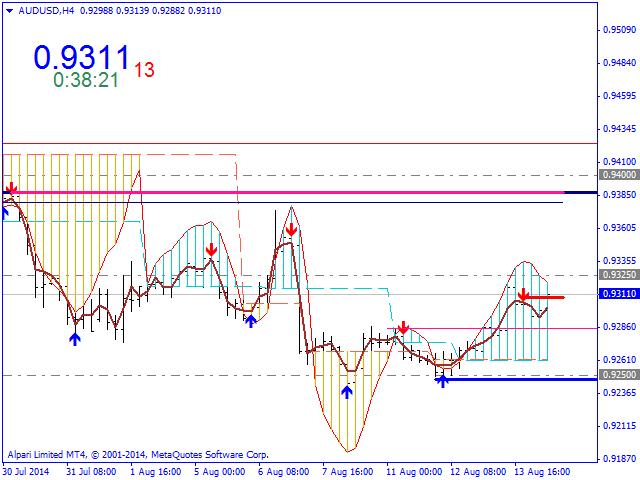
The Desire emerges, develops, reaches the limit, indicates the target it was aiming at, and passively extinguishes, then turns into its opposite, or if continues to develop, it expands. During the development of the Desire, three Res and three Sup levels appear. fir each TF, they differ in both numbers and importance. Of all the six levels of a TF the most important ones are the following: Sup1, Res1 (limits) and Sup3 & Res3 (bases).
This indicator was developed as a result of long-term studies to add quantitative characteristics in the wave theory, which can uniquely identify the wave appearance and property of a particular TF.
As a result of long-term (over 10 years) working in the real market, the indicator has confirmed its reliability, revealed a number of patterns and exceptions, has acquired a large number of extra dimensions, and at the same time showed a high complexity and importance of the relationship of all TFs, from the smallest M1 to the highest MN1. These extensions are included in the professional version of the indicator, which will be proposed later.
The most efficient way to use the indicator is to set it in three windows of one instrument with different periods. For example 5, 30, 240 or 15, 60, 240 etc. The zero bar of the current TF is calculated on each new bar of a smaller TF.
Input Parameters
- Bar - the number of rendered bars;
- slow - double the current TF (increase twice), useful for small TFs;
- TF_high - show support and resistance lines of a higher TF. The ends of lines of a higher TF are farther than those of the current one. Not updated in the tester;
- Line - show support and resistance lines of the current TF;
- zz - join the tops of the current TF using lines;
- up, up_up, dn, dn_dn - colors of support and resistance lines (Sup1, Sup3, Res1, Res3).
The color of indicator lines is preset for the "Green On Black" color scheme.
A note on screenshots: unfortunately due to the size of the screenshots it is impossible to show a complete picture of the market state on the current TF.
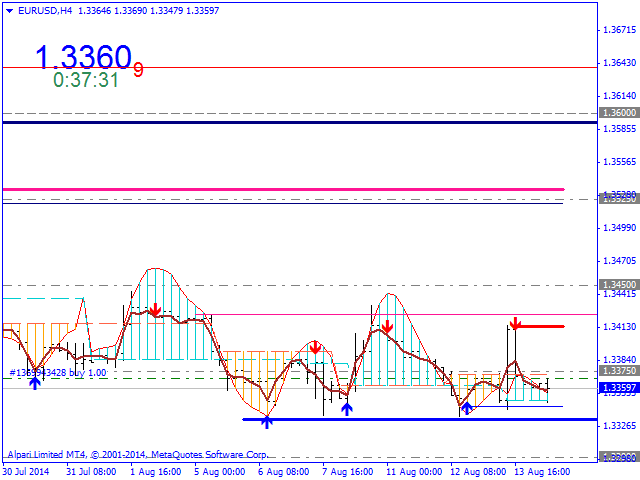
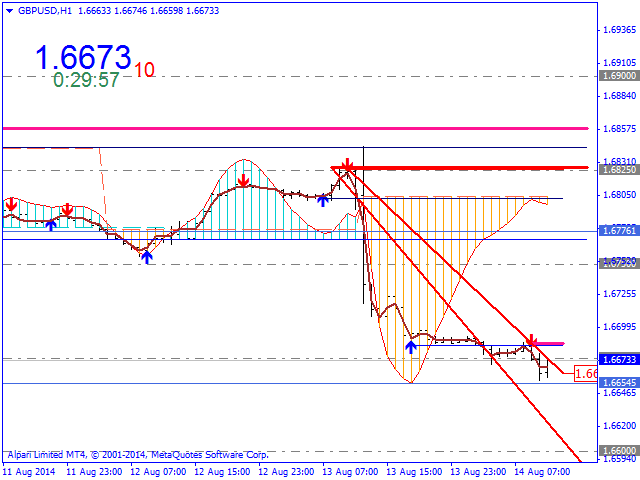
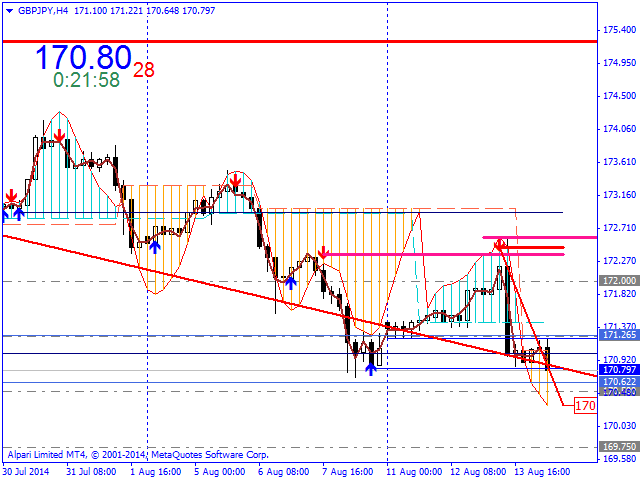
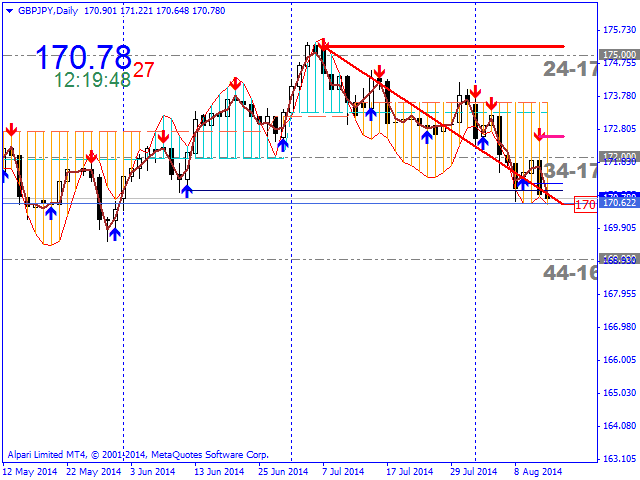
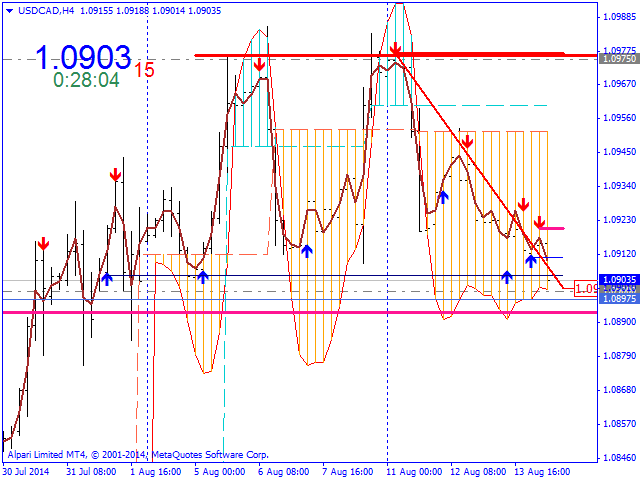

The indicator is very complete