• 概述
  • 评论 (5)
  • 评论 (34)
  • 新特性

WaveTheoryFully automatic calculation

5

本指标是实践实战交易完善的波浪自动分析的指标 ! 

黄金实战 案例...

注:波浪分级用西方叫法不习惯,因受到缠论(缠中说禅)命名方式习惯的影响,我是将基础波浪命名为,将二级波段命名为,同时具有趋势方向的段命名为主趋段(以后笔记中都是这种命名方式,先告知大家),但是算法上和缠论关系不大切勿混淆.反映的是本人分析盘面总结的千变万化纷繁复杂的运行规律.


对波段进行了标准化定义,不再是不同人不同的浪  ,   对人为干扰的画法进行了排除,在严格分析进场起到了关键的作用 .


使用这个指标,等于将交易界面提升美感,抛弃最原始的K线交易带你进入新的交易层次.如果不是为了交易,在宣传上也将使客户观感提升层次.

指标内容:

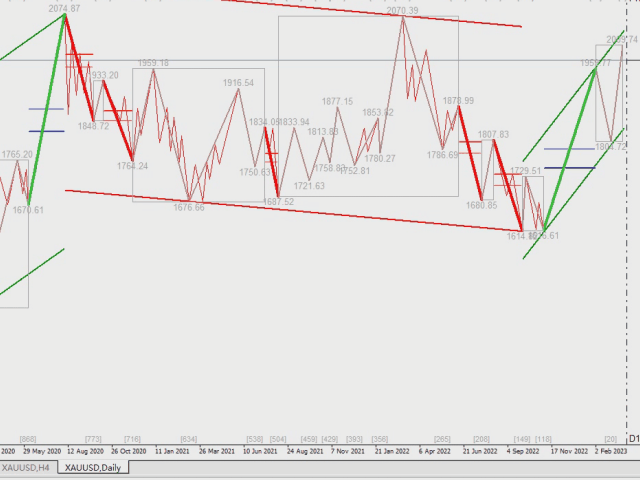
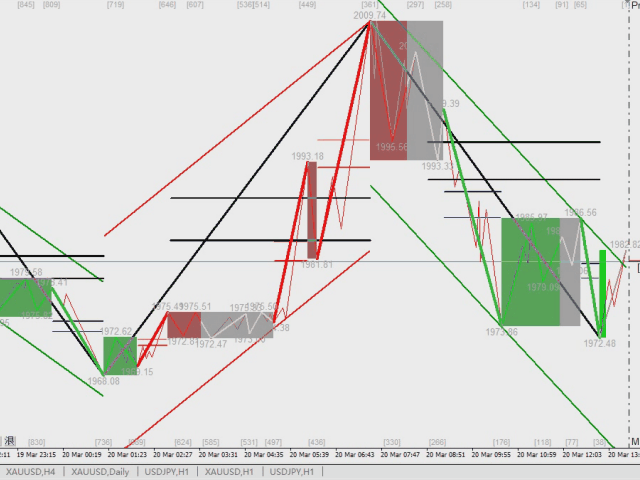
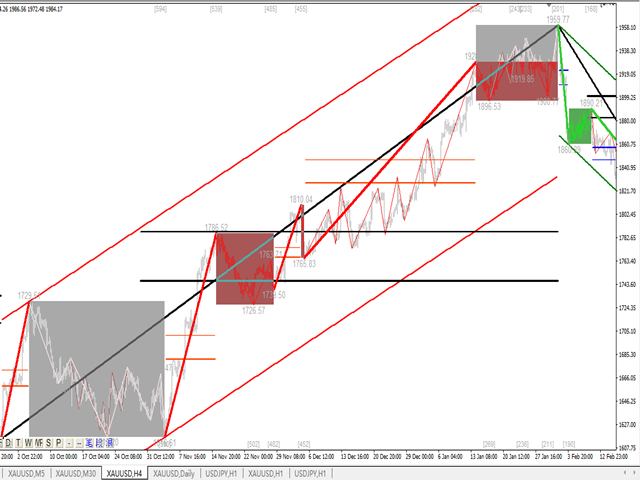
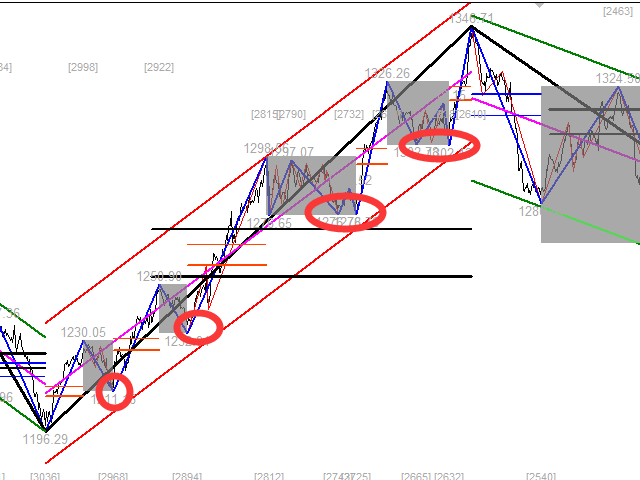
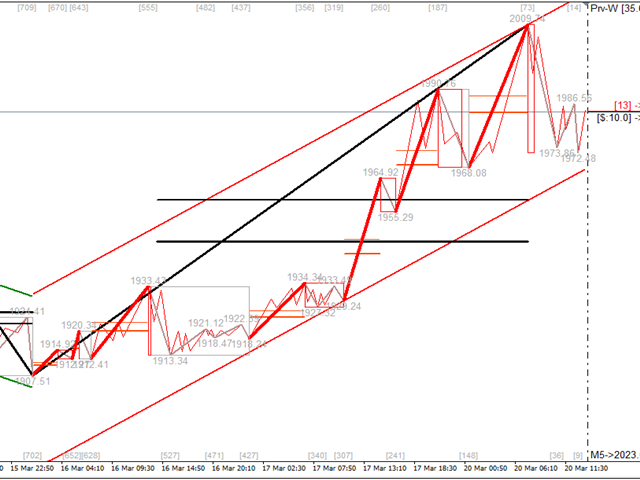
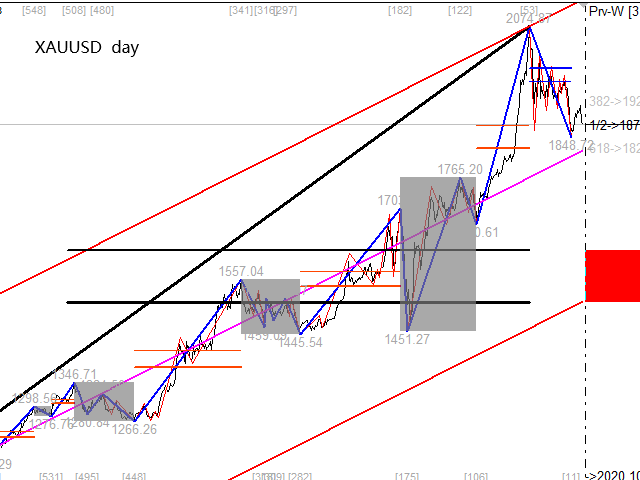
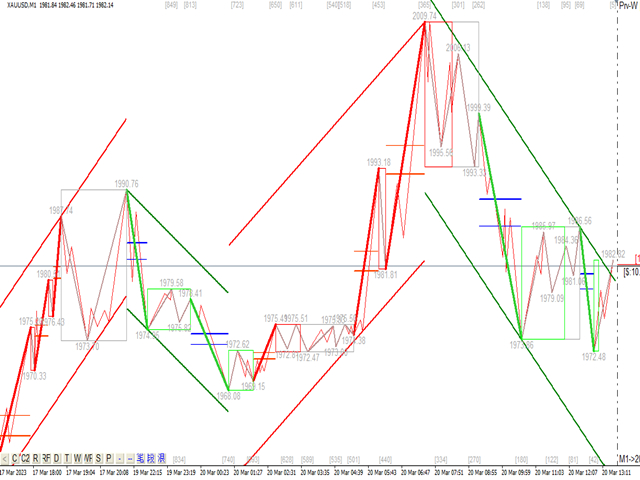
1. 基础波浪(笔):首先我们找出了价格波动过程中的基础波动拐点,当然他的有序性还不算太强,为下一步的计算提供基础.

2. 二级波段():在基础波浪的基础上,通过算法分析得到层级更明显的二级波段,二级波段为波浪提供了分析基础
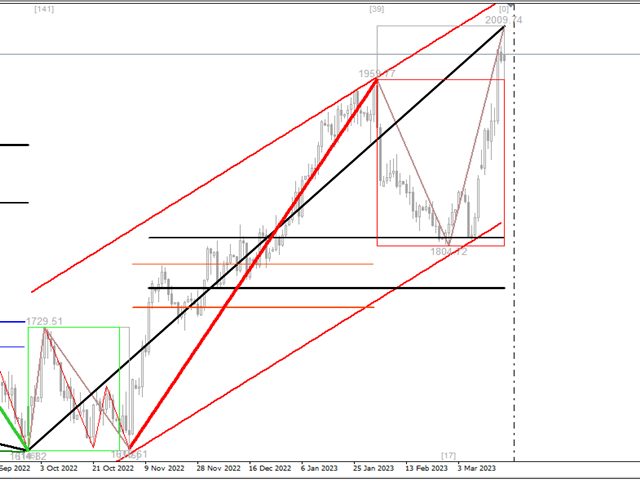
3. 波浪():有着更清晰的趋势,更清晰直观的方向.分析一个波浪是否延续,需要看二级波段的形态,分析二级的构成,可以得出波浪后续的预测.

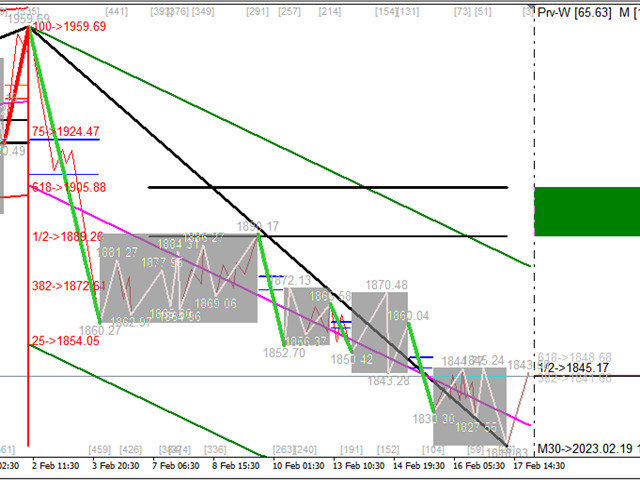
4. 通道:通道计算采用了线性回归的方式进行计算.

5. 回撤:波浪中的两个重要回撤会在每个波段终显示,实战所得这几个重要回撤的和实际回撤的相对强弱决定了趋势的动能

6. 震荡区间:指标中标注了震荡区间


指标实战:

1.实战理论来源基本的波浪理论,道式理论.

2.实战理论更来源于实践实战,阅图千遍总有所得.

3.本来想写点实战心得,但是写到这里发现,操作方案在不同品种不同强弱都略有调整,交易是不断被书写更新篇章,交易就如同埋在沙中的线就算抓住了绳子但是沙子不断改变着自己的形态.

4.在用量化定义了波浪,交易会变得简单有效,趋势会变得非常明朗,心中有大势,一切都变得简单有效.

5.不管是左侧交易,还是右侧交易,不管是做趋势交易,还是做震荡交易,这套指标都有它的答案.大家需要感受趋势和震荡的节奏,级别,势态位,时间点都是及其重要的.

6.理解波浪,交易波浪,一定要多级别多周期分析.


实战心得:

1.波浪理论,道式理论虽然成书,但是他们并不是完全符合自然波动规律而作的图,在实际交易分析过程中会发现很多种难以处理的情况.

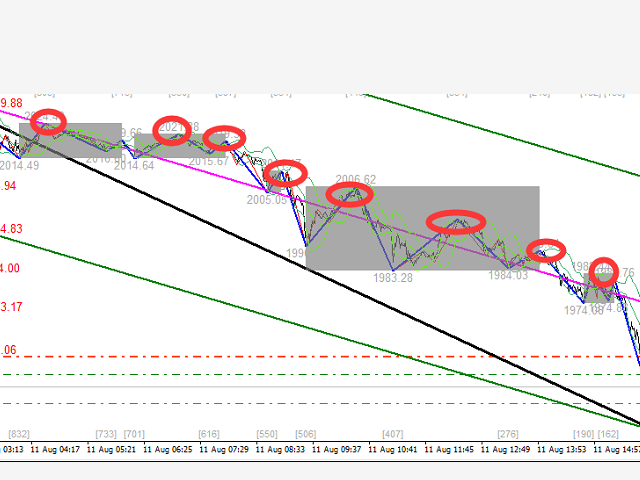
2.下面我们可以把行情分为两种,有序可分析行情 和无序状态的行情.

3.有序可分析行情中有趋势和震荡,这段行情是可以被我们分析的,也就是可作图部分,也是可交易部分,这部分有序性一旦起来会延续有序的特征,于是我们可以在其中获取足够的利润

4.无序行情,波动会显得无序性,区别于震荡,无序行情无法参与.在有序中捡钱,在无序中规避.


希望遇见有缘人,一起分享交易的喜悦,一起成长!

使用下来比较适用于黄金,原油,镑日,比特币等趋势性强品种.

by kjoin.

评论 5
Qilin
30
Qilin 2021.05.18 14:01 
 

Reviewing this at the moment. The indicator looks pretty cool and the developer is really helpful.

연나라
750
연나라 2021.04.15 14:46 
 

I rented this indicator for a month and then bought it today because I liked it so much. There was an mq5 error, but the programmer was really friendly. He did his best to solve the problem. His response is also very quick. I am getting a lot of help from this indicator. Best!

cnbluse
47
cnbluse 2020.12.21 05:28 
 

妈妈再也不担心我犯低级错误了。

推荐产品
Introduction to Fractal Pattern Scanner Fractal Indicator refers to the technical indicator that makes use of the fractal geometry found in the financial market. Fractal Pattern Scanner is the advanced Fractal Indicator that brings the latest trading technology after the extensive research and development work in the fractal geometry in the financial market. The most important feature in Fractal Pattern Scanner is the ability to measure the turning point probability as well as the trend probabi
Dear traders I am happy to introduce to you my new tool called "Brilliant Oscillator" Indicator. This is one of the indicators that can be used as a stand alone indicator. WHAT I LIKE ABOUT THIS TOOL IS Fast and reliable signals Purpose The purpose of this tool is to assist both newbie and Advanced traders to analyze the market with high level of accuracy in both bearish and bullish market trends. The inputs In the input section you will be able to change colors of the indicator only. Currency p
Yihaa Shoot
Indra Lukmana
Yihaa Shoot applies a unique range calculation and time management to enter a trade. It has a unique money management system which calculates the risk before it takes a trade. Suggested pairs: GBPJPY and USDJPY Timeframe: H1 Suggested balance: $500 ($1000 is recomended) Risk in dollar suggested: 4 (0.5% from $1000) Parameters Signal Settings Margin Top (pip) >> margin top from range Margin Bottom (pip) >> margin bottom from range TP Buy deduct (pip) >> reduce the TP spot TP Sell deduct (pip)
The Trend Professor is a moving average based indicator designed for the purpose of helping the community of traders to analyse the price trend. The indicator will be displayed in the main chart as it is indicated on the screenshot section. How it works The indicator has lines of moving averages and colored histograms to depict the direction of the trend. There will be a fast signal line colored blue/yellow/red at some points. The red/yellow colored lines stands for bearish trend/signal while th
HF SuperZig
Wong Sze Wai
5 (2)
This SuperZig indicator is special design for some trader trade with  ZigZag  and  Fibonacci . ( !!! NEW !!! +++ Support and Resistance +++ ) It will draw least two Fibonacci automatically in your chart period. Alerts when Created/Touced the Support/Resistance Box, it will send phone push/email notification to you at the same time. ZigZag + Fibo + BreakOutLine + SupportResistance = SuperZig !!! Input Parameter: " Show ZigZag " ::  Show ZigZag indicator with your own style ; " Show BreakOut
-   Real price is 70$   - 50% Discount ( It is 35$ now ) Contact me for instruction, any questions! Introduction A flag can be used as an entry pattern for the continuation of an established trend. The formation usually occurs after a strong trending move. The pattern usually forms at the midpoint of a full swing and shows the start of moving. Bullish flags can form after an uptrend, bearish flags can form after a downtrend. Flag Pattern Scanner Indicator It is usually difficult for a trade
Prosecution
Andriy Sydoruk
Prosecution is a Forex arrow indicator that tracks the market trend, ignoring sharp market fluctuations and noise around the average price. The indicator is created on the basis of a special algorithm, and based on the developed algorithm, signals are created that allow you to track the trend and see its beginning and end, especially when several timeframes are combined to refine the signal. The arrows show the direction of the deal, and are colored accordingly, which can be seen in the screensh
Market Chopper Indicator - is the manual system for market scalping. Indicator uses most accurate points to enter, when current trend has lost it's power and new one starts. Indicator shows : Enter points(buy/sell arrows), Exit points(Stoploss/Takeprofit arrows). Indicator makes market analysis and adapts to any market, any timeframe showing most relevant strategy for exact conditions. Main Indicator's Features Signals are NOT repaint, late or disappear; Every signal comes at the open of new bar
XRX Master
Mati Maello
This indicator XRX Master indicator.Indicator displays trend movement. Indicator helps to buy and sell. Features FiltPer- displays indicator period. deviation - displaus indicator deviation. deviation2 - displaus indicator deviation 2. HL_period - displaus indicator Highest and Lowest period. HL_period2 - displaus indicator Highest 2 and Lowest 2 period. How to understand the status: If the trend color arrow is green, trend is up. I f the trend color arrow is red, trend is down. //////
This is based on Demark's TD Sequential and TD Combo set of indicators. It mostly has the TD Sequential features. It contains the Arrows Indicator showing Buy/Sell signals and the scanner dashboard. Both are for MT4 (Metatrader 4) Platform. Feature List: - Set TD Setup (9), Countdown (13) bars and In Between bars (4) - Set Countdown Risk Level Bars Below features are optional: - Merge TD Setup and Countdown for TD Combo - Check Setup Intersection - Price Flip before Starting Setup count -
Introduction This indicator detects volume spread patterns for buy and sell opportunity. The patterns include demand and supply patterns. You might use each pattern for trading. However, these patterns are best used to detect the demand zone (=accumulation area) and supply zone (=distribution area). Demand pattern indicates generally potential buying opportunity. Supply pattern indicates generally potential selling opportunity. These are the underlying patterns rather than direct price action. T
ABCD Harmonic Patterns
Mehmet Ozhan Hastaoglu
Thanks to this indicator, you can easily see the new ABCD harmonic patterns in the chart. If the two price action lengths are equal, the system will give you a signal when it reaches the specified level. You can set the limits as you wish. For example, You can get the signal of the price, which occurs in the Fibonaci 38.2 and 88.6 retracements, and then moves for the same length, at the level you specify. For example, it will alarm you when the price reaches 80% as a percentage. In vertic
Gann 方块指标是一种强大的市场分析工具,基于 W.D. Gann 在其“市场预测数学公式”一文中介绍的数学概念。该指标融合了与平方数(如 144、90 和 52)有关的 Gann 技术,以及平方 9。此外,它还融入了  关于如何将平方 9 与通道和星形图案结合使用的方法。 用户手册和使用方式: 在使用该指标之前,我们建议您阅读用户手册,并与我们联系以获得任何澄清。您可以在我们的网站上找到完整的用户手册。 该指标提供了 MT5 的完整版本供购买,也提供了 MT4 的免费版本供测试。提供了两个版本的链接供您方便使用。 主要特点和功能: Gann 方块指标为您的交易环境提供了全套工具,使您能够基于几何图案和 Gann 的概念做出明智的决策。以下是主要特点: 平方 9 分析: 该指标可以绘制与平方 9 有关的各种元素,包括水平线、星形图案、网格、Gann 扇形等。这在您的图表上提供了 Gann 的几何概念的视觉表示。 Gann 方块: 该指标绘制了 Gann 方块 52、90 和 144,使您能够可视化和分析它们与价格走势的关系。 自由 Gann 星形图案: 该指标使您能够直接在图表上绘制
The Sentiment Ratio indicator gauges current Market Sentiment between -100% and 100%, where lower than -40% is considered Bearish and higher than 40% is Bullish. The channel between the two is considered Neutral. The indicator has been a very useful filter tool for signals within a trading system. Example call function:  int SentimentIndicator(double triggerLevel)//Return sentiment if trigger level is activated {   double sentimentRatio=iCustom(NULL,0,"Sentiment Ratio",0,0,0);   if(sentimentRa
FREE
American Hunters
Mehmet Ozhan Hastaoglu
This indicator guides you like a hunter. Tacheprofit and StopLoss levels. See the difference in the experiment. Works in all periods. Works at all rates. You can win with this system. The crossing of the mean and the re-test were done according to the rule. You can see the transactions by moving backwards on the strategy test screen. The whole system is automatically calculated.
BeST_Gann Swing Oscillator is an MT4 indicator that is based on the corresponding work of Robert Krausz who introduced it in the book “ A.W.D Gann Treasure Discovered ” . The Gann Swing Oscillator is a range-bounding technical indicator that oscillates between +1 and -1 and thus it describes the market swings. Generally when the market is in an upswing, the Gann Swing Oscillator describes it as 2 higher highs with the value of +1 while after an upswing, the downswing is expected. Also the do
Key Round Zones mw
DMITRII GRIDASOV
MT4 外汇指标“关键圆形区域” 指标“关键圆形区域”是交易者考虑支撑/阻力时必备的辅助指标 价格遵循 1000 和 500 圆形水平 - 价格经常从它们反弹 主要 1000 水平周围也有强大的支撑/阻力区域(​​每边 100 点) 此外,1000 和 500 圆形水平适合放置获利(圆形水平前面)和 SL(圆形水平后面) 这些水平特别强,尤其是在价格横盘和市场持平时 ................................................................................................................... // 更多出色的专家顾问和指标可在此处获得: https://www.mql5.com/en/users/def1380/seller 它是仅在此 MQL5 网站上提供的原创产品。
EA Atom
Renat Garaev
5 (2)
EA Atom 是具有獨特交易算法的智能交易系統。 EA 對前一天的高位或低位進行細分 成功且經過驗證的策略已集成到顧問的算法中,使您可以通過技術和計算機分析的所有微妙之處從資產定價中獲利​​。 購買後立即與我聯繫以接收說明,以及訪問私人電報聊天! 這些設置可在鏈接的顧問討論中獲得 推薦交易對 EURUSD, GBPUSD, AUDUSD, USDCAD, NZDUSD, DE40, USTECHCash (100) 時間範圍任何 最低賬戶餘額 1000 $(一對) EA需要良好的經紀條件:展期期間的低點差和滑點,最好的賬戶類型是ECN。可以私信給我諮詢。 EA 必須繼續在 VPS 上運行,並且 VPS 延遲不得超過 150 毫秒。 不要與其他智能交易系統一起運行以避免不必要的錯誤 EA 還具有許多內置的追踪止損和獲利功能。這使您可以根據需要降低風險並根據資金、ADR 移動和傳統的點移動來平倉。
Stable Pulse
Ivan Simonika
The work of the Stable Pulse bot is displayed in the form of several key mmoments, which can be seen in the screenshots. This development is a scalping system. You can download and test the bot for free this way by yourself making sure of its capabilities. The bot can be tested on different currency pairs and different periods. The main thing is to set the tester settings as shown in the screenshot, for correct testing. You need to trade on timeframes M1-M15. Expert Advisor is designed to trade
To get access to MT5 version please click   here . This is the exact conversion from TradingView: QQE MT4 Glaz-modified by JustUncleL This is a light-load processing and non-repaint indicator. All input options are available. This is not a multi time frame indicator. Buffers are available for processing in EAs. You can message in private chat for further changes you need.
PDP indicator is used for: defining price probability distributions. This allows for a detailed representation of the channel and its borders and forecast the probability of a price appearing at each segment of its fluctuations; defining the channel change moment. Operation principles and features PDP analyzes a quote history on lower timeframes and calculates a price probability distribution on higher ones. Forecast algorithms allow the indicator to calculate probability distributions and m
该指标预测价格反转,分析市场的看涨和看跌压力。购买压力是一定天数内所有累积柱的总和乘以交易量。卖压是相同数量条上所有分配的总和乘以交易量。 [ 安装指南 | 更新指南 | 故障排除 | 常见问题 | 所有产品 ] 指标比率使您可以衡量购买压力占总交易量的百分比,该值应在0到100之间波动。它执行两个移动平均值(快和慢),以识别压力趋势的变化并相应地寻找交易。 比率50表示市场均衡 比率超过70表示市场超买 比率低于30意味着市场超卖 红色虚线是当前比率 蓝线是信号线 橙色线是主线 它具有直接的交易含义。 市场超卖时寻找购买机会 市场超买时寻找销售机会 如果信号线高于主线,则压力看涨 如果信号线低于主线,则压力看跌 输入参数 周期:研究计算压力的条数 快速MA:直方图的快速平均周期 慢的MA:直方图的平均周期慢 作者 ArturoLópezPérez,私人投资者和投机者,软件工程师和Point Zero Trading Solutions的创始人。
Please read the comment section for more introduction about indicator. ( i cant put all lines in here their is limit ) Entry conditions       ----------------                                                       Scalping  - Long = Green over Red, Short = Red over Green             Active - Long = Green over Red & Yellow lines                                  Short = Red over Green & Yellow lines                            Moderate - Long = Green over Red, Yellow, & 50 lines                    
The indicator automatically sets trendlines on the really important points directly on the chart. Timeframe, color and style of the lines can be adjusted. Notification of a breakout above or below the line via a smartphone is possible. Input Parameters TimeFrame : Choose timeframe AppliedPrice : Choose close , open, high, low, median, typical or weighted price Formation : Choose swing, Shoulder head shoulder or long term formation Alerts : true = alert is on SendEmail : Send message to email a
PowerXXX
Marco Fornero Monia
PowerXXX measures the power of the current candlestick and displays it in numerical format and colors. The indicator can cover multiple timeframes and can be placed on the main chart or on the charts of the underlying indicators. The number of timeframes is selectable, as well as the color levels according to the power expressed. In the latest version, the power can be expressed as a function of the opening of the candle itself or as a function of the opening of the total candles before. There
Ska ZigZag BuySell
NKATEKO VUKOSI LEROY MASANGO
Ska ZigZag BuySell indicator determines the overbought and oversold regions within a trend. The indicator determines the overbought region by the candlestick high and the oversold region by the candlestick low. This indicator only gives signals with arrow and audible alerts each and every time when a new candlestick appear. To utilize the full strategy i recommend using "Ska ZigZag BuySell" together with "Ska ZigZag Line". The Ska ZigZag Line indicator is available for free. NOTE: Indicator is h
Cloud Power
Andriy Sydoruk
Implementation of indication of trend movement with moments for potential stops in the Cloud Power indicator. The transition to the shadow warns of a possible reversal. The entry of the price inside the shadow speaks of a flat movement. The indicator tracks the market trend with unmatched reliability, ignoring sharp market fluctuations and noise around the average price. Simple, visual and efficient use. The indicator does not redraw and does not lag. It can be easily used as an independent
Adaptive SSA
Jean Francois Le Bas
SSA stands for ' Singular Spectrum Analysis '. It combines elements of classical time series decomposition, statistics, multivariate geometry, dynamical systems and signal processing. SSA decomposes time series into a sum of components (ETs), with each component representing a lower smoothing, using several SVD ( Singular Value Decompositions ). It is a powerful filtering process used in many fields of research (climatology, biomedical, aerospace, etc), where high quality forecasting and smoo
Trend Sim
Ivan Simonika
This is a professional Trend Sim indicator. The intelligent algorithm of the Trend Sim indicator accurately detects the trend, filters out market noise and generates input signals and exit levels. Functions with advanced statistical calculation rules improve the overall performance of this indicator. The indicator displays signals in a simple and accessible form in the form of arrows (when to buy and when to sell). Knowing the entry point of each of the currencies is very important for every
This dynamic indicator allows you to measure retracements of price between any two points in either direction. It displays the price points, percentages and also displays the extension levels. User may Modify and Add addition levels and extensions." User may also Add multiple Fibonacci indicators on the chart and change their colors,   style and sizes. Can be used on any timeframe. This is the only Fibonacci Tool you'll need to measure and trade on Structure. MT5 Version Available as we
该产品的买家也购买
Apollo Pips PLUS SP
Oleg Rodin
5 (2)
请在购买产品之前阅读下面的信息! Apollo Pips PLUS SP 是一款独特的产品!它适合那些想要获得我的新“APOLLO PIPS”指标以及“超级包”奖金以及访问我所有交易指标的人! 通过购买 Apollo Pips PLUS SP 产品,您实际上购买的是全新版本的 Apollo Pips 指标。此版本的指标具有改进的算法和易于使用的参数,使您有机会在任何市场和任何交易风格中使用该指标。 该产品的购买者还可以免费访问我的所有其他指标,作为我的超级奖励!如果您想获得我所有的交易工具,那么该产品非常适合您!:) 但这还不是全部!:) 该产品的所有购买者也有资格免费获得我的新指标!:) 如果我有一个新的交易指标可用,您将能够在我的特权“SUPER PACK”终身奖金计划中完全免费获得它! 购买后请联系我以获得我的交易提示和超级礼包奖金!
Atomic Analyst
Issam Kassas
5 (2)
首先值得强调的是,该交易指标是非重绘、非延迟的指标,这使其成为手动和机器人交易的理想选择。 用户手册:设置、输入和策略。 Atomic Analyst是一种PA价格行动指标,利用价格的力量和动量来寻找市场上更好的机会。配备了高级过滤器,可帮助去除噪音和假信号,并提高交易潜力。使用多层复杂的指标,Atomic Analyst扫描图表,并将复杂的数学计算转化为任何初学者都能理解并用来做出一致交易决策的简单信号和颜色。 “Atomic Analyst”是专为新手和经验丰富的交易者量身定制的综合交易解决方案。它将高级指标和一流功能融合为一体的交易策略,使其成为所有类型交易者的多功能选择。 日内交易和剥头皮策略:专为快速准确的日内交易和短期交易而设计。 日内和摆动交易策略:可用作追求价格大幅波动的日内和摆动交易者的可靠工具。 多货币和市场:凭借其可靠的精度,在不同的工具和市场上运作。 多个时间框架:可在多个时间框架上使用,性能良好。 稳定性:所有指标均不重绘、不重绘和不滞后,确保可靠的信号。 信号清晰度:提供箭头信号,用于清晰的入场和出场点。 实时警报:通过交易入场、SL和TP警报通知交
目前八折优惠! 对任何新手或专家交易者来说都是最好的解决方案! 这个仪表板软件适用于28种货币对。它基于我们的两个主要指标(高级货币强度28和高级货币冲动)。它对整个外汇市场提供了一个伟大的概述。它显示高级货币强度值,货币运动速度和28个外汇对在所有(9)时间段的信号。想象一下,当你可以使用图表上的单一指标观察整个市场,以确定趋势和或剥头皮的机会时,你的交易将得到改善 我们已经在这个指标中建立了一些功能,使你更容易识别强势和弱势货币,同时识别和确认潜在的交易。该指标以图形方式显示货币的强势或弱势是增加还是减少,以及它在所有时间段的表现。 增加的新功能是动态市场斐波那契水平,它适应当前的市场条件变化,这是一个已经在我们的高级货币强度28和高级货币冲动指标中使用的成熟的加分项。 在交易时,总是将弱势货币和强势货币配对,这个新指标将帮助你做到这一点。 用户手册:点击这里  https://www.mql5.com/en/blogs/post/708783 特点  显示每个时间段的ACS28和GAP-speed(冲动)的货币强度值。 列:颜色代码以7种颜色
Gold Channel XAUUSD
Paulo Rocha
5 (2)
Gold Channel is a volatility-based indicator, developed with a specific timing algorithm for the XAUUSD pair, which consists of finding possible corrections in the market. This indicator shows two outer lines, an inner line (retracement line) and an arrow sign, where the theory of the channel is to help identify overbought and oversold conditions in the market. The market price will generally fall between the boundaries of the channel. If prices touch or move outside the channel it is a tra
NAM Order Blocks
NAM TECH GROUP, CORP.
5 (1)
MT4多時限訂單塊檢測指示器。 特徵 -在圖表控制面板上完全可自定義,提供完整的交互。 -隨時隨地隱藏和顯示控制面板。 -在多個時間範圍內檢測OB。 -選擇要顯示的OB數量。 -不同的OB用戶界面。 -OB上的不同過濾器。 -OB接近警報。 -ADR高低線。 -通知服務(屏幕警報|推送通知)。 概括 訂單塊是一種市場行為,它指示從金融機構和銀行收取訂單。著名的金融機構和中央銀行帶動了外匯市場。因此,交易者必須知道他們在市場上正在做什麼。當市場建立訂單塊時,它會像發生大多數投資決策的範圍一樣移動。 訂單建立完成後,市場將朝著上升和縮小的方向發展。訂單大宗交易策略的關鍵術語是它包括機構交易者正在做的事情。由於它們是主要的價格驅動因素,因此包括機構交易在內的任何策略都可以。 您將在任何時間範圍內實時看到訂單塊,使用我們的控制面板,您將能夠在所選的歷史記錄週期內檢測常規,拒收和未大寫的訂單塊。 現在您可以接收到訂單塊接近警報,我們在MT4上顯示屏幕通知,並將通知推送到您的手機!
PZ Trend Trading
PZ TRADING SLU
4.8 (5)
许多盈利交易者不仅知道如何识别市场趋势,而且也能把握趋势建立后的交易机会。 Pz 趋势交易 指标设计用来在趋势行情中尽可能的赚取利润。 已建立的趋势提供了一揽子交易机会,但大多数趋势交易指标完全忽视了它们,让交易者在趋势行情时完全不知道该如何做!一般趋势指标只通知有关的趋势变化,但根本不足以得到卓越的回报. Pz 趋势交易 指标比一般趋势指标显示多达 20 倍的交易 , 因为它注重所谓的市场时机。它不仅显示当前的市场趋势,也有回调,内柱线的突破和调整。它令您在趋势回调之后介入,安全的柱线内突破金字塔加仓,以及发现潜在的反转,和已知的调整。 趋势改变 一个趋势改变在市场方向变化时发生。趋势变化在图表上用带数字的彩色圆圈显示。蓝色 (1) 信号为上涨开始, 而红色 (1) 信号为下跌开始。趋势变化并非评估当前价格动作的结果, 它意味着交易设置是不定时地。如果您正确使用本指标, 在趋势变化时, 您将将已经入场 (参看下面的调整)。 回调 但凡趋势在运动中,行情上下抖动,盈利者收割利润,且其它参与者入场。趋势回调代表好的买入机会,通常是由主力获利离场导致。如果行情在回调后回归上行, 指
TPSpro RFI Levels
Roman Podpora
4.8 (20)
Connect Indicator
Sukunthakan Ngernbamrung
Connect Indicator is a tool used for connecting indicators between the MQL market and MT4. The connected indicators are made by our group and can be used for other applications, such as sending messages to the Line application or Telegram application. If you have any questions, please don't hesitate to ask us to receive support. Function and indicator buffer Buffer one is the high price of the previous candle. Buffer two is the high price of the previous candle. Usage To connect indicators to fu
PZ Day Trading
PZ TRADING SLU
3.67 (3)
该指标仅使用价格行为分析和donchian渠道以锯齿形检测价格反转。它是专门为短期交易而设计的,根本不需要重新粉刷或补漆。对于精明的交易者来说,这是一个绝佳的工具,旨在增加他们的运作时间。 [ 安装指南 | 更新指南 | 故障排除 | 常见问题 | 所有产品 ] 极易交易 它在每个时间段都提供价值 实施自我分析统计 它实现了电子邮件/声音/视觉警报 基于可变长度的突破和拥挤区域,该指标仅使用价格行为来选择交易并对市场快速做出反应。 显示过去信号的潜在利润 该指标分析其自身的质量和性能 突围的损失突出显示并解决 该指标是不可重涂和不可重涂的 该指标将帮助盘中交易者不要错过单个价格反转。但是,并非所有价格反转都是一样的,也不是具有相同的可行质量。决定要突破哪些突破而忽略哪些取决于交易者的良好判断。 如何解释统计数据 该指标研究其自身信号的质量,并在图表上绘制相关信息。将分析每笔交易,并在图表的左上角显示总体历史结果,这使您可以针对任何给定的工具和时间范围自行优化指标参数。每个乐器和时间表都有其自己的最佳设置,您可以自己找到它们。 最大优惠交易:对于任何给定的交易,MFE都是
Enigmera
Ivan Stefanov
5 (2)
ENIGMERA:市场核心 https://www.enigmera.com 简介 该指标和交易系统是金融市场的一种非凡方法。ENIGMERA 利用分形周期精确计算支撑位和阻力位。它能显示真实的累积阶段,并给出方向和目标。 该系统无论在趋势中还是在修正中都能发挥作用。 它是如何运行的? ENIGMERA 由三条线组成:支撑/阻力线、目标线和偏离线。与一般市场指标将过去的数据推断为现在和未来的情况不同,该系统能提供当前的完整情况。如果你处于支撑位,这意味着真正的支撑;如果你处于阻力位,这意味着真正的阻力。如果突破某一水平,则表示趋势发生变化。没有重绘。 由于市场在不断变化,ENIGMERA 不断调整其评估工具,定期修改策略。  这保证了每种情况都能得到全面评估。这一市场指标的独特性显而易见,其能力不言而喻。  ENIGMERA 为金融分析师和咨询师提供服务,他们需要可靠的见解与客户分享,也为投资者提供服务,他们需要最精确和最可靠的保证。 该系统能够达到最佳精度,使交易者能够自信、清晰地评估他们的选择。 ENIGMERA 将 20 年的交易专长和知识整合到一个综合软件
Ultimate Sniper Dashboard
Hispraise Chinedum Abraham
4.76 (17)
折扣价为299美元! 未来可能会涨价! 请阅读下面的描述! 终极狙击手仪表盘的最佳进入系统。终极动态水平。(请查看我的产品) 由于MT4多币种测试的限制,终极狙击手仪表盘只适用于实时市场。 介绍Ultimate-Sniper Dashboard! 我们最好的产品包括HA-狙击手、MA-狙击手和许多特殊模式。终极狙击手仪表盘是一个绝对的野兽! 对于任何新手或专家交易者来说,这是最好的解决方案! 永远不要再错过任何一个动作! 对于那些喜欢简单和点数的交易者,我们有一个特别的产品给你。本质上很简单,该仪表板根据多种自定义算法查看28种货币对,完成所有工作。只需一张图表,你就可以像专家一样阅读市场。试想一下,如果你能在任何外汇对开始移动时准确地确定其方向,你的交易会有多大的改善。   我们的系统是为了寻找高概率信号并实时向用户发送警报。没有滞后或错误的信号。 为了保持图表的清洁,你可以在不需要时隐藏Ultimate-Sniper。只需按下箭头按钮即可隐藏仪表板。 Ultimate-Sniper适用于从1分钟到月度的所有时间框架,因此你可以在你选择的任何时间框架上快速
Indicator : RealValueIndicator Description : RealValueIndicator is a powerful tool designed specifically for trading on the EURUSD pair. This indicator analyzes all EUR and USD pairs, calculates their real currency strength values, and displays them as a single realistic value to give you a head start on price. This indicator will tell you moves before they happen if you use it right. RealValueIndicator allows you to get a quick and accurate overview of the EURUSD currency pair tops and bottoms,
Pair Trading Station MT4
Young Ho Seo
3.67 (3)
How to use Pair Trading Station Pair Trading Station is recommended for H1 time frame and you can use it for any currency pairs. To generate buy and sell signal, follow few steps below to apply Pair Trading Station to your MetaTrader terminal. When you load Pair Trading Station on your chart, Pair Trading station will assess available historical data in your MetaTrader platforms for each currency pair. On your chart, the amount of historical data available will be displayed for each currency pai
Cycle Sniper
Elmira Memish
4.38 (32)
NEW YEAR SALE PRICE FOR LIMITED TIME!!! Please contact us after your purchase and we will send you the complimentary indicators to complete the system Cycle Sniper is not a holy grail but when you use it in a system which is explained in the videos, you will feel the difference. If you are not willing to focus on the charts designed with Cycle Sniper and other free tools we provide, we recommend not buying this indicator. We recommend watching the videos about the indiactor and system before pu
Gann Price Level
Kirill Borovskii
The indicator is designed to work on any trading platform. The program is based on proprietary algorithms and W.D.Ganna's mathematics, allowing you to calculate target levels of price movement based on three points with the highest degree of certainty. It is a great tool for stock trading. The indicator has three buttons: NEW - call up a triangle for calculation. DEL - delete the selected triangle. DELS - completely remove all constructions. The probability of achieving the goals is more than 80
AT Forex Indicator MT4
Marzena Maria Szmit
5 (3)
The AT Forex Indicator MT4 is a sophisticated trading tool designed to provide traders with a comprehensive analysis of multiple currency pairs. This   powerful indicator   simplifies the complex nature of the forex market, making it accessible for both novice and experienced traders. AT Forex Indicator uses   advanced algorithms   to detect trends, patterns and is an essential tool for traders aiming to enhance their forex trading performance. With its robust features, ease of use, and reliabl
PZ Mean Reversion MT4
PZ TRADING SLU
2.33 (3)
采用专业和量化方法进行均值回归交易的独特指标。它利用了价格以可预测和可衡量的方式转移并返回均值这一事实,这允许明确的进入和退出规则大大优于非量化交易策略。 [ Installation Guide | Update Guide | Troubleshooting | FAQ | All Products ] 清晰的交易信号 非常容易交易 可定制的颜色和尺寸 实现性能统计 优于大多数交易策略 显示合适的止损和止盈水平 它实现了电子邮件/声音/视觉警报 这个怎么运作 该指标从更高的时间范围测量完全可定制的移动平均线的标准偏差,并使用趋势跟踪方法精确地找到交易。交易是通过深入当前图表的价格行为发现的,并在价格返回到平均价格区间时关闭,根据您选择的更高时间范围计算。由于其编码方式,该指标将远离高波动性和强劲趋势市场,并且仅在可预测的情况下进行交易,在可接受的波动性与方向性比率范围内,回归均值是可行的。 指标剖析 绿线是更高时间范围内的移动平均线(也就是平均值) 虚线区域是移动平均线周围的典型价格区间 蓝线是看涨交易的突破价格 红线是看跌交易的突破价格 交易是针对均值进行的,并在
Introduction to X3 Chart Pattern Scanner X3 Cherart Pattern Scanner is the non-repainting and non-lagging indicator detecting X3 chart patterns including Harmonic pattern, Elliott Wave pattern, X3 patterns, and Japanese Candlestick patterns. Historical patterns match with signal patterns. Hence, you can readily develop the solid trading strategy in your chart. More importantly, this superb pattern scanner can detect the optimal pattern of its kind. In addition, you can switch on and off individu
ECM Elite Channel is a volatility-based indicator, developed with a specific time algorithm, which consists of finding possible corrections in the market. This indicator shows two outer lines, an inner line (retracement line) and an arrow sign, where the channel theory is to help identify overbought and oversold conditions in the market. The market price will generally fall between the boundaries of the channel. If prices touch or move outside the channel, it's a trading opportunity. The
TrendMaestro
Stefano Frisetti
5 (3)
note: this indicator is for METATRADER4, if you want the version for METATRADER5 this is the link:  https://www.mql5.com/it/market/product/108106 TRENDMAESTRO ver 2.4 TRENDMAESTRO recognizes a new TREND in the bud, he never makes mistakes. The certainty of identifying a new TREND is priceless. DESCRIPTION TRENDMAESTRO identifies a new TREND in the bud, this indicator examines the volatility, volumes and momentum to identify the moment in which there is an explosion of one or more of these data a
Gann Greed Don Hall
Kirill Borovskii
This product is based on the methodologies of Gann, his follower Don E. Hall. The Indicator builds a working view grid, which is used to analyze graphics. The Pyrapoint tool, developed by Don Hall, is a grid based on the Pythagorean cube. In his calculations he uses the Gann Square 9 methodology and the relationship between Price and Time. This tool is used to predict changes in trend and overall market actions. More information about the method   HERE
Dragon Multi Indicator MT4
Mansour Babasafary
5 (4)
3 Indicators in 1 indicator Strategy based on price action Made specifically for the best forex currency pairs Can be used in the best time frame of the market at a very reasonable price This indicator is basically 3 different indicatos . But we have combined these 3 indicators in 1 indicator so that you can use 3 indicators at the lowest price. All three strategies are based on price action. But based on different trends. Long term, medium term and short term Attributes : No repaintin
Max Paynex
Abdulkarim Karazon
Max Payne 是一个反转/趋势信号指标,以箭头的形式给出信号,该指标在同一柱收盘时给出信号,该指标可以在图表上以不同周期多次下降,以获得信号的双重/三重确认 该指标具有高度可调性,可以适应任何交易风格,同时它不会重新绘制或背面绘制,购买后您将获得屏幕截图中显示的完整系统以及使用的模板。 ----------------- 如何交易: 等到您在同一柱上获得三次确认,同时趋势过滤器(购买后您将获得的佩恩趋势)与方向一致 开仓并将止损设置为买入交易的黄金箭头(模板)下方和卖出交易的黄金箭头(模板)上方,您的退出信号是第一个相反的白点信号(模板)。 ----------------- 参数 : 信号周期:箭头周期 滤波器:信号滤波器 距离:箭头距蜡烛的距离 计数柱:显示多少历史信号 警报 --------------------------------------
Market Swing Index MSI
Elias Mtwenge
5 (1)
JULY OFFER 80% OFF next price for unlimited version will be 17000$. This is the only time you can get this institutional and professional indicator at this price for unlimited version. Don't dare to miss this. The tool I am about to introduce to you you can't compare it with other tools due to its strategy and accuracy level in predicting the next price directional movement . This tool is designed for serious traders who have decided to make a difference through trading. Be the next person to wi
Swing Master Indicator
Elias Mtwenge
5 (1)
Dear Traders this is my another tool called " Swing Master Indicator ". As the name above the indicator is designed to help you in swing trading by capturing the low and highs of the price. You may us this tool with any trading strategy and style from scalping to position trading. It is made for level of traders including newbies and advanced traders even prop-firms, hedge funds and banks to help them make sold market analysis. I create tools for serious traders who want to make a difference in
Quantum Currency Array Indicator
QUANTUM TRADING SOFTWARE LIMITED
This indicator has been developed to identify and display these trends quickly and easily, allowing you to see instantly, those currency pairs which are trending, and those which are not – and in all timeframes, with just one click. The 28 currency pairs are displayed as a fan as they sweep from strong to weak and back again, and this is why we call it the ‘currency array’. All 28 pairs are arrayed before you, giving an instant visual description of those pairs that are trending strongly, those
The indicator " ZigZag on Trend " is an assistant in determining the direction of price movement, as well as a calculator of bars and points. It consists of a trend indicator, which follows the price direction by the trend line presented in the form of a zigzag and a counter calculating the number of bars traversed in the direction of the trend and the number of points on the vertical scale. (calculations are carried out by the opening of the bar) The indicator does not redraw. For convenience,
ON Trade Optuma Astro
Abdullah Alrai
5 (4)
当然可以!以下是您提供的文本的中文翻译: 引入 MT4 天文指标:您的终极天体交易伙伴 您准备好将交易体验提升到天文高度了吗?不用再寻找,就在我们的革命性 MT4 天文指标中。这个创新工具超越了传统的交易指标,利用复杂的算法提供无与伦比的天文洞察力和精确计算。 指尖上的宇宙信息: 瞻仰一个详尽的面板,展示了一宝藏般的天文数据。了解行星的地理/太阳心坐标,太阳/地球距离,亮度,伸长度,星座,黄道和赤道坐标,甚至是水平坐标——每个细节都经过精心计算并呈现得美轮美奂。指标生成的垂直线对应于时间值,为您的交易旅程提供了宇宙的视角。 行星线条与关系: 在您的图表上欣赏行星线条的魔力,具有可自定义的比例和角度。通过直观的控制面板轻松切换每个行星线条的可见性。通过连结、六分、四分、三分、对冲和逆行等指标,发现行星关系的艺术。在您选择的时间范围内探索这些宇宙构造,使您能够识别重要的交易机会。 揭示甘恩的智慧: 通过受甘恩启发的平方垂直线揭示潜在的反转时机。这种创新修改将甘恩历经考验的原则带入现实,帮助您提前了解市场的转向和趋势。 月亮引导: 在您的图表上优雅地导航月相,因为新月和满月点缀其间。月亮周期
SNR LEVEL INDICATOR Accurate Snr level indicator will only display Fresh Levels that are close to the Current Market Price. This indicator is very accurate in mapping Support & resistance levels. there is an alert feature when the price TOUCHES the SNR LEVEL, WHEN CLOSE CANDLE BREAK/REJECT SNR LEVEL. INDICATOR MARKING : - SUPPORT LEVEL = V SHAPE - RESISTANCE LEVEL = APEX LEVEL - GAP RESISTANCE & GAP SUPPORT = OPEN CLOSE CANDLE - SUPPORT BECAME RESISTANCE & RESISTANCE BECAME SUPPORT INDICATOR
Bomb Bank Signal
Igor Pereira Calil
炸彈銀行訊號:您對 MetaTrader 4 的信心指標 Bomb Bank Signal 是 MetaTrader 4 的一個強大指標,旨在識別金融市場中最相關的趨勢。如果您正在尋找一種能夠準確預測運動的工具,那麼炸彈庫就是您需要的盟友。 運作原理: 該指標結合了三種不同的方法——成交量分析、蠟燭收盤價和對稱趨勢——來偵測和發出買賣機會訊號。當炸彈銀行識別出買入機會時,它就像一顆「炸彈」;當它偵測到賣出訊號時,它就像一個「頭骨」。 為什麼炸彈銀行不一樣? 完全可靠性:炸彈庫訊號不會刪除訊號。訊號一旦發出,就會一直存在,確保您不會錯過任何機會。 極為準確:炸彈庫不會發出錯誤訊號。它會即時更新您的訊息,隨著市場的變化進行調整,但保持先前訊號的透明度。 即時更新:訊號被即時識別並在必要時更新,使您能夠快速響應市場變化。 最大化您的結果: 炸彈銀行訊號是識別趨勢持續走勢的理想選擇。例如,如果您已經做空並且指標在 M15 發出買入訊號,那麼現在就是平倉或部分下單的最佳時機,反之亦然。 此外,經過仔細分析,我們建議您遵循M30、H1和H4上的訊號,停損僅50點。這使
作者的更多信息
最友好的跟单交互界面,最丰富的易用功能,最优跟单方案.  跟单 EASY :简单使用,加载选择信号源或者接收端即可简单使用,轻松使用跟单系统 FAST: 快速复制订单,算法最优跟单机制,优先计算新信号,优先队列处理接收到特殊信号 Multiple: 1.支持多信号同时发送,多账户同时选择多个账户复制                                              2.多平台支持,MT4 和MT5互通.(需同时购买安装MT4和MT5) Powerful :强大的功能,你可以找到市面上没有的功能 . .支持 减仓 ,支持手动 订单绑定 信号订单 上....提供各种 过滤以及指定个性化设置(   给每个信号源或者品种分别制定跟单方案   ) ... [支持 中文,英文 ] 增加大手数分单功能 (应用场景,需要跟单较大手数,手数超出平台上限,也可以自己设置的上限,一般应用前者,分单会造成不必要的跟单性能开销,当达到平台单笔手数上限可以分单进行) 增加反向同步平仓功能: 功能启动后 接收端平仓,发送端反向同步平仓. 增加多种跟单内核, ①传统的强映射强绑定方式
最友好的跟单交互界面,最丰富的易用功能,最优跟单方案.  跟单. EASY :简单使用,加载选择信号源或者接收端即可简单使用,轻松跟单 FAST: 快速复制订单,算法最优跟单机制,优先计算新信号,优先队列处理接收到特殊信号 Multiple: 1.支持多信号同时发送,多账户同时选择多个账户复制                                              2.多平台支持,MT4 和MT5互通.( 需同时购买安装MT4和MT5 ) Powerful :强大的功能,你可以找到市面上没有的功能 . .支持 减仓 ,支持手动 订单绑定 信号订单 上....提供各种 过滤以及指定个性化设置( 给每个信号源或者品种分别制定跟单方案 ) ... [支持 中文,英文 ] 增加大手数分单功能 (应用场景,需要跟单较大手数,手数超出平台上限,也可以自己设置的上限,一般应用前者,分单会造成不必要的跟单性能开销,当达到平台单笔手数上限可以分单进行) 增加反向同步平仓功能: 功能启动后 接收端平仓,发送端反向同步平仓. 增加多种跟单内核, ①传统的强映射强绑定方式 ②可以支持设置M
支点交易 : 1.pp 支点 2. r1 r2 r3 , s1 s2  s3 交易实用必备工具指标 波浪自动计算指标,通道趋势交易 完美的趋势-波浪自动计算通道计算 , MT4版本 完美的趋势-波浪自动计算通道计算 , MT5版本 本地跟单复制交易 Easy And Fast Copy , MT4版本 Easy And Fast Copy , MT5版本 本地跟单复制交易 模拟试用 Easy And Fast Copy , MT4 模拟账号运行 Easy And Fast Copy , MT5 模拟账号运行 合作QQ:556024" 合作wechat:556024" 合作email:556024@qq.com" 专业EA指标定制编写. 支点( pivot points) 作为一种交易策略已经很长时间了,最初是场内交易员使用这种方法。使用这种方法通过几个简单的计算就可以了解市场在一天中的去向。 支点法中的支点是一天中市场方向的转向点,通过简单地计算前日的高点、低点和收盘价,可以得到一系列点位。这些点位可能形成关键的支撑和阻力线。支点位,支撑和阻力位被统称为支点水位。 你所看到的市场每
FREE
交易实用必备工具指标 波浪自动计算指标,通道趋势交易 完美的趋势-波浪自动计算通道计算 , MT4版本 完美的趋势-波浪自动计算通道计算 , MT5版本 本地跟单复制交易 Easy And Fast Copy , MT4版本 Easy And Fast Copy , MT5版本 本地跟单复制交易 模拟试用 Easy And Fast Copy , MT4 模拟账号运行 Easy And Fast Copy , MT5 模拟账号运行 砖图PRO->>> 砖图在主图上的显示 . 砖形图因为比较理想地剔除掉了价格毛刺,因此,看上去令人感觉非常舒服。特别是, 在其上建立基于形态的交易系统看起来非常理想。 比如,如果我们打算使用趋势线,我们会经常发现,有些趋势线的突破并没有多大的意义,它不过是在震荡而已。荡着荡着,趋势线就突破了。而使用砖形图就可以有效地避免类似的尴尬。
FREE
交易者的最佳伙伴!   交易助手 : 这是一款功能非常丰富的交易辅助工具  . 开发不易请支持Pro 点击跳转 K Trade Assistant Pro MT5 助手详细说明文档,点击阅读 基本使用设置 基本: 支持语言的选择切换(目前支持中文和英文)   自动识别语言 支持 热键开平仓 绑定, 使用快捷键进行快速开平仓...... 快捷键平仓. 解锁支持大部分功能 复盘 操作,可以在 测试环境下使用 开仓平仓区域: 一键开仓( 包含止盈止损的便捷设置,手数自动计算等便捷功能) 一键平仓 (锁仓),极简的风格设计,可以自由选择平仓品种,平仓类型(多单,空单,或者挂单),是否平仓盈利大于0的订单,是否平仓亏损订单,平仓比例的设置(0~100%),且是否平仓反向,以及锁仓功能,均在选项中可以直接实现操作. 多键平仓 划线开单控件 计算出多单或者空单的 平均持仓价格 并划线 止盈止损等自动 设置 多品种,多,空,分类平仓 .. 挂单区: 批量间隔挂单 功能。 批量挂单删除 功能 自动化功能区: 止损保护功能 移动止损功能 账户风控 利润保护 批量
FREE
Pivot Trading 4
Kaijun Wang
5 (5)
支点交易: 1.pp 支点 2. r1 r2 r3 , s1 s2   s3 交易实用必备工具指标 波浪自动计算指标,通道趋势交易 完美的趋势-波浪自动计算通道计算 , MT4版本 完美的趋势-波浪自动计算通道计算 , MT5版本 本地跟单复制交易 Easy And Fast Copy , MT4版本 Easy And Fast Copy , MT5版本 本地跟单复制交易 模拟试用 Easy And Fast Copy , MT4 模拟账号运行 Easy And Fast Copy , MT5 模拟账号运行 强烈推荐趋势指标, 波浪的标准自动计算   和   波浪的标准自动计算MT5版本     合作QQ:556024" 合作wechat:556024" 合作email:556024@qq.com" 专业EA指标定制编写. 支点( pivot points) 作为一种交易策略已经很长时间了,最初是场内交易员使用这种方法。使用这种方法通过几个简单的计算就可以了解市场在一天中的去向。 支点法中的支点是一天中市场方向的转向点,通过简单地计算前日的高点、低点和收盘价,可以得到一系列点位
FREE
交易实用必备工具指标 波浪自动计算指标,通道趋势交易 完美的趋势-波浪自动计算通道计算 , MT4版本 完美的趋势-波浪自动计算通道计算 , MT5版本 本地跟单复制交易 Easy And Fast Copy , MT4版本 Easy And Fast Copy , MT5版本 本地跟单复制交易 模拟试用 Easy And Fast Copy , MT4 模拟账号运行 Easy And Fast Copy , MT5 模拟账号运行 MACD称为异同移动平均线,是从双指数移动平均线发展而来的 ,由快的指数移动平均线(EMA12)减去慢的指数移动平均线(EMA26)得到快线DIF,再用2×(快线DIF-DIF的9日加权移动均线DEA)得到MACD柱。MACD的意义和双移动平均线基本相同,即由快、慢均线的离散、聚合表征当前的多空状态和股价可能的发展变化趋势,但阅读起来更方便。MACD的变化代表着市场趋势的变化,不同K线级别的MACD代表当前级别周期中的 买卖趋势。 1.本指标增加MACD的双线显示, 2.并且对能量柱进行4色不同的渐变! 强烈推荐趋势指标, 波浪的标准自动计算   和
FREE
交易者的最佳伙伴 !  助手详细说明文档,点击阅读 基本使用设置 基本: 支持语言的选择切换(目前支持中文和英文)   自动识别语言 支持 热键开平仓 绑定, 使用快捷键进行快速开平仓......        快捷键平仓. 解锁支持大部分功能 复盘 操作,可以在 测试环境下使用 开仓平仓区域: 一键开仓( 包含止盈止损的便捷设置,手数自动计算等便捷功能) 一键平仓 (锁仓),极简的风格设计,可以自由选择平仓品种,平仓类型(多单,空单,或者挂单),是否平仓盈利大于0的订单,是否平仓亏损订单,平仓比例的设置(0~100%),且是否平仓反向,以及锁仓功能,均在选项中可以直接实现操作. 多键平仓 划线开单控件 计算出多单或者空单的 平均持仓价格 并划线 止盈止损等自动 设置 多品种,多,空,分类平仓  .. 挂单区: 批量间隔挂单 功能。 批量挂单删除 功能 设置区: 开平仓消息框提示再确认开关 语言切换 热键设置 点数校正 自动化功能区: 划线交易 自动止盈止损 账户保盈 保护止损 移动止损 账户风控 影子订单功能 万向加仓功能 ①逆势加仓多单
Fit Channel MT5
Kaijun Wang
3 (2)
The market price usually falls between the borders of the channel    .   If the price is out of range , it is a trading signal or trading opportunity  . Basically , Fit Channel can be used to help determine overbought and oversold conditions in the market. When the market price is close to the upper limit, the market is considered overbought (sell zone). Conversely, when the market price is close to the bottom range, the market is considered oversold (buy zone). However, the research can
交易实用必备工具指标 波浪自动计算指标,通道趋势交易 完美的趋势-波浪自动计算通道计算 , MT4版本 完美的趋势-波浪自动计算通道计算 , MT5版本 本地跟单复制交易 Easy And Fast Copy , MT4版本 Easy And Fast Copy , MT5版本 本地跟单复制交易 模拟试用 Easy And Fast Copy , MT4 模拟账号运行 Easy And Fast Copy , MT5 模拟账号运行 高级布林带: 1.布林中轨会随着方向变色 "  2.布林外轨扩张和收缩都会在外轨进行变色标识"  3.布林中轨计算方式可以选择任意均线,例如EMA"  4.同样可以选择任意价格应用模式进行计算"    强烈推荐趋势指标 , 波浪的标准自动计算   和   波浪的标准自动计算MT5版本     "合作QQ:556024" "合作wechat:556024" "合作email:556024@qq.com" 布林线(Bollinger Band) 是根据统计学中的标准差原理设计出来的一种非常实用的技术指标。它由 三条 轨道线组成,其中上下两条线分别可以看
FREE
交易实用必备工具指标 波浪自动计算指标,通道趋势交易 完美的趋势-波浪自动计算通道计算 , MT4版本 完美的趋势-波浪自动计算通道计算 , MT5版本 本地跟单复制交易 Easy And Fast Copy , MT4版本 Easy And Fast Copy , MT5版本 本地跟单复制交易 模拟试用 Easy And Fast Copy , MT4 模拟账号运行 Easy And Fast Copy , MT5 模拟账号运行 高级布林带: 1.布林中轨会随着方向变色 "  2.布林外轨扩张和收缩都会在外轨进行变色标识"  3.布林中轨计算方式可以选择任意均线,例如EMA"  4.同样可以选择任意价格应用模式进行计算"    强烈推荐趋势指标, 波浪的标准自动计算   和   波浪的标准自动计算MT5版本     "合作QQ:556024  " "合作wechat:556024" "合作email:556024@qq.com" 布林线(Bollinger Band) 是根据统计学中的标准差原理设计出来的一种非常实用的技术指标。它由 三条 轨道线组成,其中上下两条线分别可以
FREE
Renko indicator MainChart
Kaijun Wang
4.27 (11)
交易实用必备工具指标 波浪自动计算指标,通道趋势交易 完美的趋势-波浪自动计算通道计算 , MT4版本 完美的趋势-波浪自动计算通道计算 , MT5版本 本地跟单复制交易 Easy And Fast Copy , MT4版本 Easy And Fast Copy , MT5版本 本地跟单复制交易 模拟试用 Easy And Fast Copy , MT4 模拟账号运行 Easy And Fast Copy , MT5 模拟账号运行 砖图PRO->>> 砖图在主图上的显示 . 砖形图因为比较理想地剔除掉了价格毛刺,因此,看上去令人感觉非常舒服。特别是, 在其上建立基于形态的交易系统看起来非常理想。 比如,如果我们打算使用趋势线,我们会经常发现,有些趋势线的突破并没有多大的意义,它不过是在震荡而已。荡着荡着,趋势线就突破了。而使用砖形图就可以有效地避免类似的尴尬。
FREE
KDJ Index For MT5
Kaijun Wang
4.33 (6)
交易实用必备工具指标 波浪自动计算指标,通道趋势交易 完美的趋势-波浪自动计算通道计算 , MT4版本 完美的趋势-波浪自动计算通道计算 , MT5版本 本地跟单复制交易 Easy And Fast Copy , MT4版本 Easy And Fast Copy , MT5版本 本地跟单复制交易 模拟试用 Easy And Fast Copy , MT4 模拟账号运行 Easy And Fast Copy , MT5 模拟账号运行 "Cooperative QQ:556024 "  "Cooperation wechat:556024"  "Cooperative email:556024@qq.com" 强烈推荐趋势指标, 波浪的标准自动计算   和   波浪的标准自动计算MT5版本     KDJ指标又叫 随机指标 ,是一种相当新颖、实用的技术分析指标,它起先用于期货市场的分析,后被广泛用于股市的中短期趋势分析,是期货和股票市场上最常用的技术分析工具。 随机指标KDJ一般是用于股票分析的统计体系,根据统计学原理,通过一个特定的周期(常为9日、9周等)内出现过的最高价、最低价及
FREE
K Trade Assistant
Kaijun Wang
4.56 (9)
交易者的最佳伙伴!   交易助手 : 这是一款功能非常丰富的交易辅助工具     . 开发不易请支持Pro 点击跳转 K Trade Assistant Pro   助手详细说明文档,点击阅读 基本使用设置 基本: 支持语言的选择切换(目前支持中文和英文) 自动识别语言 支持 热键开平仓 绑定, 使用快捷键进行快速开平仓......  快捷键平仓. 解锁支持大部分功能 复盘 操作,可以在 测试环境下使用 开仓平仓区域: 一键开仓( 包含止盈止损的便捷设置,手数自动计算等便捷功能) 一键平仓 (锁仓),极简的风格设计,可以自由选择平仓品种,平仓类型(多单,空单,或者挂单),是否平仓盈利大于0的订单,是否平仓亏损订单,平仓比例的设置(0~100%),且是否平仓反向,以及锁仓功能,均在选项中可以直接实现操作. 多键平仓 划线开单控件 计算出多单或者空单的 平均持仓价格 并划线 止盈止损等自动 设置 多品种,多,空,分类平仓 .. 挂单区: 批量间隔挂单 功能。 批量挂单删除 功能 自动化功能区: 止损保护功能 移动止损功能 账户风控 利润保护 批量图表
FREE
KDJ Index 4
Kaijun Wang
5 (2)
交易实用必备工具指标 波浪自动计算指标,通道趋势交易 完美的趋势-波浪自动计算通道计算 , MT4版本 完美的趋势-波浪自动计算通道计算 , MT5版本 本地跟单复制交易 Easy And Fast Copy , MT4版本 Easy And Fast Copy , MT5版本 本地跟单复制交易 模拟试用 Easy And Fast Copy , MT4 模拟账号运行 Easy And Fast Copy , MT5 模拟账号运行 "Cooperative QQ:556024 "  "Cooperation wechat:556024 "  "Cooperative email:556024@qq.com" 强烈推荐趋势指标, 波浪的标准自动计算   和   波浪的标准自动计算MT5版本     KDJ指标又叫 随机指标 ,是一种相当新颖、实用的技术分析指标,它起先用于期货市场的分析,后被广泛用于股市的中短期趋势分析,是期货和股票市场上最常用的技术分析工具。 随机指标KDJ一般是用于股票分析的统计体系,根据统计学原理,通过一个特定的周期(常为9日、9周等)内出现过的最高价、最低价
FREE
指标适用于趋势跟随者! 三条均线构建的交易系统.顺势交易,让利润奔跑 . 交易实用必备工具指标 波浪自动计算指标,通道趋势交易 完美的趋势-波浪自动计算通道计算 , MT4版本 完美的趋势-波浪自动计算通道计算 , MT5版本 本地跟单复制交易 Easy And Fast Copy , MT4版本 Easy And Fast Copy , MT5版本 本地跟单复制交易 模拟试用 Easy And Fast Copy , MT4 模拟账号运行 Easy And Fast Copy , MT5 模拟账号运行 强烈推荐趋势指标, 波浪的标准自动计算   和   波浪的标准自动计算MT5版本 合作QQ:556024" 合作wechat:556024" 合作email:556024@qq.com" 专业EA指标定制编写. 首先,我们要明白,所有的移动均线都是滞后指标,它们只能事后告诉你市场已经转向,即使它们提供了有价值的信息并且帮助你建立了头寸,不能协助在利润最大化方面发挥太多作用,所以要配合均线价值回归区域使用,价格可以根据重要支撑线的指示,不是滞后的,当市场从目前的隧道出发跟随趋势交易不
FREE
KTrade Fibo For MT5
Kaijun Wang
4.67 (3)
交易实用必备工具指标 波浪自动计算指标,通道趋势交易 完美的趋势-波浪自动计算通道计算 , MT4版本 完美的趋势-波浪自动计算通道计算 , MT5版本 本地跟单复制交易 Easy And Fast Copy , MT4版本 Easy And Fast Copy , MT5版本 本地跟单复制交易 模拟试用 Easy And Fast Copy , MT4 模拟账号运行 Easy And Fast Copy , MT5 模拟账号运行 Fibo:   来源于KTrade 1.自动计算分析波段.->得出所需波段 2.画出斐波那契 回撤线,以及扩展线作为参考 指标波段分析如何得来->请参考如下 波段分析来源于波浪分析指标↓↓↓ 波浪自动计算指标,通道趋势交易 完美的趋势-波浪自动计算通道计算 , MT4版本 完美的趋势-波浪自动计算通道计算 , MT5版本
FREE
交易实用必备工具指标 波浪自动计算指标,通道趋势交易 完美的趋势-波浪自动计算通道计算 , MT4版本 完美的趋势-波浪自动计算通道计算 , MT5版本 本地跟单复制交易 Easy And Fast Copy , MT4版本 Easy And Fast Copy , MT5版本 本地跟单复制交易 模拟试用 Easy And Fast Copy , MT4 模拟账号运行 Easy And Fast Copy , MT5 模拟账号运行 顺势指标又叫CCI指标,CCI指标是 美国 股市 技术分析   家唐纳德·蓝伯特(Donald Lambert)于20世纪80年代提出的,专门测量股价、外汇或者贵 金属 交易是否已超出常态分布范围。属于超买超卖类指标中较特殊的一种。波动于正无穷大和负无穷大之间。但是,又不需要以0为中轴线,这一点也和波动于正无穷大和负无穷大的指标不同。 相对强弱指标RSI是根据一定时期内上涨点数和下跌点数之和的比率制作出的一种技术曲线。能够反映出市场在一定时期内的景气程度。由威尔斯.威尔德(Welles Wilder)最早应用于期货买卖,后来人们发现在众多的图表技术分析中,
FREE
指标适用于趋势跟随者! 三条均线构建的交易系统.顺势交易,让利润奔 跑. 交易实用必备工具指标 波浪自动计算指标,通道趋势交易 完美的趋势-波浪自动计算通道计算 , MT4版本 完美的趋势-波浪自动计算通道计算 , MT5版本 本地跟单复制交易 Easy And Fast Copy , MT4版本 Easy And Fast Copy , MT5版本 本地跟单复制交易 模拟试用 Easy And Fast Copy , MT4 模拟账号运行 Easy And Fast Copy , MT5 模拟账号运行 强烈推荐趋势指标, 波浪的标准自动计算   和   波浪的标准自动计算MT5版本 升级版蜡烛图颜色可变 合作QQ:556024" 合作wechat:556024" 合作email:556024@qq.com" 专业EA指标定制编写. 首先,我们要明白,所有的移动均线都是滞后指标,它们只能事后告诉你市场已经转向,即使它们提供了有价值的信息并且帮助你建立了头寸,不能协助在利润最大化方面发挥太多作用,所以要配合均线价值回归区域使用,价格可以根据重要支撑线的指示,不是滞后的,当市场从目前的隧道
FREE
交易实用必备工具指标 波浪自动计算指标,通道趋势交易 完美的趋势-波浪自动计算通道计算 , MT4版本 完美的趋势-波浪自动计算通道计算 , MT5版本 本地跟单复制交易 Easy And Fast Copy , MT4版本 Easy And Fast Copy , MT5版本 本地跟单复制交易 模拟试用 Easy And Fast Copy , MT4 模拟账号运行 Easy And Fast Copy , MT5 模拟账号运行 可以设置其他周期品种的K线图 覆盖到本窗口中,观察到关联性波动 品种名留空则放弃显示该品种 "Cooperative QQ:556024"  "Cooperation wechat:556024"  "Cooperative email:556024@qq.com"
FREE
MACD two line four colors
Kaijun Wang
4.67 (3)
交易实用必备工具指标 波浪自动计算指标,通道趋势交易 完美的趋势-波浪自动计算通道计算 , MT4版本 完美的趋势-波浪自动计算通道计算 , MT5版本 本地跟单复制交易 Easy And Fast Copy , MT4版本 Easy And Fast Copy , MT5版本 本地跟单复制交易 模拟试用 Easy And Fast Copy , MT4 模拟账号运行 Easy And Fast Copy , MT5 模拟账号运行 MACD称为异同移动平均线 ,是从双指数移动平均线发展而来的,由快的指数移动平均线(EMA12)减去慢的指数移动平均线(EMA26)得到快线DIF,再用2×(快线DIF-DIF的9日加权移动均线DEA)得到MACD柱。MACD的意义和双移动平均线基本相同,  即由快、慢均线的离散、聚合表征当前的多空状态和股价可能的发展变化趋势,但阅读起来更方便。MACD的变化代表着市场趋势的变化,不同K线级别的MACD代表当前级别周期中的买卖趋势。 1.本指标增加MACD的双线显示, 2.并且对能量柱进行4色不同的渐变! 强烈推荐趋势指标, 波浪的标准自动计算   和
FREE
Fit Channel
Kaijun Wang
5 (2)
The market price usually falls between the borders of the   channel   . If the price is out of range ,  it is a trading signal or trading opportunity  . Basically, Fit Channel can be used to help determine overbought and oversold conditions in the market. When the market price is close to the upper limit, the market is considered overbought (sell zone). Conversely, when the market price is close to the bottom range, the market is considered oversold (buy zone). However, the research can b
XM Channel
Kaijun Wang
4 (1)
The market price usually falls between the borders of the channel . If the price is out of range, it is a trading signal or trading opportunity . Basically, Fit Channel can be used to help determine overbought and oversold conditions in the market. When the market price is close to the upper limit, the market is considered overbought (sell zone). Conversely, when the market price is close to the bottom range, the market is considered oversold (buy zone). However, the research can be used
交易实用必备工具指标 波浪自动计算指标,通道趋势交易 完美的趋势-波浪自动计算通道计算 , MT4版本 完美的趋势-波浪自动计算通道计算 , MT5版本 本地跟单复制交易 Easy And Fast Copy , MT4版本 Easy And Fast Copy , MT5版本 本地跟单复制交易 模拟试用 Easy And Fast Copy , MT4 模拟账号运行 Easy And Fast Copy , MT5 模拟账号运行 强烈推荐趋势指标, 波浪的标准自动计算   和   波浪的标准自动计算MT5版本   合作QQ:556024" 合作wechat:556024" 合作email:556024@qq.com" 专业EA指标定制编写. 指标用于显示历史交易路径,方便大家看到本货币对的交易情况.
FREE
Donchian通道(唐奇安通道指标)是用于交易突破的最古老、最简单的技术指标之一。   一般来说,唐奇安通道的宽度越宽,市场波动就越大,而唐奇安通道越窄,市场波动性也就越小 。此外,价格走势可以穿过布林带,但你看不到唐奇安通道的这种特征,因为其波段正在测量特定时期的最高价和最低价。 交易实用必备工具指标 波浪自动计算指标,通道趋势交易 完美的趋势-波浪自动计算通道计算 , MT4版本 完美的趋势-波浪自动计算通道计算 , MT5版本 本地跟单复制交易 Easy And Fast Copy , MT4版本 Easy And Fast Copy , MT5版本 本地跟单复制交易 模拟试用 Easy And Fast Copy , MT4 模拟账号运行 Easy And Fast Copy , MT5 模拟账号运行 唐奇安通道指标计算: 唐奇安上阻力线 - 由过去N天的当日最高价的最大值形成。 唐奇安下支撑线 - 由过去N天的当日最低价的最小值形成。 中心线 - (上线 + 下线)/ 2   唐奇安通道信号   唐奇安通道常用作突破指标。它提供了两种主要类型的突破信号,一个是上阻力线或下支
FREE
交易者的最佳伙伴! 助手详细说明文档,点击阅读 基本使用设置 基本: 支持语言的选择切换(目前支持中文和英文)   自动识别语言 支持 热键开平仓 绑定, 使用快捷键进行快速开平仓......          快捷键平仓. 解锁支持大部分功能 复盘 操作,可以在 测试环境下使用  开仓平仓区域: 一键开仓( 包含止盈止损的便捷设置,手数自动计算等便捷功能) 一键平仓 (锁仓),极简的风格设计,可以自由选择平仓品种,平仓类型(多单,空单,或者挂单),是否平仓盈利大于0的订单,是否平仓亏损订单,平仓比例的设置(0~100%),且是否平仓反向,以及锁仓功能,均在选项中可以直接实现操作. 多键平仓 划线开单控件 计算出多单或者空单的 平均持仓价格 并划线 止盈止损等自动 设置 多品种,多,空,分类平仓 .. 挂单区: 批量间隔挂单 功能。 批量挂单删除 功能 设置区: 开平仓消息框提示再确认开关 语言切换 热键设置 点数校正 自动化功能区: 划线交易 自动止盈止损 账户保盈 保护止损 移动止损 账户风控 影子订单功能 万向加仓模块 ①逆势加仓多
Donchian通道(唐奇安通道指标)是用于交易突破的最古老、最简单的技术指标之一。 一般来说,唐奇安通道的宽度越宽,市场波动就越大,而唐奇安通道越窄,市场波动性也就越小 。此外,价格走势可以穿过布林带,但你看不到唐奇安通道的这种特征,因为其波段正在测量特定时期的最高价和最低价。 交易实用必备工具指标 波浪自动计算指标,通道趋势交易 完美的趋势-波浪自动计算通道计算 , MT4版本 完美的趋势-波浪自动计算通道计算 , MT5版本 本地跟单复制交易 Easy And Fast Copy , MT4版本 Easy And Fast Copy , MT5版本 本地跟单复制交易 模拟试用 Easy And Fast Copy , MT4 模拟账号运行 Easy And Fast Copy , MT5 模拟账号运行 唐奇安通道指标计算: 唐奇安上阻力线 - 由过去N天的当日最高价的最大值形成。 唐奇安下支撑线 - 由过去N天的当日最低价的最小值形成。 中心线 - (上线 + 下线)/ 2   唐奇安通道信号   唐奇安通道常用作突破指标。它提供了两种主要类型的突破信号,一个是上阻力线或下支撑线
FREE
交易实用必备工具指标 波浪自动计算指标,通道趋势交易 完美的趋势-波浪自动计算通道计算 , MT4版本 完美的趋势-波浪自动计算通道计算 , MT5版本 本地跟单复制交易 Easy And Fast Copy , MT4版本 Easy And Fast Copy , MT5版本 本地跟单复制交易 模拟试用 Easy And Fast Copy , MT4 模拟账号运行 Easy And Fast Copy , MT5 模拟账号运行 顺势指标又叫CCI指标,CCI指标是 美国 股市 技术分析   家唐纳德·蓝伯特(Donald Lambert)于20世纪80年代提出的,专门测量股价、外汇或者贵 金属 交易是否已超出常态分布范围。属于超买超卖类指标中较特殊的一种。波动于正无穷大和负无穷大之间。但是,又不需要以0为中轴线,这一点也和波动于正无穷大和负无穷大的指标不同。 相对强弱指标RSI是根据一定时期内上涨点数和下跌点数之和的比率制作出的一种技术曲线。能够反映出市场在一定时期内的景气程度。由威尔斯.威尔德(Welles Wilder)最早应用于期货买卖,后来人们发现在众多的图表技术分析中,
FREE
KTrade Fibo
Kaijun Wang
4 (1)
交易实用必备工具指标 波浪自动计算指标,通道趋势交易 完美的趋势-波浪自动计算通道计算 , MT4版本 完美的趋势-波浪自动计算通道计算 , MT5版本 本地跟单复制交易 Easy And Fast Copy , MT4版本 Easy And Fast Copy , MT5版本 本地跟单复制交易 模拟试用 Easy And Fast Copy , MT4 模拟账号运行 Easy And Fast Copy , MT5 模拟账号运行 Fibo:  来源于KTrade 1.自动计算分析波段.->得出所需波段 2.画出斐波那契 回撤线,以及扩展线作为参考 指标波段分析如何得来->请参考如下 波段分析来源于波浪分析指标↓↓↓ 波浪自动计算指标,通道趋势交易 完美的趋势-波浪自动计算通道计算 , MT4版本 完美的趋势-波浪自动计算通道计算 , MT5版本
FREE
MACD divergence  signals   MACD称为异同移动平均线,是从双指数移动平均线发展而来的,由快的指数移动平均线(EMA12)减去慢的指数移动平均线(EMA26)得到快线DIF,再用2×(快线DIF-DIF的9日加权移动均线DEA)得到MACD柱。MACD的意义和双移动平均线基本相同,  即由快、慢均线的离散、聚合表征当前的多空状态和股价可能的发展变化趋势,但阅读起来更方便。MACD的变化代表着市场趋势的变化,不同K线级别的MACD代表当前级别周期中的买卖趋势。 1.本指标增加MACD的双线显示, 2.并且对能量柱进行4色不同的渐变 ! 3.增加MACD背离信号显示及提示 合作QQ:556024" 合作wechat:556024" 合作email:556024@qq.com"
筛选:
elite luis
3331
elite luis 2023.03.04 09:25 
 

用户没有留下任何评级信息

Kaijun Wang
138217
来自开发人员的回复 Kaijun Wang 2023.03.04 09:37
q1: You can ignore this setting, I use legacy for internal testing trendline algorithm accuracy. q2. 2 and 3 are intervals of 10 seconds to set the time to switch varieties, and the sequence of varieties is the second parameter setting, separated by "|", the first parameter is the switch q3. Trend line and channel line touch alarm q4. Vibration frame touch reminder. q5. 31 refers to the spread, $5 refers to the margin required for trading 0.01 lot q6. pre-W refers to the black WAVE, M refers to the main trend band, S refers to the minimum unit structure, and the value represents the calculated average length.
Qilin
30
Qilin 2021.05.18 14:01 
 

Reviewing this at the moment. The indicator looks pretty cool and the developer is really helpful.

연나라
750
연나라 2021.04.15 14:46 
 

I rented this indicator for a month and then bought it today because I liked it so much. There was an mq5 error, but the programmer was really friendly. He did his best to solve the problem. His response is also very quick. I am getting a lot of help from this indicator. Best!

Kaijun Wang
138217
来自开发人员的回复 Kaijun Wang 2021.04.15 14:58
谢谢!希望你的交易系统可以因此变得更完美
Hao Wu
636
Hao Wu 2021.03.04 07:31 
 

用户没有留下任何评级信息

cnbluse
47
cnbluse 2020.12.21 05:28 
 

妈妈再也不担心我犯低级错误了。

回复评论
版本 7.10 2023.04.11
>>>>>>>
增加按钮隐藏
版本 6.89 2023.03.07
>>>>>>>>>>>>>>>
版本 6.88 2023.03.07
>>>>>>>>>
版本 6.86 2023.03.06
>>>>>>>>>>>>>>>
版本 6.85 2023.03.06
>>>>>>>>>>
版本 6.83 2023.03.06
>>>>>>>>>>>>>>>>>
版本 6.82 2023.03.05
>>>>>>>>>>>>
版本 6.81 2023.03.05
>>>>>
增加动态组件的大小调整,和自适应大小
版本 6.8 2023.03.04
>>>>>
1.增加小组件控制,可以删除屏幕中的各项组件,可以多样化加载图表
2.增加国际交易风格的自动切换,自适应国际交易习惯
3.增加震荡区闪烁控制,可以设置关闭.
版本 5.8 2023.02.19
>>>>>>
1.优化更新算法逻辑,优化判断条件细节
2.增加主趋势浪显示

版本 3.3 2022.03.21
>>>>>>>>>>
版本 3.2 2022.03.18
>>>>>
1.算法更新
2.纠错更新
版本 3.1 2021.11.21
>>>>>>>>>>>
版本 2.88 2021.06.19
>>>>>
1.更新第一次图表计算计算K限制,0为取消限制....
2.更新指标加载后,关闭指标后复原图表的各项设置
版本 2.8 2021.04.15
>>>>>>>>>
版本 2.6 2021.03.29
>>>>>
修复运行间隔时间过长空白拐点未计算
版本 2.5 2020.12.28
>>>>>>>>
版本 2.3 2020.12.28
>>>>>>>>>>>>
版本 2.2 2020.12.27
>>>>>>>>>>>
版本 2.1 2020.12.27
>>>>>>>>>增加风格自动设置为白底,可选择关闭
版本 2.0 2020.12.19
>>>>>>>updata alert function...
版本 1.201 2020.12.06
>>>>>>>算法优化,版本同MT5的1.20
版本 1.20 2020.10.20
>>>>>>更新通道显示不友好
版本 1.10 2020.10.10
->>>>更新了默认黑色背景下不友好的显示...