Chart Projection
- 指标
- Lorentzos Roussos
- 版本: 2.4
- 更新: 24 七月 2021
图表投影指标
图表投影最初是一个小指标,它使用内置的之字形技术指标来预测未来的价格走势(您可以在评论中找到旧算法)
这个想法很简单,过去的价格行为不会转化为未来,但也许如果我们没有过于具体,或者过于笼统,我们可以提取关于可能发生的事情的指导方针。
图表投影的“论文”是这样的:
交易者会查看图表来做出决定,因此,算法也可以查看图表。不读指标值,不读价格,但看图表
寻找某物就是找到一个重复的熟悉模式,并且,为了找到那个熟悉的模式,您需要存储它。
Zig zag 是不够的,需要一种新的算法来做到这一点,并保留有关图表视觉方面的数据,因此需要光学算法。
Chart Projection 配备了 3 种光学算法,用于对价格行为进行低、中和高范围扫描。每个光学器件都会收集与兴趣点图表直接相关的历史数据。
兴趣点是高点或低点,但这不是我们的分析应该停止的地方。每一个高点和低点都有一个领先的势头和一个结果,以及它在整体趋势中的位置。光学算法将其与引导和引导至感兴趣点的时间一起收集。随着价格的发展,来自每个光学器件的数据不断收集,并产生对特定 POI(兴趣点)出现时价格行为的估计。当检测到 POI 时,将启动一个匹配过程,该过程试图找到最相似的一组优化数据,这些数据适合该 POI 周围的价格行为。
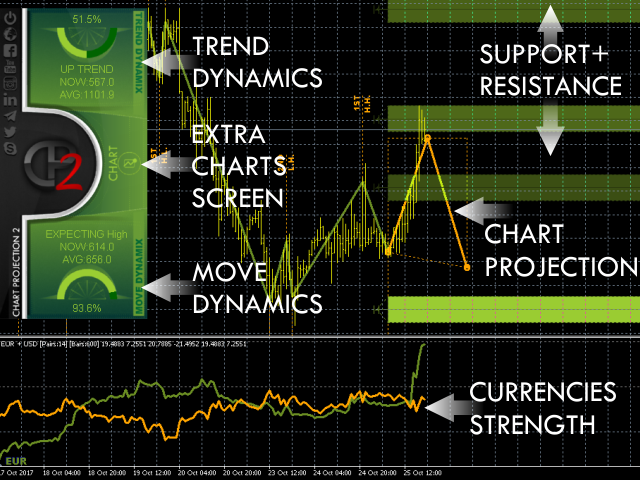
最新更新为其带来了额外的功能,例如:
- 七种附加投影方法。
- 显示支撑和阻力区域。
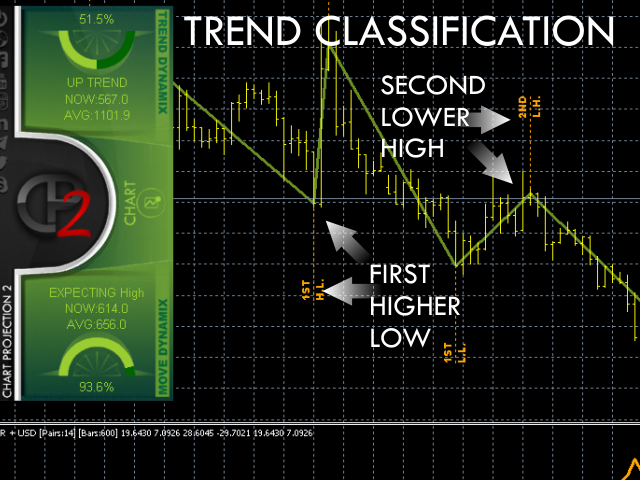
- 显示高点/低点及其在整体趋势中的位置。
- 可选的货币强度指数,带有单独的显示窗口。
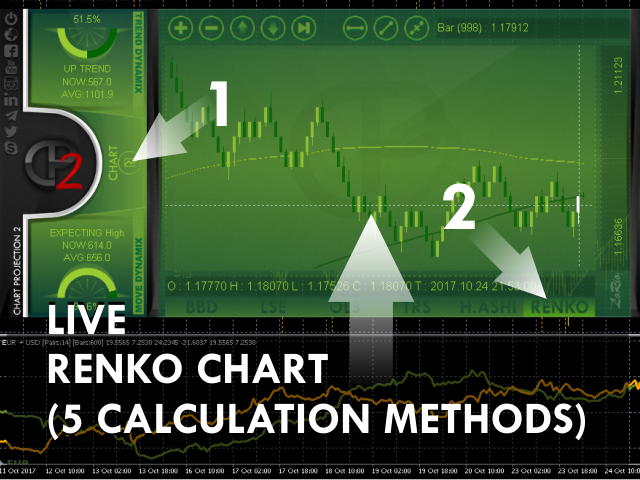
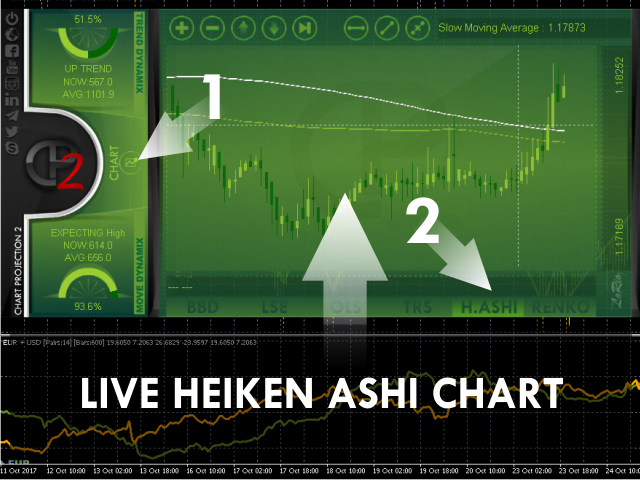
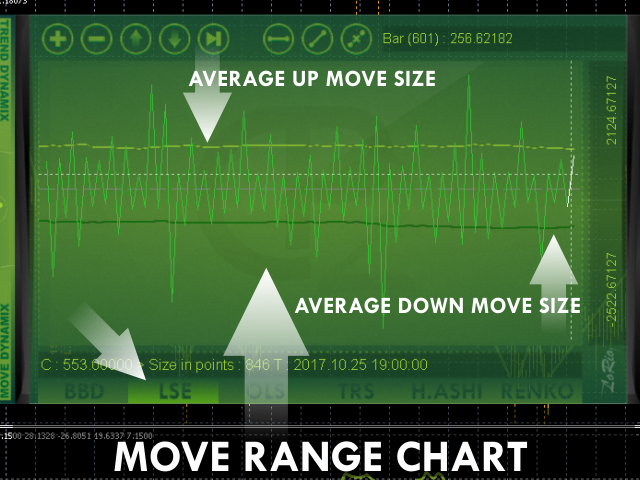
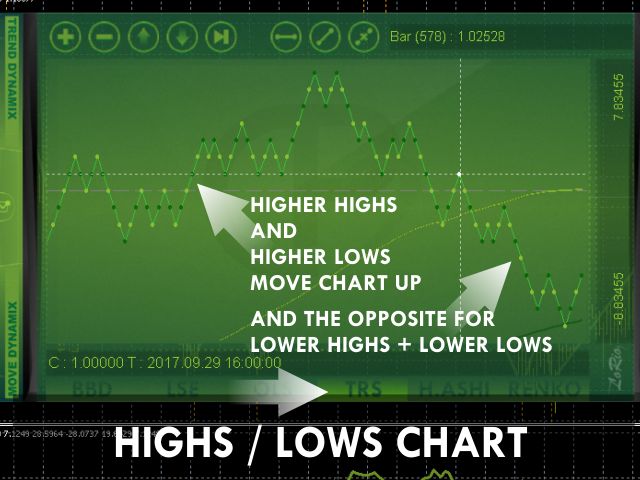
- 具有 6 种图表类型的额外图表功能
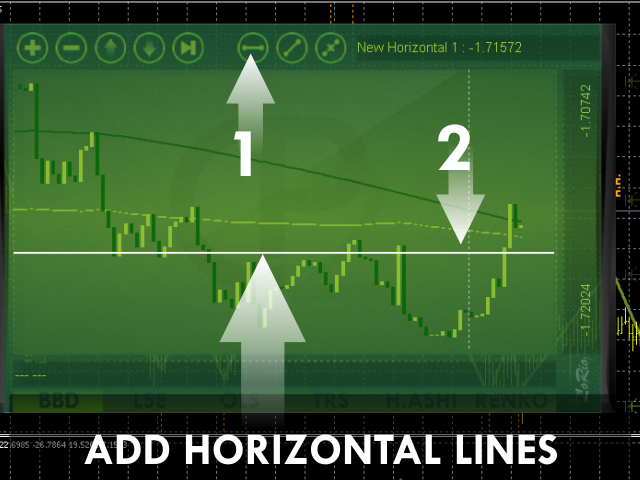
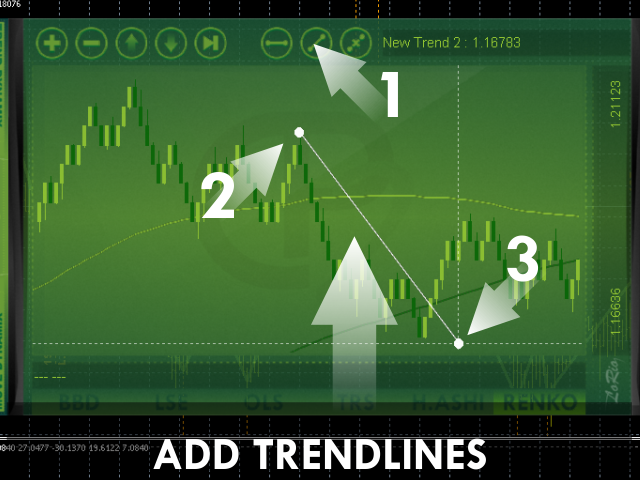
- 还引入了在图表上实时更改投影的能力
该指标不使用:
- AI ,人工智能
- chatGPT ,claude ,deepseek
- 神经网络
- 强化学习
- 遗传算法
- OpenAI


I really like this idea of dynamic trading, great indicator and profitable. I use it on a VPS because my PC is slow and needs cpu. One of the best and not negligible thing that it is free. Thanks to the author