Gap indicator
- 指标
- Makarii Gubaydullin
- 版本: 1.20
- 更新: 12 六月 2021
- 激活: 5
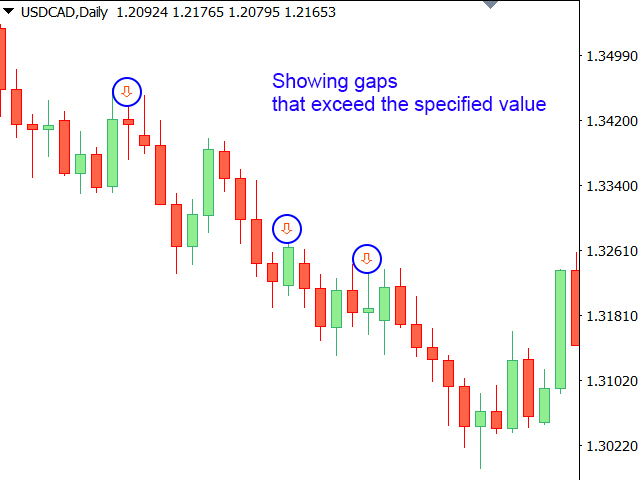
Displays the appearance of a gap on the chart (when the closing price of the previous bar differs from the opening price of the new bar).
My #1 Utility: includes 65+ functions | Contact me if you have any questions
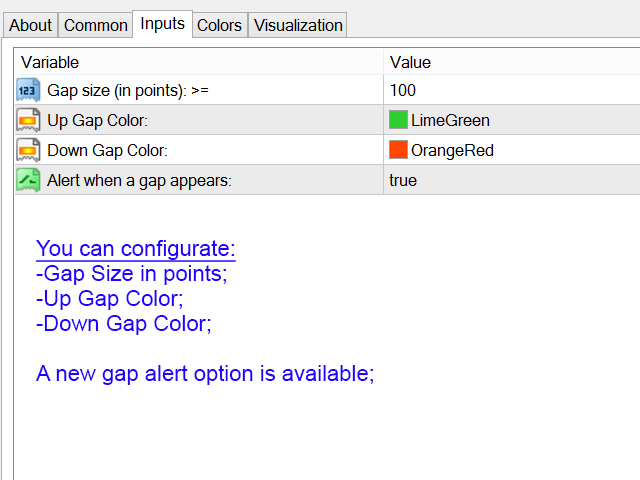
In the initial settings you can configure:
- The size of the gap (in points): only gaps that exceed this value will be displayed.
- Arrow color: separate for up and down gaps.
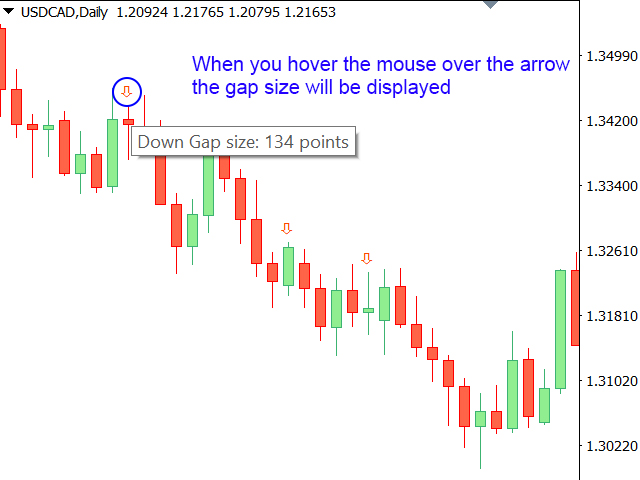
When you hover the mouse over the gap arrows on the chart, their size will be displayed;
I recommend choosing the appropriate gap size for different time frames and currency pairs.