ATR on Chart by XSX
- 指标
- Chatuphon Tangchaiphithak
- 版本: 1.2
- 更新: 24 一月 2021
- 激活: 20
ATR on Chart has been made for anyone wants to easily analyze ATR from Price Chart.
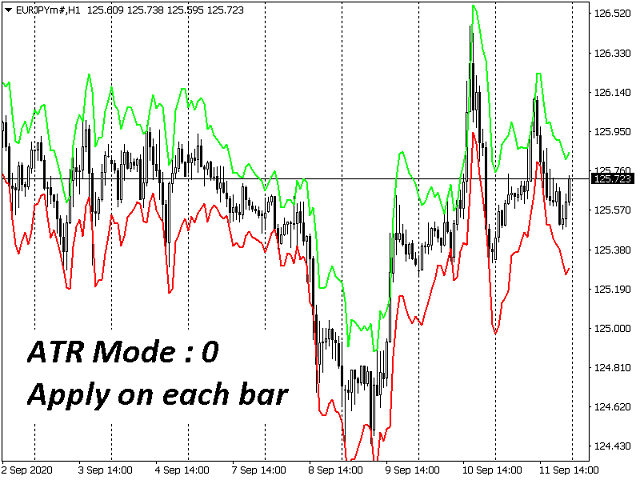
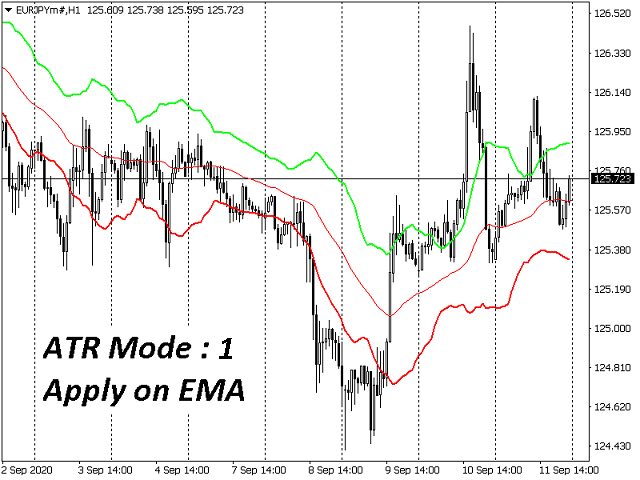
It will show ATR rang and you can apply with each bar or MA.
When price touches the line it means it is trending to that side.
Please be aware that this indicator DOES NOT point out the momentum of trending.
I recommend to use this indicator to find :
https://www.mql5.com/en/market/product/55009
Input description :
- ATRperiod = Setting of ATR period.
- ATRmulti = Multiply value from ATRperiod .
- Mode = see below for detail.
- MA = MA period (Mode 1 Only).
- MAshift = Indicators line offset.
- MAmethod = Moving Average method.
- MAapply = MA will apply to.
This indicator now have 2 mode :
- Mode 0 - ATR will apply on pivot (High+Low/2) of each bar
- Mode 1 - ATR will apply on MA (can be edit MA detail)
PS. Please leave your comments, new ideas, modes or new methods about ATR.
PS.2 Pay once and stay up to date with new features and improvements!


