Chart Local Time
- 指标
- Rider Capital Group
- 版本: 2.63
- 更新: 27 六月 2023
- 激活: 9
Display your Local Time on your charts
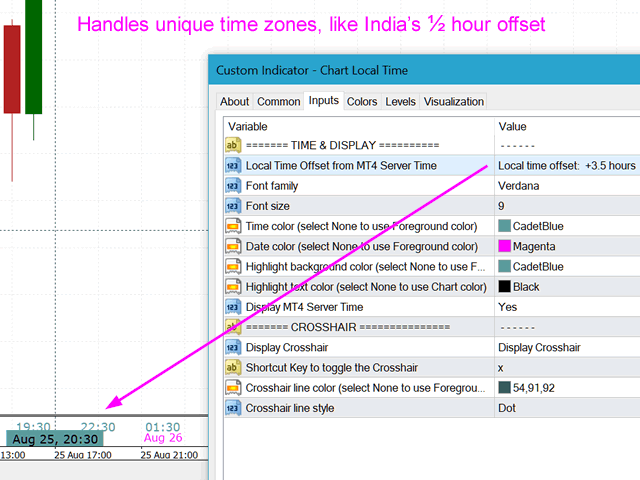
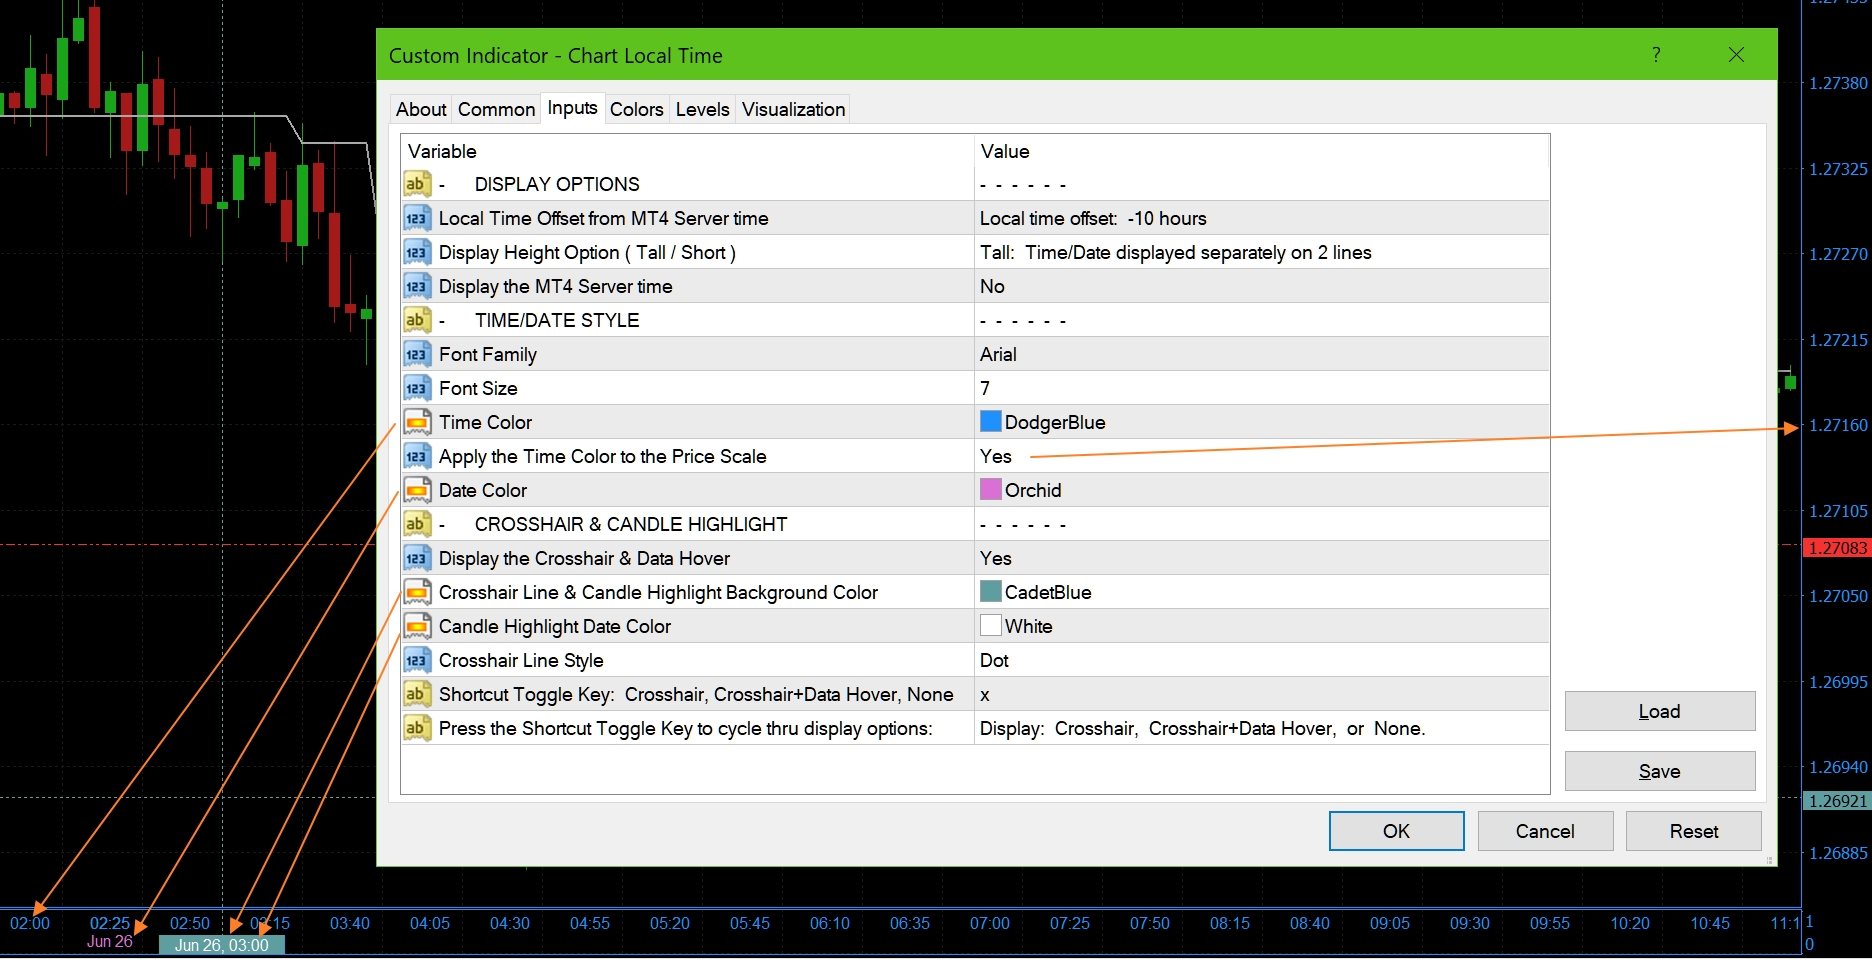
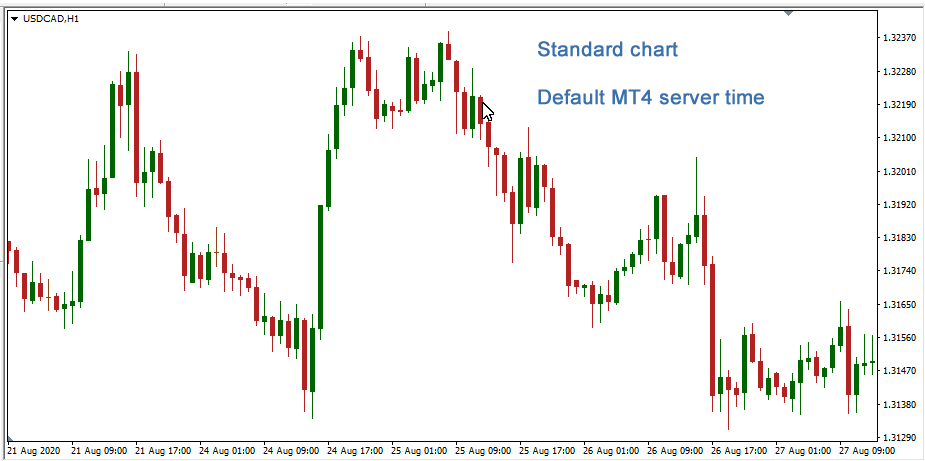
- Display your local time instead of (or along with) MT4 server time.
- Display crosshair which highlights current candle time.
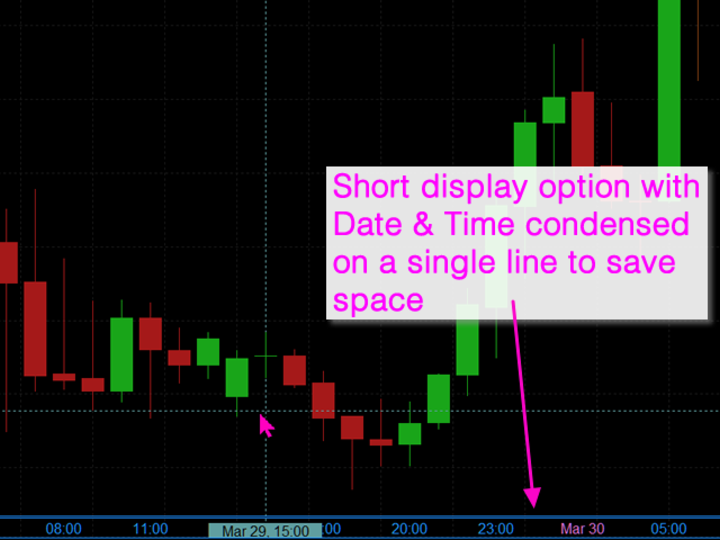
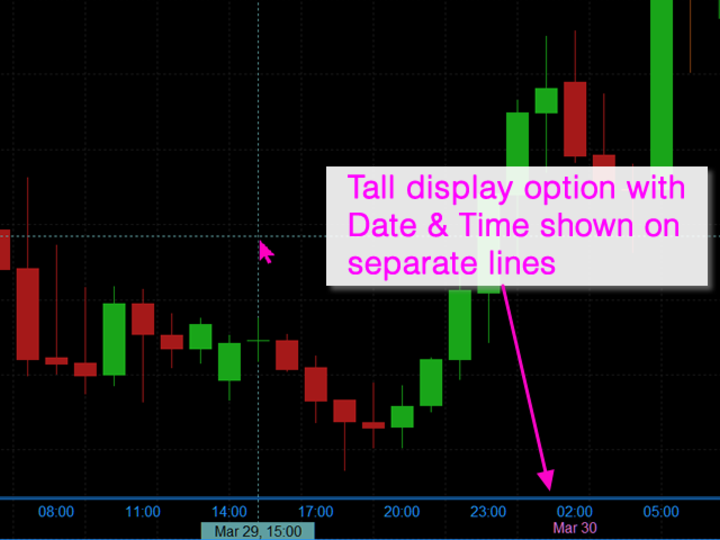
- Automatically adjusts based on chart zoom (zooming in or out).
- Displays on every timeframe (M1 – Month), and auto-adjusts as chart timeframe is changed.
- Handles special ½ hour time zones, such as India.
- Renders fast (no lag) as you scroll charts.
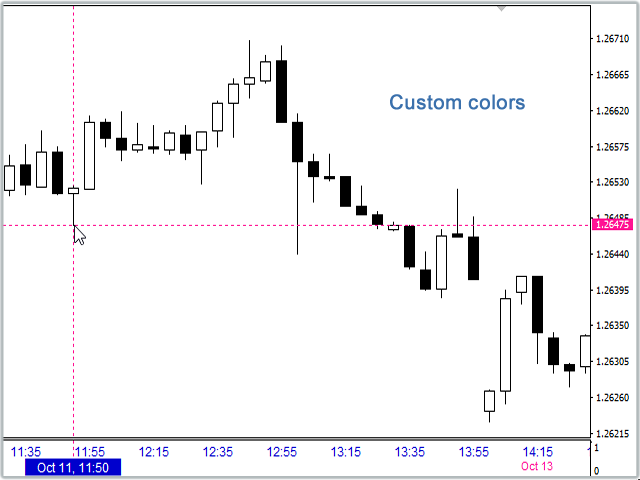
- Customize the font family, font size, background color, and crosshair color.
- Displays clean without overlapping intervals.
- Standard MT4 code, no additional DLLs or fancy install.
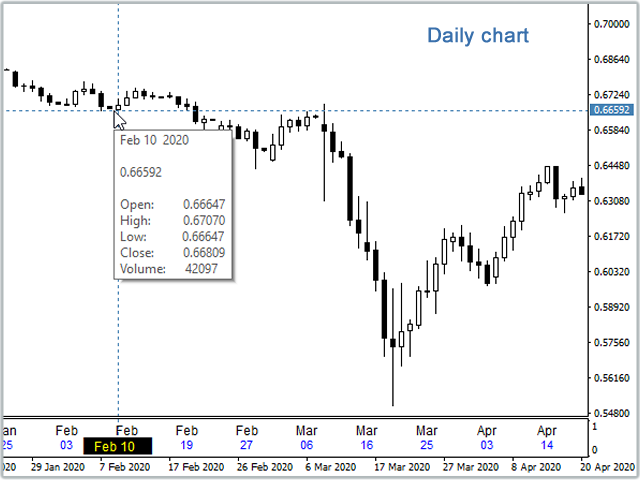
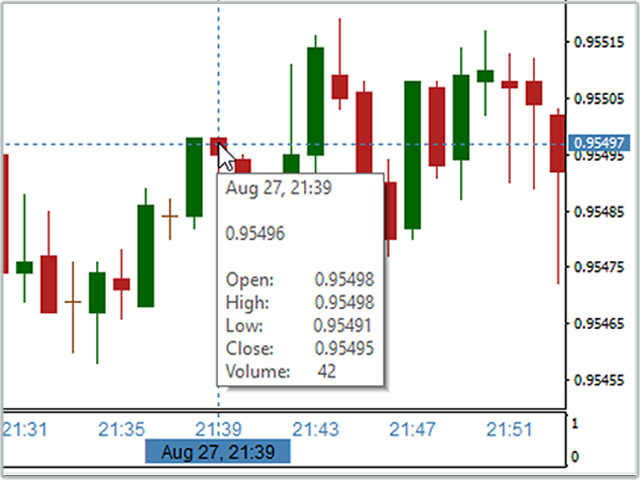
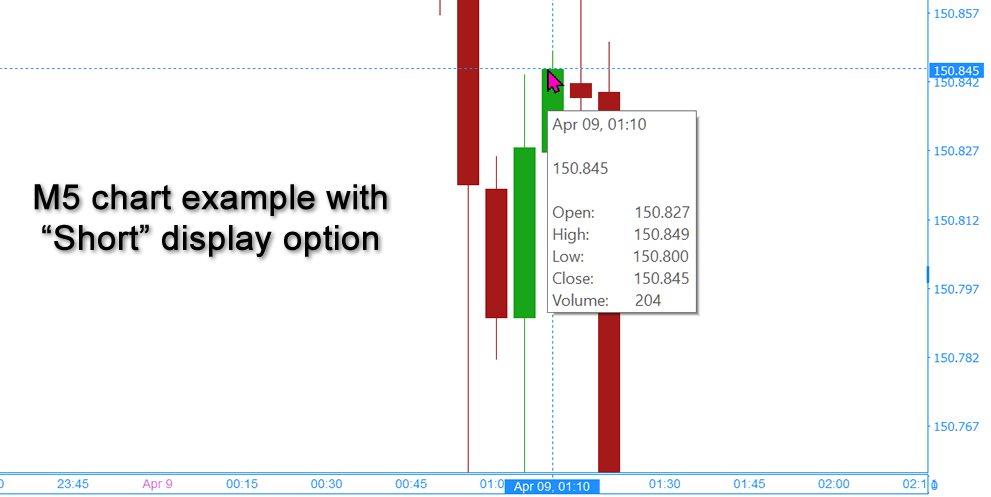
- Display a Data Hover tooltip which shows the current Candle’s:
- Local time
- Price of the mouse pointer
- Candle Open price
- Candle High price
- Candle Low price
- Candle Close price
- Candle volume
- And more! Plus it's super easy to use!
Note: Received reports of interactions / interference with Magic Keys, Forex Trade Manager. Highly recommend you test the Demo version before purchasing.


The tool is very, very valuable for everbody who is not working with the server-time or the NY-time in MT4. They seem to update their product often. The feature to chose between the one-line or two-line-version of the timeline had not even been promoted on the market-site when it was already available in the software. Dan is answering to emails on the same day, latest on the next day. My experience with him has been absolutely flawless.