• 概述
  • 评论
  • 评论
  • 新特性

Price CD HBT

Description

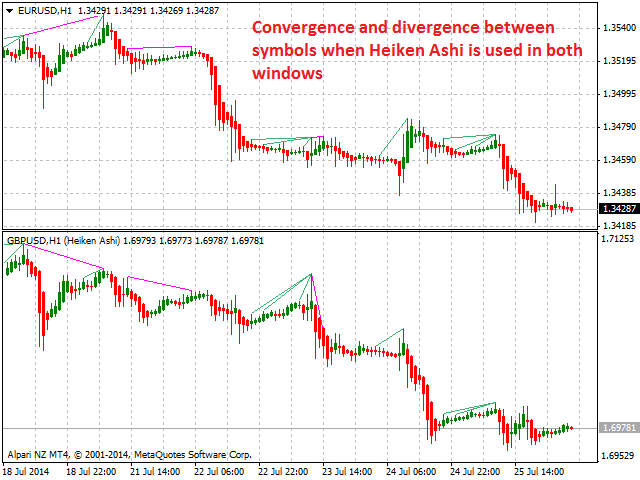
Price CD HBT (Price Convergence/Divergence High Bottom Top) is a innovative universal analytical bears indicator of convergence/divergence between financial instruments. The indicator is the first out of the two possible versions (HBT and HTB) of the bearish convergence/divergence origins.

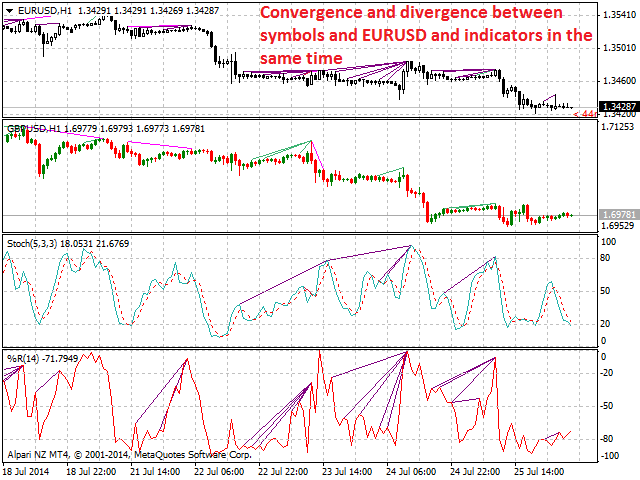
Due to its multiple use feature, the indicator allows you to find convergences/divergences between the price of main financial instrument and other financial instruments simultaneously.

Users can select the sell graphical symbol and its width, as well as the color of convergence/divergence lines.

The indicator may be used with any broker, irrespective of the name of the financial instrument since it is necessary to manually enter the name as an input parameter. If you enter a non-existent or incorrect name of a financial instrument, you will receive an error message that this financial instrument is unknown (does not exist).

The indicator is not a lagging one. It works by ticks and is able to show convergence/divergence in the symbol's window even if there is no separate window with another financial instrument used for search. This allows you to open additional windows with any other indicators for a joint analysis.

As an option, the indicator can notify of a new signal using the graphical sell symbol instead of convergence/divergence lines.

In most cases, convergence/divergence is considered to be confirmed if it takes the form of a line with a graphical symbol remaining on the chart.

Searching of convergence/divergence on one financial instrument means searching of levels of support/resistance!

Attention: Since the indicator is downloaded, graphical symbols are displayed in the main window only after a new convergence/divergence signal appears (unlike convergence/divergence lines). Graphical symbols are not displayed for the past periods (before the indicator was downloaded).

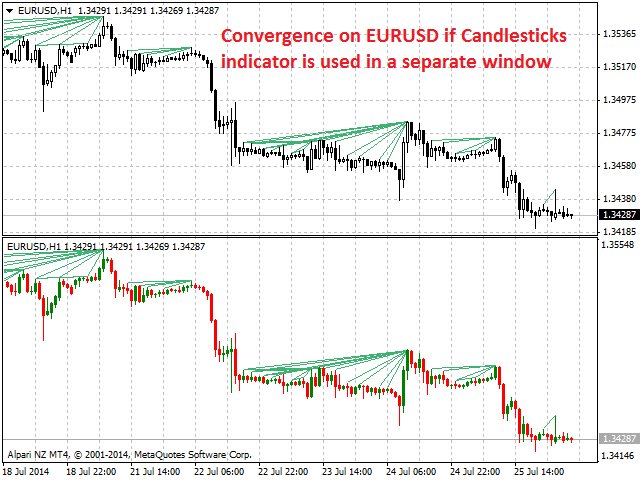
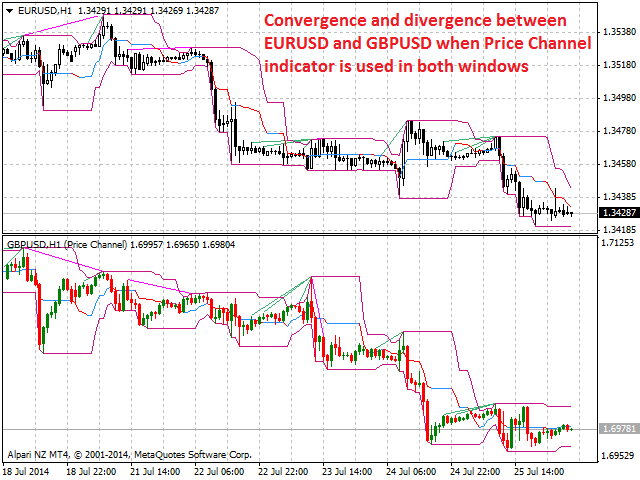
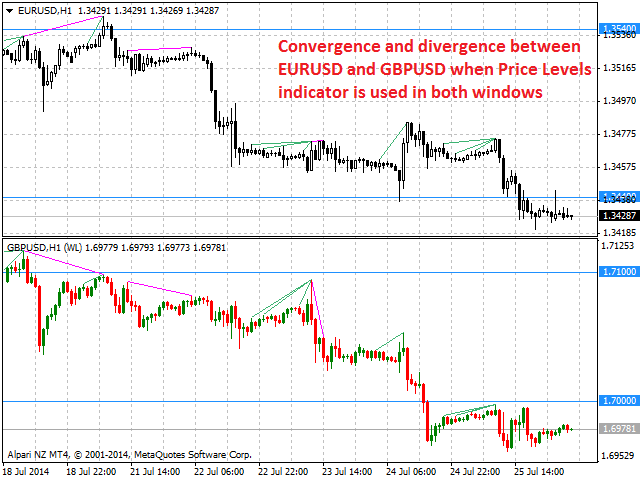
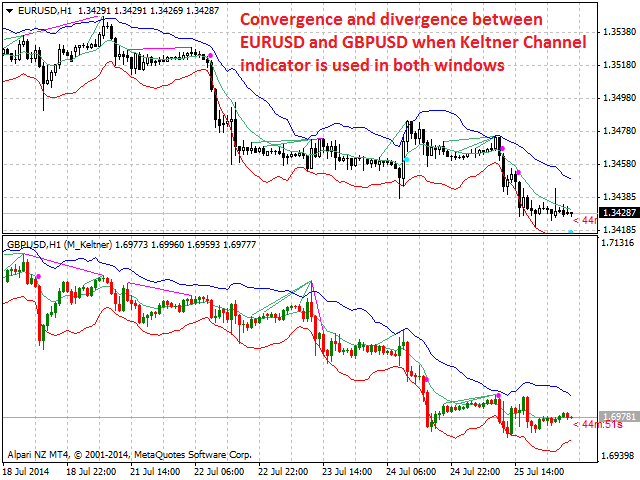
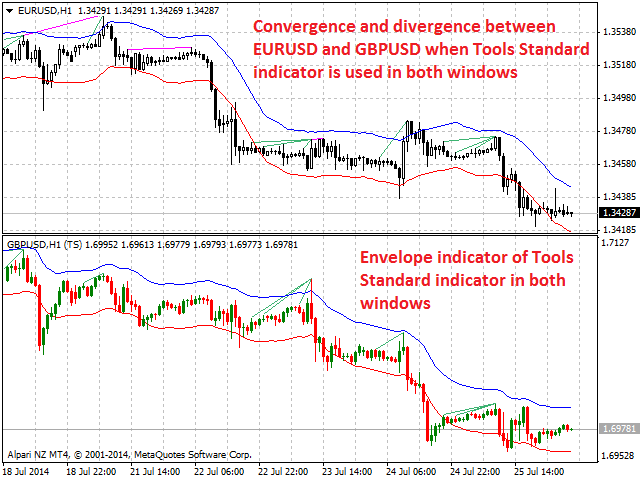
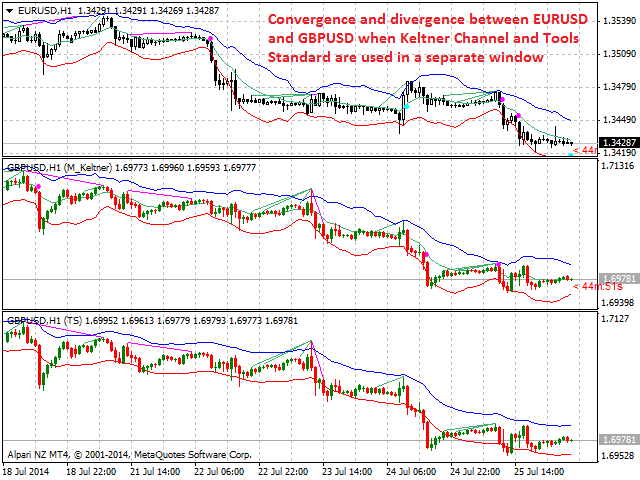
For plotting of lines of convergence/divergence in a separate window the indicator identifies one of any eleven custom indicators (pls. see input parameters) in the presence.

The indicator's operation is displayed in the attached video with sharing of indicators: Bollinger Bands, Fibo Levels, Price Levels.

The indicator can notify of the appearance of a formed signal by playing an audio signal and sending an e-mail, as well as display the time remaining until the end of the formation of the current bar in the format of <d:h:m:s, where:

  • < - the current bar.
  • d - days.
  • h - hours.
  • m - minutes.
  • s - seconds.

Example of the e-mail notification:

  • Subject: Price CD HBT Signal
  • Message: Signal,M1 - Bearish Convergence between EURUSD and EURUSD - 2014.08.06 10:18:00


Purpose

The indicator can be used for manual or automated trading within an Expert Advisor. For automated trading, use the indicator buffer of the double type:

  1. Sell signal - buffer 0, must not be zero.


Input Parameters

  1. Currency_Name - name of financial instrument.
  2. Bars_Number - number of bars for calculation.
  3. Base_Indicator - basic indicator code (the parameter will be activated and used in case of custom indicator presence):
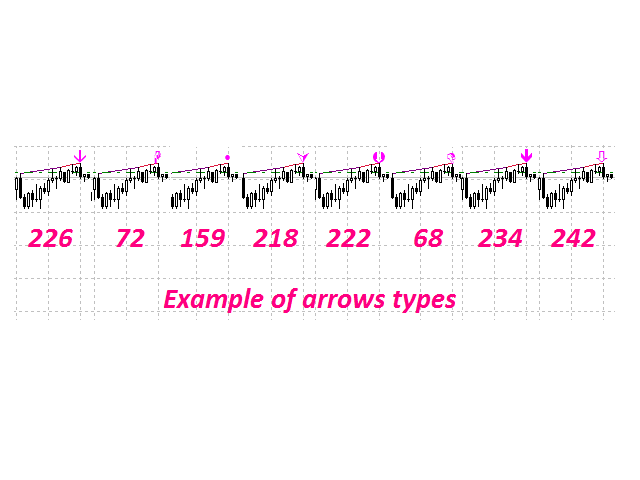
  4. Arrow_Symbol - graphical sell symbol type (recognizes one of the eight user-defined symbols, see the screenshot):
    • 68
    • 72
    • 159
    • 218
    • 222
    • 226 (by default)
    • 234
    • 242
  5. Arrow_Width - graphical symbol width (allowable values - 1, 2, 3, 4 and 5).
  6. Sound_Mail_Numbers - number of sound and e-mail notification on two last bars.
  7. DrawLine - display of convergence/divergence line.
    • true - draw the lines (by default).
    • false - do not draw the lines.
  8. Convergence - calculating convergence or divergence:
    • true - convergence (by default).
    • false - divergence.
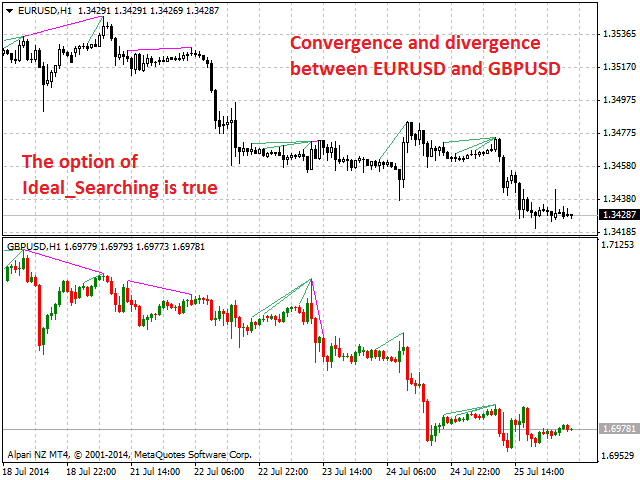
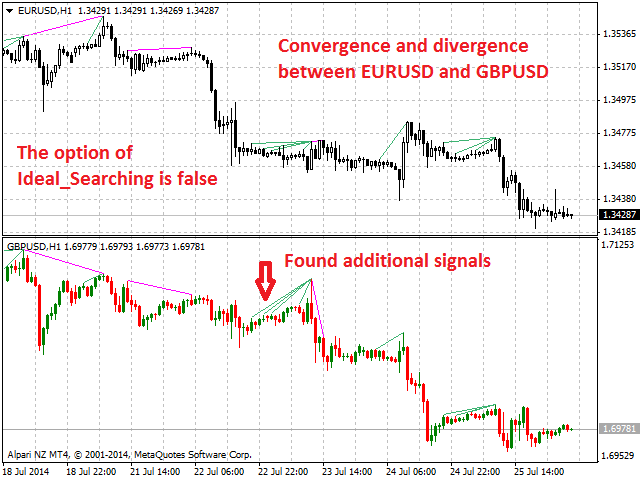
  9. Ideal_Searching - searching convergence/divergence in non-ideal conditions:
    • true - ideal search conditions (by default).
    • false - non-ideal search conditions.
  10. Play_Sound - enable/disable sound notification.
  11. Show_Time - displaying time remaining until the formation of the current bar.
  12. Send_Mail - enable/disable e-mail notification.
  13. ConvLevelColor_1 - color of the convergence line in the main window.
  14. ConvLevelColor_2 - color of the convergence line in the additional indicator window.
  15. DivLevelColor_1 - color of the divergence line in the main window.
  16. DivLevelColor_2 - color of the divergence line in the additional indicator window.


Recommendations

Except above-mentioned basic indicators for confirmation of force of a signal of the indicator, and also definition of a financial instrument for open/close position, the indicator is recommended to be used together with any other analytical tools, for example such as: Reversal Bars, Inside Bar, Long and Short Candlesticks, Main Candlesticks, Impulse System, Bearish Convergence/Divergence HBT, Bearish Convergence/Divergence HTB, Bollinger Bands and others.
Before operation of the indicator updating of historical data on financial instruments is necessary!
推荐产品
Description Price CD HTB (Price Convergence/Divergence High Top Bottom) is a innovative universal analytical bears indicator of convergence/divergence between financial instruments. The indicator is the first out of the two possible versions (HBT and HTB) of the bearish convergence/divergence origins. Due to its multiple use feature, the indicator allows you to find convergences/divergences between the price of main financial instrument and other financial instruments simultaneously. Users can s
Description Price CD LTB (Price Convergence/Divergence Low Top Bottom) is a innovative universal analytical bulls indicator of convergence/divergence between financial instruments. The indicator is the second out of the two possible versions (LBT and LTB) of the bullish convergence/divergence origins. Due to its multiple use feature, the indicator allows you to find convergences/divergences between the price of main financial instrument and other financial instruments simultaneously. Users can s
Description Price CD LBT (Price Convergence/Divergence Low Bottom Top) is a innovative universal analytical bulls indicator of convergence/divergence between financial instruments. The indicator is the first out of the two possible versions (LBT and LTB) of the bullish convergence/divergence origins. Due to its multiple use feature, the indicator allows you to find convergences/divergences between the price of main financial instrument and other financial instruments simultaneously. Users can se
Bears CD HTB Global  (Bears Convergence/Divergence High Top Bottom Global) is an analytical bears convergence/divergence indicator (C, D or CD) between a financial instrument and 22 MT4 indicators working on all periods simultaneously. The indicator measures the power of CD for indicators and periods and is the second one out of the two possible versions (HBT and HTB). Features The analyzer is not a lagging one. It works by ticks and is able to show CD in the main window even in case the MT4 i
Bulls CD LBT Global  (Bulls Convergence/Divergence Low Bottom  Top   Global) is an analytical bulls convergence/divergence indicator (C, D or CD) between a financial instrument and 22 MT4 indicators working on all periods simultaneously. The indicator measures the power of CD for indicators and periods and is the first one out of the two possible versions (LBT and LTB). Features The analyzer is not a lagging one. It works by ticks and is able to show CD in the main window even in case the MT4
This product is a part of  ON Trade Waves Patterns Harmonic Elliot Wolfe you can test free version on EURJPY from this link  Wolf Waves Indicator 探索 Wolf Waves - 您的终极交易工具! 您是否正在寻找一种强大的工具,能够轻松地在任何时间框架上识别 Wolf Waves?不用再找了!我们的 Wolf Waves 指标可以轻松完成这项任务。以下是为您呈现它的理由: 主要特点: 自动检测: 我们的 Wolf Waves 指标使用复杂的算法自动查找关键点并在您的图表上绘制相应的线条。不再需要手动搜索模式。 用户友好: 无论您是专业交易员还是对 Wolf Waves 还不熟悉,我们的指标都非常易于使用。 精准性: 它非常精确,降低了虚假信号的数量,提高了您的信心。 信息丰富: 该指标不仅限于模式检测。它还提供入场点、止损水平和利润目标等重要交易信息,帮助您做出明智的交易决策。 适用于 EA: 如果您进行自动化交易,此指标可以无缝集成
The indicator detects and displays Shark harmonic pattern (see the screenshot). The pattern is plotted by the extreme values of the ZigZag indicator (included in the resources, no need to install). After detecting the pattern, the indicator notifies of that by a pop-up window, a mobile notification and an email. The indicator highlights the process of the pattern formation and not just the complete pattern. In the former case, it is displayed in the contour triangles. After the pattern is comple
The Revolution Target Achiever FT -  Auto_Setting 1000 Points  Hi all Investors and traders, We've just updated this EA to a new version 3.0, which has a much more benefits , for Investors who want to run this EA 24 hours using vps can try the Auto_Setting to achieved 1000 Points or 10 %, for traders who have their own set up and target 1-100% can use the manual_setting, THE REVOLUTION Target Achiever is suitable for the investor who want to have a simple and ready to use Expert Advisor (EA). Th
Description  Fibo Levels  is an indicator that automatically plots  Fibonacci  levels. The levels are calculated and plotted    over a certain interval using the number of bars specified by the user . When the price achieve one of the target levels (23.6%, 38.2%, 50% or 61.8%) the indicator at the request of the user gives a sound signal and/or sends the message by e-mail. Example of the e-mail notification: Subject:  Fibo Up Signal Message:  Signal,H1 - Correction of EURUSD reached 23.6% - 2014
MACDivergence MTF
Pavel Zamoshnikov
4.29 (7)
Advanced ideas of the popular MACD indicator: It detects and displays classic and reverse divergences (three methods of detecting divergences). It uses different color to highlight an uptrend and a downtrend. Two methods of determining a trend: а) MACD crosses the 0 level (classic signal); б) MACD crosses its own average (early signal). This is a multi-timeframe indicator: it can display MACD data from other timeframes. Two methods of drawing: classic histogram and line. It generates sound and v
Trend Catcher with Alert
Issam Kassas
4.72 (53)
趋势捕捉器: 具有警示指标的趋势捕捉器策略是一种多功能的技术分析工具,可帮助交易员识别市场趋势和潜在的进出点。它采用动态趋势捕捉器策略,根据市场条件进行调整,清晰地呈现趋势方向。交易员可以自定义参数,以符合其偏好和风险容忍度。该指标有助于识别趋势,发出潜在的反转信号,充当跟踪止损机制,并提供实时警报,以便及时应对市场。 具有警示指标的趋势捕捉器策略是一种多功能的技术分析工具,可帮助交易员识别市场趋势和潜在的进出点。它采用动态趋势捕捉器策略,根据市场条件进行调整,清晰地呈现趋势方向。交易员可以自定义参数,以符合其偏好和风险容忍度。该指标有助于识别趋势,发出潜在的反转信号,充当跟踪止损机制,并提供实时警报,以便及时应对市场。 特点: 趋势识别:信号牛市趋势和熊市趋势。 趋势反转:当蜡烛颜色从牛市变为熊市,反之亦然时,提醒可能的反转。 实时警报:为新趋势识别生成警报。 建议: 货币和货币对:EURUSD,AUDUSD,XAUUSD... 时间框架:H1。 账户类型:任何ECN,低点差账户。
FREE
OP CD HBT (Opposite Prices Convergence/Divergence High Bottom Top) is an indicator of convergence/divergence of the bearish sentiment among the mirrored financial instruments. The indicator is the first out of the two possible versions (HBT and HTB) of the bearish convergence/divergence origins. Multiple use of the indicator allows you to find convergences/divergences between the price of the main financial instrument and any other financial instruments simultaneously. Users can select the sell
这种用于从无穷远衡量货币强弱的创新指标是长期交易的黄牛和交易者不可或缺的助手。 分析货币强弱的系统早已被世界领先的交易者所熟知并在市场上使用。 没有这种分析,任何套利交易都是不完整的。 我们的指标很容易确定基础货币相对于彼此的强弱。 它显示所有或当前货币对的折线图,允许即时分析和搜索最强的入口点。 该指标直观,允许您快速找到并切换到任何一对,具有可放置在地下室和主图表上的移动面板。 通知货币强度变化的计时器模式使交易者有机会在手机上收到通知。  使用货币功率计无穷大指示器的几种策略: 1. 使用货币强度的线性显示图表搜索交叉点作为新兴趋势的信号 2. 在趋势反转信号出现后,向强势货币方向反弹 3. 使用货币强度发散分析扭转当前趋势 4. 使用其他无限指标向强势货币方向交易 
Free automatic fibonacci
Tonny Obare
4.66 (47)
Free automatic Fibonacci is an indicator that automatically plots a Fibonacci retracement based on the number of bars you select on the BarsToScan setting in the indicator. The Fibonacci is automatically updated in real time as new highest and lowest values appears amongst the selected bars. You can select which level values to be displayed in the indicator settings. You can also select the color of the levels thus enabling the trader to be able to attach the indicator several times with differe
FREE
VR Cub
Vladimir Pastushak
VR Cub 这是获得高质量切入点的指标。该指标的开发是为了促进数学计算并简化对仓位入场点的搜索。多年来,该指标所针对的交易策略已被证明其有效性。交易策略的简单性是其巨大的优势,即使是新手交易者也能成功进行交易。 VR Cub 计算开仓点以及获利和止损目标水平,这显着提高了效率和易用性。查看使用以下策略进行交易的屏幕截图,了解简单的交易规则。 设置、设置文件、演示版本、说明、问题解决,可以从以下位置获取 [博客] 您可以在以下位置阅读或撰写评论 [关联] 版本为 [MetaTrader 5] 计算入场点的规则 开仓 要计算入场点,您需要将 VR Cub 工具从最后一个高点拉伸到最后一个低点。 如果第一个点在时间上早于第二个点,交易者等待柱线收于中线上方。 如果第一个点在时间上晚于第二个点,交易者等待柱线收于中线下方。 根据上述条件,严格在 柱线收盘 后建仓。 换句话说,如果我们在小时图上进行交易,那么从最高点到最低点的时间距离必须超过24小时,最高点和最低点之间的点数必须大于或等于平均价格变动每天。 维持和改变市场地位 可以有多个未平仓头寸;每个头寸都可以单独修改。 VR Cu
This is a new strategy for SUPPLY DEMAND areas It is based on a calculation using the tick volume to detect the big price action in market for both bear /bull actions this smart volume action candles are used to determine the supply and demand areas prices in between main supply and demand lines indicate sideway market  up arrows will be shown when prices moves above the main supply and the secondary supply lines Down arrows will be shown when prices moves below the main demand and the secondary
Like you when I first started trading, It was overwhelming...learning about indicators, about lotsize, leverage and many more things. Its been almost 3 years. I am more knowledgeable in trading. My trading continues to improve as I work on my strategy, technical analysis, trading psychology and trade management. One thing I am not worried about though is being able to close my trades quicky if a trade goes against me or if the trade has reached my take profit level with the help of my Close Tr
Royal Dutch Skunk
Sayan Vandenhout
ROYAL DUTCH SKUNK USES THE TREND WAVE INDICATOR AND IT CAN IDENTIFY THE BEGINNING AND THE END OF A NEW WAVE TREND MOVEMENT. AS AN OSCILLATOR, THE INDICATOR IDENTIFIES THE OVERBOUGHT AND OVERSOLD ZONES. IT WORKS GREAT TO CATCH THE SHORT TERM PRICE REVERSALS AND USES A MARTINGALE STRATEGY TO CLOSE ALL TRADES IN PROFIT. USE DEFAULT SETTINGS ON H1 OR HIGHER TIME FRAME ON ANY PAIR FOR MORE ACCURATE TRADES WHY THIS EA : Smart entries calculated by 6 great strategies The EA can be run on even a $20000
YK Fibo Pivot Indicator
Peechanat Chatsermsak
YK-Fibo Pivot Indicator: Trade Smarter with Fibonacci Pivot Points The YK-Fibo Pivot Indicator is a powerful technical analysis tool that combines the precision of Fibonacci retracements with the insights of Pivot Points. Whether you're a novice or seasoned trader, this indicator empowers you to spot profitable opportunities in the market with ease. Why Choose YK-Fibo Pivot? Pinpoint Support & Resistance: By calculating Fibonacci levels based on the previous day's high, low, and close prices, y
基于具有标准参数的MACD指标波 在最后两个MACD波上分别对正面和负面交易斐波纳契水平, 如果负波浪在MACD指标上结束,则颜色为绿色, 如果正波在MACD指标上结束,那么颜色为红色。 Wave的终止标准是两个滴答,MACD的符号不同。 在最近四次MACD波浪中绘制趋势线。 与专家合作很好  Figures MACD   https://www.mql5.com/ru/market/product/42031 更多截图: https://www.mql5.com/ru/charts/10581596/audusd-h1-alpari-international https://www.mql5.com/ru/charts/10631979/usdjpy-m1-alpari-international https://www.mql5.com/ru/charts/10628704/gbpusd-m15-alpari-international
TD Sequential EA
George Njau Ngugi
Overview The TD Sequential EA is a sophisticated automated trading system designed to capitalize on the TD Sequential indicator, developed by Tom DeMark. This EA identifies trading opportunities based on TD Sequential setups and executes trades with predefined risk management parameters. It offers a clean and customizable chart appearance and allows users to set their own lot sizes and other trading parameters. Key Features Automated Trading : Executes buy and sell orders based on TD Sequential
Fibonacci retracements can be used to draw support lines, identify resistance levels, place stop-loss orders and set target prices. The Advanced Automatic Fibonacci retracements draws automatically all the levels. You have a lot of options to choose. For exemple you can use the tracements of another time frame (MTF) in the current chart, you can also choose between the closest level or less close to draw the retracements. You can also add 2 levels of your choice. You can add levels extensions o
Meta Sniper
Samir Tabarcia
Requirements Optimized to work with   EURUSD-EURCHF-USDJPY, AUDUSD-CADJPY-AUDNZD, CHFJPY-NZDJPY-NZDUSD For timeframe 4H. *(Minimum recommended deposit is $300 for each Pair) for initial lot set to 0.10, My favorite Pair are (CHFJPY-NZDJPY-EURUSD-AUDNZD-USDJPY) Warning it will be SALE only 5 Copys at 60$ Then it will be update up to 200$  You can use it the way it is, For new Set Files will be add on (Comments) ECN broker with low spread is recommended to get better results. Setup is
PZ Penta O MT4
PZ TRADING SLU
The Penta-O is a 6-point retracement harmonacci pattern which usually precedes big market movements. Penta-O patterns can expand and repaint quite a bit. To make things easier this indicator implements a twist: it waits for a donchian breakout in the right direction before signaling the trade. The end result is an otherwise repainting indicator with a very reliable trading signal. The donchian breakout period is entered as an input. [ Installation Guide | Update Guide | Troubleshooting | FAQ | A
Dark Eagle
Gianluca Guarino
DARK EAGLE is ready to use, you don't have to change any parameters because it is already optimized in the best way. Currency pair : NZDCAD . Timeframe:   M15. Minimum account balance:  500$. Broker: It's preferable to use an ECN account. Type of System: Trend-Following. ----------Settings--------- Lot Sizing: Lot Sizing method ( Fixed Lot or Based on Balance ) . Fixed lot  : Set manually the open lot size. Based on Balance (LotSize/Balance Step):  Automatic balance lot sizing based on balance
Wave Wolf MT4
Andrei Salanevich
Wave Wold MT4外汇指标旨在搜索狼波并将其显示在交易终端的当前窗口中。 对于在交易中使用狼波的交易者来说,这是一个很好的指标。 它在交易策略中的应用将显着提高其效率和盈利能力。 有关指标的信息 与其他Wolf wave指标不同,Wave Wold MT4外汇指标具有许多显着提高其有效性的功能: 第一个是打开的Windows5point参数(真值)提供信息支持,即扩展了狼波出现在其上的图表的窗口。 例如,如果EURUSD、AUDUSD和GBPUSD图表是开放的,并且每个图表都安装了Wave WOLD MT4指标,那么如果检测到欧元模型,相应的图表将自动被带到其他图表的顶部,这在交易大量工具时变得非常方便。  第二个功能是MACD上的内置发散分析,用户可以自己选择参数(默认设置(12,26,9))。 顺便说一下,通常振荡器的值不显示在工作窗口上,只反映在形成点(5)时的价格标签的颜色上,特别是,如果标签的颜色是蓝色,则没有发散,如果颜色是红 如何使用指标 Wave WOLD MT4指标显示第4个形成点的假设Wolf模型和第5个点的形成区域(所谓的甜区,以黄色显示)。
Classic Fractals indicator for MT4, with additional Trendlines connecting the latest couples of fractals ( fractals are showing highest high, and lowest low on each period) Rules for trendlines: -if new top fractal is below the last one = new resistance line -if new bot fractal is above the last one = new support line -Trendlines can be hidden -Fractals can be hidden Fractal Period = can be both even or uneven number, as it is setting for half (one side) of the bars sequence
Super Reversal Pattern
Parfait Mujinga Ndalika
Super Reversal Pattern Indicator Unlock the power of advanced pattern recognition with our Super Reversal Pattern Indicator. Designed for traders seeking precision and reliability, this indicator identifies one of the most effective reversal patterns in technical analysis, offering a significant edge in your trading strategy. Key Features: Non-Repainting Accuracy: Enjoy the confidence of non-repainting technology. Once a Super Reversal Pattern is detected, it remains static, providing consis
Introducing the Consecutive Green/Red Candle Alert Indicator for MT4 - Your Trend Spotting Companion! Are you ready to take your trading to the next level? We present the Consecutive Green/Red Candle Alert Indicator, a powerful tool designed to help you spot trends and potential reversals with ease. Whether you're a new trader looking for clarity in the market or an experienced pro seeking additional confirmation, this indicator is your trusted companion. Key Features of the Consecutive Green/Re
FREE
Trend Trading
Igor Semyonov
4 (1)
Description Trend Trading is an innovative analyzer designed for trend following trading. The analyzer consists of a trend line, colored bars, arrow pointers and reference information. After completion of the current bar, the trend line, the color of the bar and the arrow pointers are not redrawn. Change of market sentiment can be calculated based on one of the fourteen basic indicators included in the standard package of MT4, it affects the color of the trend line. Optionally colored bars, arro
该产品的买家也购买
Trade Assistant MT4
Evgeniy Kravchenko
4.43 (180)
它有助于计算每笔交易的风险,容易安装新的订单,具有部分关闭功能的订单管理, 7 种类型的追踪止损和其他有用的功能。 注意,该应用程序在策略测试器中不起作用。 Manual, Description, Download demo 线条功能  - 在图表上显示开仓线、止损线、止盈线。 有了这个功能,就可以很容易地设置一个新的订单,并在开仓前看到它的附加特性。   风险管理  - 风险计算功能在考虑到设定的风险和止损单的大小的情况下,计算新订单的成交量。它允许你设置任何大小的止损,同时观察设定的风险。 批量计算按钮 - 启用 / 禁用风险计算。 在 " 风险 " 一栏中设置必要的风险值,从 0 到 100 的百分比或存款的货币。 在 " 设置 " 选项卡上选择风险计算的变量: $ 货币, % 余额, % 资产, % 自由保证金, % 自定义, %AB 前一天, %AB 前一周, %AB 前一个月。   R/TP 和 R/SL - 设置止盈和止损的关系。 这允许你设置相对于损失的利润大小。 例如, 1 : 1 - 这决定了 TP = SL 的大小。 2 : 1 - 这意味着 TP 是
您认为在价格可以瞬间变化的市场中,下单应该尽可能简单吗? 在 Metatrader 中,每次您要开单时,您都必须打开一个窗口,您可以在其中输入开盘价、止损和止盈以及交易规模。 在金融市场交易中,资本管理对于维持您的初始存款并使其倍增至关重要。 因此,当您想下订单时,您可能想知道应该开多大的交易? 在这单笔交易中,您应该承担多少百分比的存款? 您可以从这笔交易中获利多少,利润风险比是多少? 在您设置交易规模之前,您需要进行必要的计算,以获得交易规模应该是多少的问题的答案。 想象一下,您有一个工具可以自动完成所有这些工作。 您打开图表,进行市场分析并用水平线标记入场点、防御点(止损)和目标(止盈),最后您定义风险水平,例如 作为可用资本的百分比,您可以在此交易中承担,此时程序提供: 定义风险和止损规模的可接受交易规模 以点数、点数和账户货币计的止损和获利值 风险回报率 现在剩下的就是点击面板上的相应按钮来打开交易。 如果您是黄牛,需要在不设置防御或目标的情况下快速打开和关闭交易,那么您可以在交易管理器面板中轻松掌握一切,您可以在其中定义固定订单参数并通过单击“购买”或 “卖出”按钮。 关闭
Local Trade Copier EA MT4
Juvenille Emperor Limited
5 (81)
通过 Local Trade Copier EA MT4 获得非常快速的交易复制体验。它的简单1分钟设置,使您可以在同一台Windows计算机或Windows VPS上在多个MetaTrader终端之间复制交易,具有闪电般快速的复制速度,低于0.5秒。 无论您是初学者还是专业交易者, Local Trade Copier EA MT4 都提供了广泛的选项,可根据您的特定需求进行自定义。对于任何希望增加利润潜力的人来说,这都是终极解决方案。 今天就尝试一下,看看为什么它是市场上最快、最简单的贸易复印机! 提示: 您可以在您的模拟账户中下载并试用 Local Trade Copier EA MT4 模拟版: 这里 将下载的免费演示文件粘贴到您的 MT4 >> 文件 >> 打开数据文件夹 >> MQL4 >> 专家文件夹并重新启动您的终端。  免费演示版本每次可在 4 小时内发挥全部功能,仅限演示帐户。 要重置试用期,请转至 MT4 >> 工具 >> 全局变量 >> Control + A >> 删除。 请仅在非关键模拟账户上执行此操作,不要在挑战道具公司账户中执行此操作。 Local
Exp COPYLOT CLIENT for MT4
Vladislav Andruschenko
4.7 (61)
MetaTrader 4 的交易复制器。     它从任何账户复制外汇交易、头寸、订单。 它是最好的贸易复印机之一     MT4 - MT4,MT5 - MT4     为了   复制 MT4     版本(或     MT4 - MT5 MT5 - MT5     为了   复制MT5     版本)。 MT5版本 详细描述   +DEMO +PDF 如何购买 如何安装     如何获取日志文件     如何测试和优化     Expforex 的所有产品 复印机 版本       MetaTrader 5 终端 (   МТ5 - МТ5, МТ4 - МТ5   )-   Copylot 客户端 MT5 独特的复制算法将所有交易从主账户准确复制到您的客户账户。 该产品还以其高运行速度而著称,并且具有强大的错误处理能力。 一组强大的功能。 该程序可以在多个终端绑定上运行。 使用它作为您在一个账户上交易的多个账户的交易 的同步器 , - COPYLOT 会将您的交易复制到其他终端。 从已关闭的账户中复制 Invest 密码; 部分关闭仅从 mt4 到 mt4
Trade Dashboard MT4
Fatemeh Ameri
5 (37)
疲于复杂的订单下达和手动计算?Trade Dashboard 是您的解决方案。凭借其用户友好的界面,订单下达变得轻而易举,只需点击一下,您就可以开设交易、设置止损和止盈水平、管理交易手数,并计算风险回报比,让您只需专注于您的策略。告别手动计算,使用 Trade Dashboard 简化您的交易体验。 立即下载演示版本 。 您可以在这里找到仪表盘功能和特性的详细信息 。 加入 Telegram 频道 。 购买后请给我发消息以获取支持。如果您需要添加更多功能,可以在产品的评论区留下您的想法,我愿意听取任何建议,希望您能在使用我的产品时获得最佳体验 。 这是 MT5 版本。 风险管理:使用 Trade Dashboard,可以将您的风险设置为账户余额或权益的百分比,或将风险设置为总金额。在图表上直观地定义您的止损,让工具准确计算每个货币对的适当手数。该工具还可以根据您期望的风险回报比自动设置止盈水平。它甚至可以在手数计算中涵盖佣金和点差费用。此外,您的止损和止盈可以转变为虚拟水平,隐藏于经纪商。通过 Trade Dashboard 的高级风险管理功能,掌控风险,保护您的资本。
The product will copy all telegram signal to MT4   ( which you are member  ) , also it can work as remote copier.  Easy to set up, copy order instant, can work with almost signal formats, image signal, s upport to translate other language to English Work with all type of channel or group, even channel have "Restrict Saving Content", work with  multi channel, multi MT5 Work as remote copier: with signal have ticket number, it will copy exactly via ticket number. Support to backtest signal. How to
TradePanel MT4
Alfiya Fazylova
4.91 (85)
交易面板是一个多功能的交易助手。 该应用程序包含 50 多个手动交易功能,并允许您自动执行大多数交易操作。 购买之前,您可以在模拟帐户上测试演示版本。 演示 此处 。 完整说明 此处 。 贸易。 让您一键执行基本交易操作: 开立挂单和开仓。 打开订单网格。 平仓挂单和持仓。 仓位反转(平仓买入并开仓卖出,或平仓卖出并开仓买入)。 锁定仓位(通过开立相反仓位使卖出和买入仓位的交易量相等)。 对所有仓位进行部分平仓。 将所有头寸的止盈和/或止损设置为同一水平。 将所有仓位的止损设置为盈亏平衡水平。 开仓订单和仓位时,您可以: 根据既定风险自动计算订单量。 一键打开多个订单。 将计算出的交易量分配给多个订单。 使用面板创建的线条和标记在图表上可视化未来订单的交易水平位置。 开仓时,设置最大点差限制。 使用止盈规模与止损规模的自动比率。 使用虚拟止损和止盈。 将当前点差添加到止损和止盈。 使用 ATR 指标计算止盈和止损。 设置待处理订单的到期日期。 使用挂单跟踪(挂单自动移动到价格后面指定的距离)。 平仓订单和平仓时,您可以: 一键按订单或仓位类型关闭。 只需点击一下,即可仅平仓盈利或无利可
交易管理器可帮助您快速进入和退出交易,同时自动计算风险。 包括帮助您防止过度交易、报复性交易和情绪化交易的功能。 交易可以自动管理,账户绩效指标可以在图表中可视化。 这些功能使该面板成为所有手动交易者的理想选择,并有助于增强 MetaTrader 4 平台。多语言支持。 MT5版本  |  用户指南+演示 交易经理在策略测试器中不起作用。 如需演示,请参阅用户指南 风险管理 根据%或$自动调整风险 可选择使用固定手数或根据交易量和点自动计算手数 使用 RR、点数或价格设置盈亏平衡止损 追踪止损设置 最大每日损失百分比,在达到目标时自动平仓所有交易。 保护账户免遭过多提款并阻止您过度交易 最大每日损失(以美元为单位)在达到目标时自动关闭所有交易。 保护账户免遭过多提款并阻止您过度交易 一键实现所有交易的盈亏平衡 自动计算从手机/电话发送的交易的风险 OCO 在设置中可用 交易和头寸管理 通过设置每月、每周、每天、每小时或每分钟的最大交易次数,停止过度交易和报复性交易。 高级挂单管理。 调整何时关闭挂单的规则 追踪挂单 支持市价订单和挂单 每日最大利润目标(以美元为单位)以确保头寸并停
智能交易副驾驶: 这是一个智能交易助手,可以帮助您日常的交易管理。智能交易副驾驶配备了用户友好的交易面板,具有现代化的设计并采用了尖端技术。 智能交易副驾驶具有多种功能: 1. 风险管理支持:根据指定的风险百分比和止损自动计算适当的手数,帮助交易者有效管理风险。 2. 风险收益比预览:在开仓前显示潜在的利润和亏损,帮助交易者做出更好的决策。 3. 自动手数计算:根据止损和期望的风险自动调整手数,确保一致的风险管理。 4. 全面的订单管理:允许交易者轻松开立、修改和关闭各种类型的订单,包括市价单和挂单。 5. 保本和平仓跟踪止损:包括一键保本和平仓跟踪止损功能,以锁定利润并减少亏损。 6. 隐藏止损/止盈:允许交易者隐藏止损和止盈水平,防止被经纪商“止损猎杀”。 7. 佣金和点差计算:在开仓前提供佣金和点差信息,帮助交易者了解交易成本。 8. 最大点差过滤:当点差过高时,防止开仓,保护交易者免受不利的市场条件影响。 9. 可定制的风险设置:交易者可以选择按余额的百分比或自定义余额承担风险,提供灵活的风险管理方式。 10. 交易备注:允许为交易添加备注,以便更好地跟踪和组织交易记
Unlimited Trade Copier Pro is a tool to copy trade remotely to multiple MT4, MT5 and cTrader accounts at different computers/locations over internet. This is an ideal solution for you if you are a signal provider and want to copy your trades to other receivers globally on your own rules. One provider can copy trades to multiple receivers and one receiver can get trade from multiple providers as well. The provider can even set the subscription expiry for each receiver, so that receiver will not b
Trade copier MT4
Alfiya Fazylova
4.52 (29)
Trade Copier 是一种专业实用程序,旨在复制和同步交易账户之间的交易。 复制发生从供应商的帐户/终端到收件人的帐户/终端,安装在同一台计算机或 vps 上。 在购买之前,您可以在演示帐户上测试演示版本。 演示 这里 。 完整说明 这里 。 主要功能和优点: 支持复制MT4>MT4、MT4>MT5、MT5>MT4,包括МТ5 netting账户。 供应商和收件人模式在同一产品中实现。 简单直观的界面,允许您直接从图表中实时控制复制。 连接中断或终端重新启动时不会丢失设置和位置。 允许您选择要复制的符号,也可以替换接收者的符号,例如 EURUSD> USDJPY。 支持回拷贝。 能够仅复制某些订单。 允许您设置开仓交易价格的最大差异和最大时间延迟。 正确复制部分订单关闭的执行。 计算复制手数的几种方法。 同步止盈和止损。有几种方法可以计算它们的位置。 支持通过执行在“Market account”上工作,其中 SL / TP 仅在开仓后设置。 如何使用简单的设置复制交易 将供应商终端和接收终端安装在同一台计算机或 VPS 上。 在供应商终端上以“Master”模式安装复印机,然后
DrawDown Limiter MT4
Haidar, Lionel Haj Ali
5 (8)
Drawdown Limiter EA You are in the right place if you were searching for Drawdown control, Drawdown limiter, Balance protection, Equity Protection or Daily Drawdown Limit related to Prop Firm, FTMO, or Funded account trading, or if you want to protect your trading account. Have you suffered from controlling your drawdown when trading funded accounts? This EA is meant for you. Prop firms usually set a rule called “Trader Daily Drawdown”, and if it is not respected, you are disqualified.  I am an
控制您的外匯投資組合。立即查看您的站立位置、工作原理以及導致您疼痛的原因! 此處提供 MT5 版本: https://www.mql5.com/en/market/product/58658 交易經理儀表板旨在讓您一目了然地顯示您當前在外匯市場中的每個頭寸,並使風險管理和貨幣敞口更易於理解。 對於通過多個頭寸或交易網格和籃子策略逐漸進入市場的交易者,這是需要查看的關鍵信息。監控終端中的多個位置通常很難管理。 過度槓桿化和使用低風險:回報是新交易者和一些經驗豐富的交易者面臨的主要問題,交易經理向您展示您對每種貨幣的風險敞口,確保您不會同時進行雙向交易。 特徵: 未平倉交易 - 查看您當前按貨幣對排序的所有未平倉交易。您不僅可以在該貨幣對上看到您的方向偏差,還可以在該貨幣對上運行的每筆交易或頭寸上看到您的方向偏差。 回撤和利潤信息 - 立即查看您交易活躍的貨幣對的回撤或盈利情況。輕鬆識別需要管理的交易。 手數大小 - 查看您在每個貨幣對上的手數以及您進行的交易數量。 風險敞口 - 查看您對每種貨幣的方向偏差,以確保您不會在另一個入場時以相反的方向交易。另請查看您在該貨幣中使用
Grid Manual MT4
Alfiya Fazylova
4.72 (18)
Grid Manual是一个交易面板,用于处理订单网格。 该实用程序是通用的,具有灵活的设置和直观的界面。 它不仅可以在亏损方向上设置订单网格,还可以在盈利方向上设置订单网格。 交易者不需要创建和维护订单网格,实用程序会这样做。 打开一个订单就足够了,Grid manual会自动为它创建一个订单网格,并伴随它直到非常关闭。 完整说明和演示版 此處 。 该实用程序的主要特性和功能: 伴隨以任何方式打開的訂單,包括從移動終端打開的訂單。 適用於兩種類型的網格:“限制”和“停止”。 使用兩種方法計算網格間距:固定和動態(基於 ATR 指標)。 允許您更改未結訂單網格的設置。 顯示圖表上每個網格的盈虧平衡水平。 顯示每個網格的利潤率。 允許您一鍵關閉網格中的盈利訂單。 讓您一鍵關閉每個訂單網格。 允許您對訂單網格應用追踪止損功能。 允許您在訂單網格上應用將訂單網格的止損轉移到盈虧平衡水平的功能。 相對於訂單網格的盈虧平衡水平自動重新排列止盈(僅在限價網格模式下,距離取決於所選的計算類型:“保守”或“激進”)。 最多可管理 20 個訂單網格,每個網格最多可包含 100 個訂單。
The News Filter
Leolouiski Gan
5 (20)
这个产品在新闻时间过滤所有的专家顾问和手动图表,因此您不必担心突然的价格波动会破坏您的手动交易设置或其他专家顾问输入的交易。此产品还带有完整的订单管理系统,可在任何新闻发布前处理您的持仓和挂单。一旦您购买了 The News Filter ,您将不再需要依赖以后的专家顾问内置的新闻过滤器,因为这个产品可以从此过滤它们所有。 新闻选择 新闻来源于Forex Factory的经济日历。 选择可以基于任何一种货币,如USD,EUR,GBP,JPY,AUD,CAD,CHF,NZD和CNY等。 选择也可以基于关键识别,例如Non-Farm (NFP),FOMC,CPI等。 能够选择新闻影响级别的筛选,从低、中、到高影响。 自动模式只选择与图表相关的新闻。 新闻来源每小时自动刷新,以确保最新的新闻数据。 为每个新闻影响级别提供单独的输入,以确定您要过滤掉的新闻发布前后的分钟数。 订单管理选项 在新闻发布前关闭未平仓头寸的选项,并在新闻发布后恢复它们。 在新闻发布前删除挂单的选项,并在新闻发布后恢复它们。 在新闻发布前移除止损和止盈水平的选项,并在新闻发布后恢复它们。 在新闻发布前移动止损
MT4 To Telegram Sender
DaneTrades Ltd
3.5 (4)
将完全可定制的信号从 MT4 发送到 Telegram,并成为信号提供商! 该产品采用易于使用且具有视觉吸引力的图形界面。 自定义您的设置并在几分钟内开始使用该产品! 用户指南 + 演示   |   MT4版本 |   不和谐版本 如果您想尝试演示,请参阅用户指南。 MT4 电报发送器在策略测试器中不起作用。 MT4 转 Telegram 功能 通过大量选项根据您的喜好完全定制信号 在信号之前或之后添加您自己的自定义消息。 这可以是标签、链接、频道或其他任何内容 在信号中添加、删除、自定义表情符号。 或者您可以将它们全部删除。 按交易品种或幻数过滤要发送的交易 排除发送特定符号 排除发送特定幻数 自定义与信号一起发送的交易详细信息 发送带有信号的屏幕截图 自定义要发送的信号类型 发送信号性能的每日、每周、每月和自定义时间报告 我总是愿意改进产品,所以如果您有想要看到的功能,请发表评论或给我留言。
发现信号很好,但提供商的信号太小?您需要更大的持仓量,但终端设置太差?信号手数管理器将通过所需交易量的重复订单来增加提供商的头寸交易量。 只需设置手数大小和用于复制订单的信号名称即可。 Signal Lot Manager 是一个批量乘数实用程序,用于在您的终端上复制订单。来源可以选择任何顾问、手动交易、单独的交易信号。它具有广泛的功能、简单的设置以及高速度和可靠性。 Signal Lot Manager 安装和输入指南 如果您想获取有关 EA 的通知,请将我们的 URL 添加到 MT4/MT5 终端(参见屏幕截图)。 MT4版本     https://www.mql5.com/en/market/product/34864 MT5版本     https://www.mql5.com/en/market/product/41610 一般输入: 信号标题:信号的名称(您可以从信号顺序注释中复制它)。 最大限度。滑点:开仓交易可接受的最大滑点。因此,如果当前价格超过最高价格。与信号订单的入场价格相比的滑点距离,交易不会被复制。这对于防止复制交易出现不必要的滑点非常有用,特别是在高
将信号从您所属的任何渠道(包括私人和受限渠道)直接复制到您的 MT4。 该工具在设计时充分考虑了用户的需求,同时提供了管理和监控交易所需的许多功能。 该产品采用易于使用且具有视觉吸引力的图形界面。 自定义您的设置并在几分钟内开始使用该产品! 用户指南 + 演示  |     MT5版本  |     不和谐版本 如果您想尝试演示,请参阅用户指南。 Telegram To MT4 接收器在策略测试器中不起作用! Telegram 至 MT4 功能 一次复制多个通道的信号 从私人和受限频道复制信号 不需要机器人令牌或聊天 ID(如果出于某种原因需要,您仍然可以使用这些) 使用风险百分比或固定手数进行交易 排除特定符号 选择复制所有信号或自定义要复制的信号 配置单词和短语以识别所有信号(默认值应适用于 99% 的信号提供商) 配置时间和日期设置以仅在需要时复制信号 设置一次打开的最大交易量 交易和头寸管理 使用信号或自动设置的管理 通过设置每月、每周、每天、每小时或每分钟的最大交易次数,停止过度交易和报复性交易。 支持市价订单和挂单 每日最大利润目标(以美元为单位)以确保头寸并停止
Exp SafetyLock PRO
Vladislav Andruschenko
4.68 (25)
SAFETYLOCK 允许交易者通过为已开立的头寸设置相反的挂单来避免市场的剧烈逆转。 当交易者或 EA 开仓时,SAFETYLOCK 会立即为该头寸设置一个相反方向的挂单。 如果头寸进入亏损状态,挂单将被激活,形成锁仓保护。 该 EA 还提供多种功能,您可以选择关闭初始头寸、使用追踪止损进行利润保护,或通过增加手数来优化您的交易策略。 此外,您还可以根据市场的波动动态调整挂单的开仓价格,使其随持仓价格变化,灵活应对市场变化。 SAFETYLOCK 为您的交易提供更加稳健的风控支持与灵活性。 详细描述 +DEMO +PDF 如何购买 如何安装     如何获取日志文件     如何测试和优化     Expforex 的所有产品 参数基本(我们博客中对参数的完整描述) MilliSecondsTimerForMonitoring – 算法执行的持续时间,以毫秒为单位(默认是1000 = 1秒)。 SymbolMonitoring – 监控所有账户中的符号和交易。如果在任意货币对图表上启动EA,它将监控所有货币对。 Type_Monitoring – EA应监控的交易类型:买
Take a Break
Eric Emmrich
5 (26)
The most advanced news filter and drawdown limiter on MQL market NEW: Take a Break can be backtested against your account history! Check the " What's new " tab for details. Take a Break has evolved from a once simple news filter to a full-fledged account protection tool. It pauses any other EA during potentially unfavorable market conditions and will continue trading when the noise is over. Typical use cases: Stop trading during news/high volatility (+ close my trades before). Stop trading when
Custom Ultimate Sniper Dashboard
Hispraise Chinedum Abraham
5 (2)
这个自定义终极狙击手仪表盘是原始终极狙击手仪表盘指标的一个EA升级。它与多达98种不同的算法一起工作,以确保它能捕捉到你工作的资产类别上的趋势的真实性质。 它是对我们几个月来从大多数客户那里得到的很多建议和意见的直接回应。   这个自定义版本是完全可定制的。 由98个独立的自定义算法提供。 非常漂亮的视觉界面,因此你可以轻松和自信地跟踪任何货币对或时间框架的整体市场趋势 可以向telegram发送实时警报 允许你根据你所交易的货币对创建自己的指数 可以向你的手机实时发送警报,所以你不必在电脑前就知道有一个动作正在酝酿。 让你从输入设置中设置8个指数 让你设置你想获得警报的指数和时间框架 当检测到没有互联网连接时,会显示警报   自定义终极狙击手仪表盘已经进行了大量的优化,在动作开始后立即显示。这样,你就不会错过你感兴趣的货币对的任何变动。它的速度非常快,可以在移动发生时迅速捕捉到,并实时向你发送警报,这样你就可以利用移动的优势,而不必整天坐在办公桌前。 它是任何交易策略的一个超级补充,你可以将这个工具与任何其他交易策略和指标一起使用。它主要是为了与我们的其他
Riskless Pyramid
Snapdragon Systems Ltd
5 (1)
Introduction This powerful MT4 trade mangement EA offers a way potentially to aggressively multiply trade profits in a riskfree manner. Once a trade has been entered with a defined stoploss and take profit target then the EA will add three pyramid add-on trades in order to increase the overall level of profit. The user sets the total combined profit target to be gained if everything works out. This can be specified either as a multiple of the original trade profit or as a total dollar amount. Fo
跟单->友好的交互界面,丰富的易用功能,追求速度跟单方案.   EASY :加载即用(需选择信号源或接收端),自动读取信号源,面板勾选即可, FAST: 快速复制订单,秒跟订单,0.3秒反应 Multiple:1.支持多个信号同时发送,多账户同时选择多个账户复制                                            2. 多平台支持,MT4 和MT5互通. ( 需同时购买安装MT4和MT5 ) 在此你可以找到市面上没有的功能 . .支持 减仓 ,支持手动 订单绑定 信号订单 上....提供各种 过滤以及指定个性化设置( 给每个信号源或者品种分别制定个性化跟单方案 ) ... [语言支持 中文,英文 ] 增加大手数分单功能 (应用场景,需要跟单较大手数,手数超出平台上限,也可以自己设置的上限,一般应用前者,分单会造成不必要的跟单性能开销,当达到平台单笔手数上限可以分单进行) 增加反向同步平仓功能: 功能启动后 接收端平仓,发送端反向同步平仓. 增加多种跟单内核, ①传统的强映射强绑定方式 ②可以支持设置MAGIC为0 模拟人工开单 ③可以支持默认一种MA
Mentfx Mmanage
Anton Jere Calmes
5 (15)
The added video will show you the full functionality, effectiveness, and simplicity of this trade manager. Drag and Drop Trade Manager. Draw your entry and have the tool calculate the rest. Advanced targeting and close portions of a trade directly available in tool (manage trades while you sleep). Market order or limit order on either side with factored spread. Just draw the entry, the tool does the rest. Hotkey setup to make it simple. Draw where you want to enter, and the stop loss, the tool c
Summer 40% discount ($149 -> $88) Everything for chart Technical Analysis indicator mt4 in one tool Draw your supply demand zone with rectangle and support resistance with trendline and get alerts to mobile phone or email alert -  Risk reward indicator Video tutorials, manuals, DEMO download   here .  Find contacts on my   profile . 1.   Extended rectangles and trendlines Object will be extended to the right edge of the chart when price will draw new candles on chart. This is rectangle extend
MT4 to Discord Signal Provider 是一款用户友好、完全可定制的工具,专为直接向 Discord 发送交易信号而设计。这个工具将您的交易账户转变为一个高效的信号提供者。 自定义消息格式以适应您的风格!为了方便使用,您可以从预先设计的模板中选择,并决定包括或排除哪些消息元素。 [ 演示 ] [ 手册 ] [ MT5 版本 ] [ Telegram 版本 ] 设置 遵循我们详细的 用户指南 进行简单设置。 不需要预先了解 Discord API;我们提供所有必要工具。 主要特性 为订阅者更新自定义订单详情。 实施分层订阅模型,如铜牌、银牌、金牌,每一层都提供不同级别的信号访问。 附加执行订单的图表截图。 在这些截图上显示已关闭的订单,以增加清晰度。 提供延迟发送新订单消息的选项,以便在发送前进行最后调整。 透明和详细的订单信息: 带截图的新市场订单。 订单修改(止损、获利)。 已关闭和部分关闭的订单。 新的和修改的挂起订单。 挂起订单的激活和删除。 关于历史订单的详细报告。 每个订单的可定制评论。 注意: * 截图包括图表上的任何对象,如指标。 ** 在报
CloseIfProfitorLoss with Trailing
Vladislav Andruschenko
4.86 (28)
在 MetaTrader 4 中使用利润跟踪功能在达到总利润/亏损时平仓。 您可以启用 虚拟停止(单独订单)   , 分别计算和平仓 买入和卖出头寸 (Separate BUY SELL)   , 关闭和计算 所有交易品种或仅当前交易品种(所有交易品种)   , 启用追踪获利( 追踪 利润) 关闭存款货币、点数、余额百分比的总损益。 该应用程序旨在与任何其他 EA 一起用于任何账户或与手动交易结合使用。 MT5 版本 详细描述   +DEMO +PDF 如何购买 如何安装     如何获取日志文件     如何测试和优化     Expforex 的所有产品 一旦某些货币对或所有货币对的交易总余额大于或等于设置中指定的值,所有头寸将被关闭并删除订单。 此版本不仅能够在指定的利润水平平仓,而且还可以追踪利润以获得更好的结果。 我们实用程序的主要功能 按所有交易品种的总利润平仓; 按单独交易的总利润结算。 (虚拟模式); 按总利润结算并追踪利润; 按总利润以点数、百分比或货币结算; 所有交易或单独交易均以总亏损结束; 关闭交易后关闭图表和终端、风险管理器、包含关闭信息的邮件
For more info join to http://discord.io/reitakfx where you can get info how to set, how to trade or for your questions -------------------------------- If you want this panel and all my other products for FREE , create account here http://bit.ly/reitakfxroboforex and then write me and I will send you all my actual and future product for FREE + VIP on my  DISCORD   -------------------------------------- Set in panel what margin will use to trade. When you ready to trade, just click to buy or se
News Dashboard MT4
Taras Slobodyanik
4.43 (7)
该仪表板显示来自三个来源的当前新闻:来自 ForexFactory.com 网站(FFC 日历)、来自 Investing.com 网站和来自 mql5.com 的经济日历。 您可以按影响力和国家对新闻进行排序,并一键将其显示在图表上。 通过按住“Ctrl”键,您可以选择几种不同的“货币”或“影响”进行排序。 此外,该实用程序不仅显示预测,还显示它们出现在网站上后的实际值。 您可以为每条新闻设置单独的通知。 来自 mql5.com 的新闻,采用您的 MT5 语言。 您可以使用 EA 或指标来阅读新闻。 更多详情请参阅评论中的描述。 EA 可以在新闻发布前关闭市场头寸和挂单,将止损移至盈亏平衡点并在当天结束时平仓。 另外,在评论中,您可以找到一个脚本,该脚本可以从仪表板读取新闻,并通过单击“Algo Trading”按钮停止所有 EA 的交易。 该程序从互联网获取信息,因此您需要在终端设置中启用对 ForexFactory 和 Investing.com 网站的访问。 按“ctrl+O”、“Expert Advisors”、“Allow WebRequest”,然后将链接复
Exp Averager
Vladislav Andruschenko
4.8 (20)
Exp-Averager 旨在通过开立平均交易对已收到一定回撤的交易进行平均。 顾问能够顺势或逆势开立新仓位。 它还包括适用于一系列头寸的智能追踪止损功能。 顾问可以增加或减少头寸的手数。 这是一种广泛使用的策略,用于将亏损头寸调整至平均价格。 MT5版本 详细描述 +DEMO +PDF 如何购买 如何安装     如何获取日志文件     如何测试和优化     Expforex 的所有产品 链接 我们的 TickSniper 黄牛 平均系统示例 具有平均功能的通用交易顾问 The X EA 交易对其所附图表的货币对进行操作。 例如,要启用 EURUSD 的平均值,请打开 EURUSD 图表并运行 Expert Advisor 笔记 该系统不能自动进行交易。 相反,它会跟踪您的交易,并在出现亏损时对其进行平均,直到您实现盈利。 您可以使用策略测试器试用 Expert Advisor,并在可视化模式下使用我们的 EAPADPRO 工具栏进行交易! 它是如何工作的? EA 交易将在指定点数( 距离 )后以相同方向开仓。 持仓交易量的计算方式为前一笔交易的交易量 *
作者的更多信息
Reversal Bars
Igor Semyonov
Description The indicator determines the appearance of the bars that signal of a reversal of current local moods and plays a beep. It also paints these bars in accordance with the bullish and/or bearish priority. You can select the color for bullish and bearish moods. Inputs Sound_Play - a flag that allows the sound notification. Use Detection of the reversal bar can be a signal to perform appropriate trading activities.  The indicator can be used for manual or automated trading in an Expert
Main Candles
Igor Semyonov
The indicator detects the following types of Japanese candlesticks: Doji, Hammer and/or Hanging Man, Shooting Star and/or Inverted Hammer, Spinning Top, Maribozu. The indicator is intended for manual and/or automated trading within an Expert Advisor. There is a possibility to choose colors for bullish and bearish candlesticks. For automated trading, use any indicator buffer of the double type: 0, 1, 2 or 3, whose value is not zero!
The indicator is intended for detecting big (long) and/or small (short) candlesticks. There is possibility of coloring the bullish and bearish candlesticks. The indicator can be used for manual and/or automated trading within an Expert Advisor. The indicator data that can be used for automated trading can be taken from one of four buffers of the double type: 0, 1, 2 or 3. Values must not be equal to zero. 
The indicator of DeMark fractals. The indicator can be drawn on the basis of price data and on the basis of a moving average. There is a possibility to color the up and down fractals. The indicator can be used for manual and for automated trading within an Expert Advisor. For automated trading, use any indicator buffer of the double type: 0 - up fractals, 1 - down fractals! Values of the buffers must not be equal to zero.  A moving average is drawn on the basis of input parameters: Calc_Method 
Stochastic Global
Igor Semyonov
4 (1)
Description A universal colored indicator Stochastic. The rising and falling lines and the levels of the indicator can be colored.   The indicator can be calculated as the standard one on the basis of a price or as a derivative on the basis of the following nineteen other indicators included in the standard package of the MetaTrader 4 terminal: AD - an indicator of accumulation and distribution of volume. OBV - On Balance Volume. Volume - tick volume indicator. AC - indicator of acceleration. AO
Description A universal colored indicator MACD Histo. The rising and falling of the indicator histogram can be colored.   The indicator can be calculated as the standard one on the basis of a price or as a derivative on the basis of the following twelve other indicators included in the standard package of the MetaTrader 4 terminal: AD - an indicator of accumulation and distribution of volume. OBV - On Balance Volume. Volume - tick volume indicator. Force - Force Index indicator. MFI - Money Flow
Description A colored universal indicator MACD Line (MA convergence-divergence indicator, shown as a histogram). The rising and falling of the indicator histogram can be colored. The indicator can be calculated as the standard one on the basis of a price or as a derivative on the basis of the following twelve other indicators included in the standard package of the MetaTrader 4 terminal: AD - an indicator of accumulation and distribution of volume. OBV - On Balance Volume. Volume - tick volume i
RSI Global
Igor Semyonov
Description A universal indicator RSI together with moving averages based on it. Depending on the need, moving averages can be disabled. You can color the indicator lines and levels: lines of RSI, moving average lines and thresholds of overbought and oversold levels.   The indicator can be calculated as the standard one on the basis of a price or as a derivative on the basis of the following eighteen other indicators included in the standard package of the MT4 terminal: AD - an indicator of accu
CCI Global
Igor Semyonov
5 (1)
Description A universal indicator CCI together with moving averages based on it. Depending on the need, moving averages can be disabled. You can color the indicator lines and levels: lines of CCI, moving average lines and thresholds of overbought and oversold levels.   The indicator can be calculated as the standard one on the basis of a price or as a derivative on the basis of the following eighteen other indicators included in the standard package of the MetaTrader 4 terminal: AD - an indicato
Description A multi-purpose multi-colored/multi-symbol indicator, which is a set of standard tools from the MetaTrader 4 terminal. The difference is that below the basic price chart it allows to calculate and build in a separate window any of the twenty indicators in a colored form, painting bulls and bears in different colors, for any financial instrument in accordance with the list below:  AD - an indicator of accumulation and distribution of volume. OBV - On Balance Volume. Force - Force Inde
AO Global
Igor Semyonov
Description A colored universal indicator AO (Awesome Oscillator). The rising and falling of the indicator histogram can be colored.   The indicator can be calculated as the standard one or as a derivative on the basis of the following eleven other indicators included in the standard package of the MetaTrader 4 terminal: AD - an indicator of accumulation and distribution of volume. OBV - On Balance Volume. Volume - tick volume indicator. Force - Force Index indicator. MFI - Money Flow Index. ATR
Description A colored universal indicator MACD Classic (MA convergence-divergence indicator) that combines two indicators: MACD Line and MACD Histo. The rising and falling lines, the signal line and the indicator histogram can be colored. The indicator can be calculated as the standard one on the basis of a price or as a derivative on the basis of the following twelve other indicators included in the standard package of the MetaTrader 4 terminal: AD - an indicator of accumulation and distributio
Description The universal colored multicurrency/multisymbol indicator MACD Classic, consisting of two MACD indicators: MACD Line and MACD Histo. The indicator may be used with any broker, irrespective of the name of the financial instrument since it is necessary to manually enter the name as an input parameter. If you enter a non-existent or incorrect name of a financial instrument, you will receive an error message that this financial instrument is unknown (does not exist). Inputs Currency_Na
Description A colored universal indicator/oscillator based on crossing moving averages. The rising and falling lines of the indicator histogram can be colored. The combined use of the line and the histogram increases the level of the analysis when making a decision to open or close deals. The indicator can be calculated as the standard Price Oscillator or as a derivative on the basis of the following eleven other indicators included in the standard package of the MetaTrader 4 terminal: AD - an i
Description A universal colored multicurrency/multi-symbol indicator RAVI. Was proposed by T. Chand as a trend indicator. RAVI means Range Action Verification Index. The indicator may be used with any broker, irrespective of the name of the financial instrument since it is necessary to manually enter the name as an input parameter. If you enter a non-existent or incorrect name of a financial instrument, you will receive an error message that this financial instrument is unknown (does not exist).
Description A colored multicurrency/multisymbol oscillator of the market mood. The oscillator is designed for detecting the continuation or change of the market mood prior to its occurrence. An excellent example is the screenshots that show all the features of the oscillator. The oscillator may be used with any broker, irrespective of the name of the financial instrument since it is necessary to manually enter the name as an input parameter. If you enter a non-existent or incorrect name of a fin
Inside Bar
Igor Semyonov
Description The indicator determines the appearance of internal bars on the chart, and paints them in accordance with the bullish and/or bearish mood. The indicator can notify of the appearance of a formed internal bar by playing a beep, as well as display the time remaining until the end of the formation of the current bar in the format of <d:h:m:s, where: < means the current bar. d - days. h - hours. m - minutes. s - seconds. The bullish and bearish mood can be colored. Inputs Sound_Play - a
Description The indicator determines the appearance of bars that notify of the reversal of the current trend, and paints them in accordance with the bullish and/or bearish mood. The indicator can notify of the appearance of a formed reversal bar by playing a beep, as well as display the time remaining until the end of the formation of the current bar in the format of <d:h:m:s, where: < means the current bar. d - days. h - hours. m - minutes. s - seconds. You can select the color for bullish and
Description A universal colored multicurrency/multi-symbol indicator of moving averages: Moving Average, Double Moving Average, Triple Moving Average . The indicator is drawn in a separate window, so below the main trading chart a user can see the development of another financial instrument. It is very useful when considering the combined values of various moving averages for different financial instruments below the main trading chart.  The indicator may be used with any broker, irrespective of
Description A universal colored indicator of moving averages: Moving Average, Double Moving Average, Triple Moving Average . The indicator provides various opportunities for the analysis of prices based on different ways of constructing moving averages in the window of the main financial instrument. You can color bullish and bearish moods. Inputs MA_Type - type of multiplicity: Moving Average. Double Moving Average. Triple Moving Average. MA_Period - the MA period. MA_Method - the averaging me
Description A colored universal multicurrency/multi-symbol indicator Bollinger Bands to be drawn in a separate window below the main financial instrument. The rising and falling line of the main indicator and Bollinger Bands can be colored. The indicator can be calculated based on one of the eleven basic indicators included in the standard package of the MetaTrader 4 terminal: AD - an indicator of accumulation and distribution of volume. OBV - On Balance Volume. Force - Force Index indicator. MF
Description A colored universal multicurrency/multi-symbol indicator Channel to be drawn in a separate window below the main financial instrument. The indicator uses the calculation method of the Price Channel indicator. The rising and falling line of the main indicator and the Channel lines can be colored. The indicator can be calculated based on one of the eleven basic indicators included in the standard package of the MetaTrader 4 terminal: AD - an indicator of accumulation and distribution o
Keltner Channel
Igor Semyonov
5 (1)
Description Keltner's colored channel indicator,also called STARC band, drawn in the main chart window. The indicator uses the calculation technique of the three drawing options: basic, improved and modified . The first two were proposed by Keltner, the third one - by a successful trader L. Rakshe. You can also search for your own best parameters of the indicator. The upper, middle and lower bands can be colored. The indicator includes the basic analytical tool of the market moods by Keltner. Th
ZigZag Global
Igor Semyonov
Description A colored universal multicurrency/multi-symbol indicator ZigZag to be drawn in a separate window below the main financial instrument. The indicator may be used with any broker, irrespective of the name of the financial instrument since it is necessary to manually enter the name as an input parameter. If you enter a non-existent or incorrect name of a financial instrument, you will receive an error message that this financial instrument is unknown (does not exist).  The indicator can
Description A colored channel indicator Price Channel to be drawn on the main chart of a financial symbol. It can color bullish and bearish moods based on the middle line of the indicator, as well as change the color of the upper and lower lines of the channel. Purpose The indicator can be used for manual or automated trading in an Expert Advisor. Values of indicator buffer of the double type can be used for automated trading:  The middle line of the indicator - buffer 4. The upper line of the
Description Candlesticks is a colored multicurrency/multy-symbol indicator. It shows a financial instrument as a candlestick chart in a separate window below the chart of the main financial symbo. The indicator may be used with any broker, irrespective of the name of the financial instrument since it is necessary to manually enter the name as an input parameter. If you enter a non-existent or incorrect name of a financial instrument, you will receive an error message that this financial instrume
Description Candlestick Tools  is a colored multicurrency/multy-symbol indicator. It shows one of four standard indicators as a candlestick chart in a separate window below the chart of the main financial symbol. The indicator is calculated based on one of two indicators included in the standard package of the МetaТrader 4 terminal: CCI - Commodity Channel Index. RSI - Relative Strength Index. The default indicator is Commodity Channel Index. The indicator may be used with any broker, irrespecti
Pivot Pro
Igor Semyonov
Description Pivot Pro  is a universal color indicator of the  Pivot Points  levels systems. You can select one of its three versions:  Standard   Old , Standard New  and  Fibo . The system will automatically calculate the  Pivot Point  on the basis of market data for the previous day ( PERIOD_D1 ) and the system of support and resistance levels, three in each. It can also display price tags for each level. You can color the indicator lines. Only a method of calculation of the third level of supp
Price Levels
Igor Semyonov
Description The indicator is intended for labeling the chart using horizontal levels and/or half-round prices. The indicator works on any financial instrument regardless of the name and the number of digits. A user can choose colors for the indicator lines. Input Parameters Calc_Method - method of calculation of the lines: levels of round prices. levels of half-round prices. Digits_Accepted - flag for calculating the levels according to number of decimal places in the quotes of a financial ins
Description A colored universal multicurrency/multi-symbol indicator MACD Line Smart (the indicator moving average convergence divergence is displayed as a histogram) based on double or triple moving average .  Comparing to the standard MACD this indicator is more sensitive to what allows generating advance signals. he indicator may be used with any broker, irrespective of the name of the financial instrument since it is necessary to manually enter the name as an input parameter. If you enter a
筛选:
无评论
回复评论
版本 1.24 2024.07.24
Updating.
Version 5, build 2408 of MetaEditor
版本 1.23 2020.04.03
Updating and interface improvement
版本 1.22 2014.09.08
Eliminated the error of unloading the indicator from the chart.
版本 1.21 2014.08.22
New version of the indicator has the improved sound and e-mail notification options.