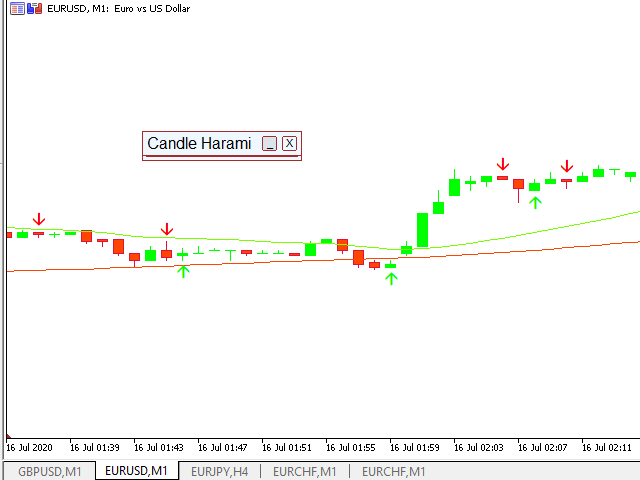
• 概述
  • 评论
  • 评论

Candle Harami

Это простой индикатор, показывающий формирование свечей харами.
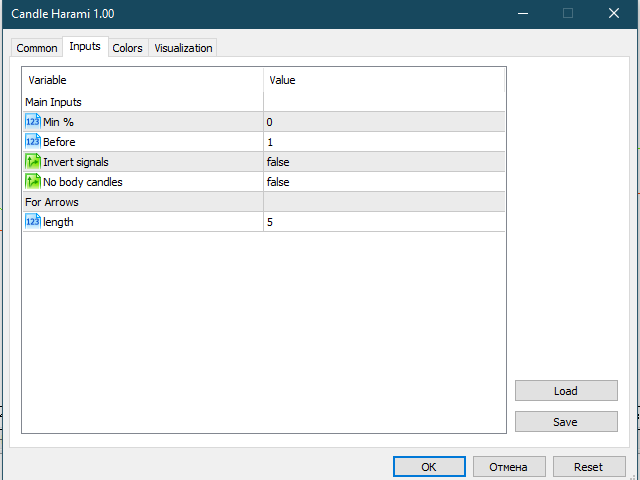
Входные параметры:

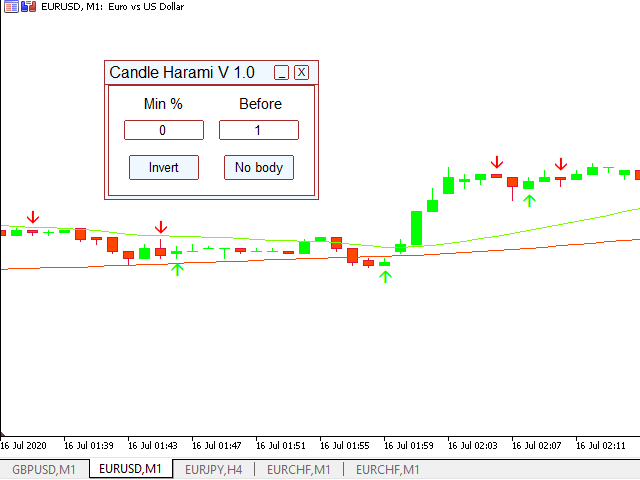
  1. Min % - минимальный процент харами
  2. Before - количество свечей до сигнала
  3. Invert - инвертировать сигналы
  4. No Body - свечи без тела
  5. Length - настройка для отображения сигналов
В индикаторе есть встроенный фильтр по количеству свечей до сигнала и минимальному проценту харами.

Более подробно о настройках индикатора можно прочитать на моем сайте.


推荐产品
The Accumulation / Distribution is an indicator which was essentially designed to measure underlying supply and demand. It accomplishes this by trying to determine whether traders are actually accumulating (buying) or distributing (selling). This indicator should be more accurate than other default MT5 AD indicator for measuring buy/sell pressure by volume, identifying trend change through divergence and calculating Accumulation/Distribution (A/D) level. Application: - Buy/sell pressure: above
Owl Smart Levels MT5
Sergey Ermolov
4.31 (39)
MT4版本  |   FAQ Owl Smart Levels Indicator 是一個完整的交易系統,包含 Bill Williams 的高級分形、構建正確的市場波浪結構的 Valable ZigZag 以及標記準確入場水平的斐波那契水平等流行的市場分析工具 進入市場和地方獲利。 策略的详细说明 指示灯使用说明 顾问-贸易猫头鹰助手助理 私人用户聊天 ->购买后写信给我,我会将您添加到私人聊天中,您可以在那里下载所有奖金 力量在於簡單! Owl Smart Levels 交易系統非常易於使用,因此適合專業人士和剛開始研究市場並為自己選擇交易策略的人。 策略和指標中沒有隱藏的秘密公式和計算方法,所有策略指標都是公開的。 Owl Smart Levels 允許您快速查看進入交易的信號,突出顯示下訂單的水平並向您發送有關已出現信號的通知。 優點很明顯: 清楚地顯示主要和更高時間框架的趨勢方向。 指示儀器信號的出現。 標記開單、止損設置和固定利潤的水平。 沒有多餘的,只有必要的結構! ZigZag 表示全球趨勢的方向,因此也表示貿易方向。 市場反轉點的短線清楚地表明在什麼水平上構建斐波
Volumes Direction MT5
William Oswaldo Mayorga Urduy
卷方向 MT5 通常,当当前音量高于前一音量时,音量指示器具有默认的颜色变化,这很重要但不是很有用。 出于这个原因,这个指标的创建是为了除了正常的交易量之外,当蜡烛看涨或看跌时,它会为它们绘制不同的颜色,默认情况下看涨的蓝色和看跌的红色,但这些颜色可以定制为 商人的味道。 不要忘记查看我的其他指标,它们将帮助您改善交易。 卷方向 MT5 通常,当当前音量高于前一音量时,音量指示器具有默认的颜色变化,这很重要但不是很有用。 出于这个原因,这个指标的创建是为了除了正常的交易量之外,当蜡烛看涨或看跌时,它会为它们绘制不同的颜色,默认情况下看涨的蓝色和看跌的红色,但这些颜色可以定制为 商人的味道。 不要忘记查看我的其他指标,它们将帮助您改善交易。
HMA Trend Professional MT5
Pavel Zamoshnikov
4.5 (6)
Improved version of the free HMA Trend indicator (for MetaTrader 4) with statistical analysis. HMA Trend is a trend indicator based on the Hull Moving Average (HMA) with two periods. HMA with a slow period identifies the trend, while HMA with a fast period determines the short-term movements and signals in the trend direction. The main differences from the free version: Ability to predict the probability of a trend reversal using analysis of history data. Plotting statistical charts for analyz
To get access to MT4 version please click here . - This is the exact conversion from TradingView: "Stochastic Momentum Index" By "UCSgears". - This is a popular version of stochastic oscillator on tradingview. - This is a light-load processing and non-repaint indicator. - Buffers are available for the lines on chart. - You can message in private chat for further changes you need. Thanks for downloading
No Demand No Supply MT5
Trade The Volume Waves Single Member P.C.
No Demand No Supply   This indicator identifies   No Demand –No Supply candles to your chart and plots volume bars colored according to the signal. It can be applied to all timeframes or to a specific one only. It can also be used as regular volume indicator  with exceptional future of WEIGHTED VOLUME. Furthermore is has an alert notification, sound and email when a signals occurs. The indicator does not repaint but the alert will come on two candles back due to the definition of No Demand No Su
This indicator provides an original mix of WPR, VSA, and volume delta. It shows ratio of buy/sell volumes scaled on 100% range based on total volume change for a selected period. The convetional VSA (Volume Spread Analysis) studies interconnections of price action and volume change in absolute values, whereas WPR (Williams Percent Range) offers a convenient approach of price moves normalization into the fixed percentage metric: 0 - 100%. Hence overbough and oversold states are easily spotted. N
Blahtech Market Profile MT5
Blahtech Limited
5 (9)
Was: $249  Now: $99   Market Profile defines a number of day types that can help the trader to determine market behaviour. A key feature is the Value Area, representing the range of price action where 70% of trading took place. Understanding the Value Area can give traders valuable insight into market direction and establish the higher odds trade. It is an excellent addition to any system you may be using. Inspired by Jim Dalton’s book “Mind Over Markets”, this indicator is designed to suit the
Wapv Price and volume
Eduardo Da Costa Custodio Santos
Your Pointer
Nadiya Mirosh
Your Pointer is no ordinary Forex channel. This corridor is built on the basis of the analysis of several candles, starting from the last one, as a result of which the extremes of the studied interval are determined. They are the ones who create the channel lines. Like all channels, it has a middle line as well as a high and low line. This channel is worth watching for its unusual behavior. The use of the Your Pointer indicator allows the trader to react in time to the price going beyond the bo
该指标在图表上显示谐波模式,无需以尽可能小的滞后 重新绘制。 指标顶部的搜索基于价格分析的波动原理。 高级设置允许您为您的交易风格选择参数。在蜡烛(柱)开盘时,当新形态形成时,价格变动可能方向的箭头是固定的,保持不变。 该指标识别以下形态及其品种:ABCD、Gartley(蝴蝶、螃蟹、蝙蝠)、3Drives、5-0、蝙蝠侠、SHS、One2One、骆驼、三角形、WXY、斐波那契、振动。默认情况下,设置中仅显示 ABCD 和 Gartley 数字。许多额外的可配置参数。 主要参数: ShowUpDnArrows - 显示/隐藏可能的方向箭头 ArrowUpCode - 向上箭头代码 ArrowDnCode - 向下箭头代码 Show old history patterns - 启用/禁用过时模式的显示 Enable alert messages, actual if history OFF - 启用/禁用模式出现/更改时的警报(仅在禁用历史记录时) Enable alert notification, actual if alert messages is enabled - 模式出现
Binary Options Assistant (BOA) Multi Currency Dashboard for Binary Options (MT5) . You can use any of the BOA Signals Indicators with the dashboard. Just change the BOA Signals Indicator Name in the dashboard settings to the indicator you want to get signals from. For example: CHILL. BLAZE:  BOA_BLAZE_Indicator_v1   Strategy :   BLW Online Trading Binary Options Strategy (3 Moving Average) LAVA:  BOA_LAVA_Indicator_v1   Strategy:   Lady Trader Binary Options Strategy (Bollinger Bands & Stoc
Developed to assist in binary options retraction operations, this indicator will show the best assets to operate retractions!  How it works: The indicator will calculate the total length of each candle from low to high, the total of the body and total of shadows (up and down) and calculate a total shadows percentage of various configurable assets. The counter is updated with each new candle. ATENTION: Demo on the estrategy tester is not functional to show other assets, but still can show how
该指标预测价格反转,分析市场的看涨和看跌压力。购买压力是一定天数内所有累积柱的总和乘以交易量。卖压是相同数量条上所有分配的总和乘以交易量。 [ 安装指南 | 更新指南 | 故障排除 | 常见问题 | 所有产品 ] 指标比率使您可以衡量购买压力占总交易量的百分比,该值应在0到100之间波动。它执行两个移动平均值(快和慢),以识别压力趋势的变化并相应地寻找交易。 比率50表示市场均衡 比率超过70表示市场超买 比率低于30意味着市场超卖 红色虚线是当前比率 蓝线是信号线 橙色线是主线 它具有直接的交易含义。 市场超卖时寻找购买机会 市场超买时寻找销售机会 如果信号线高于主线,则压力看涨 如果信号线低于主线,则压力看跌 输入参数 周期:研究计算压力的条数 快速MA:直方图的快速平均周期 慢的MA:直方图的平均周期慢 作者 ArturoLópezPérez,私人投资者和投机者,软件工程师和Point Zero Trading Solutions的创始人。
Candle hunter
Ruslan Khasanov
5 (1)
圖形分析指標。 在圖表上標記主要的日本燭台形態。 目前,交易者可以使用以下一組模式:  - Bearish/Bullish Abandoned Baby;  - Bearish Advance Block;  - Bearish Deliberation;  - Bearish/Bullish Belt Hold;  - Bearish/Bullish Engulfing;  - Bearish Shooting Star;  - Bearish Evening Star;  - Bearish Evening Doji Star;  - Bearish/Bullish Doji Star;    - Bearish/Bullish Tri-Star;  - Bearish Hanging Man;  - Bearish/Bullish Harami;  - Bearish/Bullish Harami Cross;  - Bearish Two Crows;  - Bearish Identical Three Crows;  - Bearish Three Black Crows
Big Candle Detect
Guilherme Guimaraes Dias
The indicator, Big Candle Detect , is based on ATR and Volume to detect candlesticks of buying and selling strength, which is represented through an oscillator indicator. With this indicator you will be able to identify the lateral market, providing better entries according to your strategy. Big Candle Detect highlights candles with brighter colors when the condition is found, making it easier to identify, in addition to being fully compatible for automation in your EA. SETTINGS ATR P
This is Gekko's customizable version of the famous Heiken Ashi indicator. It extends the use of the famous Heiken Ashi and calculates strong entry and exit signals.  Inputs Number of Bars to Plot Indicator:  number of historical bars to plot the indicator, keep it low for better performance; Produce Arrow Signals:  determine if the indicator will plot arrow signal for long/short; Produces Signal Only When a Bar Closes:  wait for a bar to close to produce a signal (more accurate, by delayed entry
An indicator of pattern #31 ("Long Island") from Encyclopedia of Chart Patterns by Thomas N. Bulkowski. The second gap is in the opposite direction. Parameters: Alerts - show alert when an arrow appears   Push - send a push notification when an arrow appears (requires configuration in the terminal) GapSize - minimum gap size in points ArrowType - a symbol from 1 to 17 ArrowVShift - vertical shift of arrows in points   ShowLevels - show levels ColUp - color of an upward line ColDn - color of a
Renko Plus
Eadvisors Software Inc.
With Renko Plus you can use the features in the Indicator functionality, just add it to the Metatrader5 chart.             The Renko chart is a type of chart, developed by the Japanese, that is constructed using price movement rather than standardized prices and time intervals like most charts. It is believed to be named after the Japanese word for bricks, "renga", as the graphic looks like a series of bricks.             A new brick is created when the price moves a specified p
该指标将向您显示您已经为图表上的每个订单设置的 TP 和 SL 值(以该货币表示)(接近交易/订单行),这将帮助您估算每个订单的利润和损失。它还会向您显示 PIP 值。显示的格式是“我们的损益/PIP 值的货币值”。 TP 值将以绿色显示,SL 值将以红色显示。 如有任何问题或了解更多信息,请随时通过 fxlife.asia@hotmail.com 或 fxlife.asia@yahoo.com 与卖家联系 (而指标中即将加入的下一个功能是“自动或半自动TP和SL设置”,我们的客户将免费获得更新版本。谢谢...^_^) (或者如果您认为在指示中应该增加一些功能,请随时告诉我们) ========================================================
Mr Big MT5
Pavel Verveyko
The indicator shows and highlights the chart candles, which are formed as a result of large players entering the market in large volumes. Such candles can also be formed after achieving a certainty on the market, when most of the participants hold positions in the same direction. The movement is likely to continue in that direction after such candles. The indicator highlights the significant candles from the existing ones on the chart; The indicator allows identifying the trends based on candles
这个指标用于比较图表上的交易品种与其他几个所选交易品种之间的强弱相对关系。 根据每个交易品种基于相同基准日的价格走势进行比较,可以看到几条不同走向的趋势线,反映出几个不同交易品种之间的强弱关系,这样可以更清楚地了解市场的趋势。 例如,你可以在EURUSD图表上应用这个指标,将其与货币对EURJPY和EURGBP进行比较,看看哪个更强。 你需要为指标输入参数: 需要比较的几个交易品种的名称 您需要选择比较基准日期。 请注意,使用指标前应确保相关交易品种的历史数据已经下载。 免费模拟版本是: https://www.mql5.com/zh/market/product/63921 .............................................
Pattern 123 MT5
Pavel Verveyko
"Pattern 123" is an indicator-a trading system built on a popular pattern, pattern 123. This is the moment when we expect a reversal on the older trend and enter the continuation of the small trend, its 3rd impulse. The indicator displays signals and markings on an open chart. You can enable/disable graphical constructions in the settings. The indicator has a built-in notification system   (email, mobile terminal, standard terminal alert). "Pattern 123" has a table that displays signals fr
VR Grid Mt5
Vladimir Pastushak
3.6 (10)
VR 网格指示器 设计 用于创建具有用户定义设置的图形网格。与 标准网格 不同,VR 网格用于构建 圆形关卡 。根据用户的选择,轮次级别之间的步长可以是任意的。此外,与其他指标和实用程序不同,即使时间段发生变化或终端重新启动,VR Grid 也能保持网格的位置 。 设置、设置文件、演示版本、说明、问题解决,可以从以下位置获取 [博客] 您可以在以下位置阅读或撰写评论 [关联] 版本为 [MetaTrader 4] 垂直级别 基于实际时间间隔并 忽略缺失 或不存在的周期。因此,级别之间的步长严格对应于用户选择的值。 使用 VR 网格指标时,交易者 可以更改任何级别的垂直线和水平线的样式 、颜色和粗细。这使您可以控制金融工具的 回合水平 。 整数位是 以两个或多个零结尾 的价格(例如:1.23500、5.65900、1923.200)。人们相信,这样的水平 经常充当 作为支撑或阻力的强点。 Horizontal line settings Horizontal line step Horizontal line color Horizontal line style Horizon
FREE
The best time to trade Using this Indicator is when the time reach exactly hour,half,45 minutes,15 minutes and sometimes 5 minutes.. This indicators is helpful to those who trade boom and crash indecies.How to read this indicator first you'll see Blue allow and Red allow all these allows used to indicate or to detect the spike which will happen so the allow happens soon before the spike happen.This indicator works properly only in boom and crash trading thing which you have to consider when
Price activity
Ivan Simonika
Price activity indicator showing the trend zone - flat, not redrawing previous values. The indicator is very sensitive to current price activity and displays signals quite well. The state of the market, the phase of its movement largely determines the success of the trader and his chosen strategy. The color version of the indicator signals a trend change. The indicator allows you to see a rising or falling trend. In addition to the trend direction, the indicator shows a change in the angle of in
Indicator and Expert Adviser  EA Available in the comments section of this product. Download with Indicator must have indicator installed for EA to work. Mt5 indicator alerts for bollinger band and envelope extremes occurring at the same time. Buy signal alerts occur when A bullish candle has formed below both the lower bollinger band and the lower envelope  Bar must open and close below both these indicators. Sell signal occur when A bear bar is formed above the upper bollinger band and upp
Trade history
Andriy Konovalov
5 (4)
The indicator plots charts of profit taken at the Close of candles for closed (or partially closed) long and short positions individually. The indicator allows to filter deals by the current symbol, specified expert ID (magic number) and the presence (absence) of a substring in a deal comment, to set the start time and the periodicity of profit reset (daily, weekly or monthly) to calculate the profit chart. The indicator also displays the floating (not fixed) profit of the opened positions at th
FFx Watcher Pro MT5
Eric Venturi-Bloxs
3.67 (3)
The FFx Watcher PRO is a dashboard displaying on a single chart the current direction of up to 15 standard indicators and up to 21 timeframes. It has 2 different modes: Watcher mode: Multi Indicators User is able to select up to 15 indicators to be displayed User is able to select up to 21 timeframes to be displayed Watcher mode: Multi Pairs User is able to select any number of pairs/symbols User is able to select up to 21 timeframes to be displayed This mode uses one of the standard indicators
Developed by Smart Trader - Smart Reversion Pattern is an indicator capable of identifying reversal patterns , both bullish reversals and bearish reversals. It is designed to provide fast, real-time awareness of patterns. We also thought about the interface part, creating a clean and pleasant look to identify formation patterns on the chart. Note: If any pattern you need is not listed, just contact us and request inclusion - we usually respond within a few hours. Bearish Reversal P
该产品的买家也购买
Atomic Analyst MT5
Issam Kassas
4.78 (18)
首先值得强调的是,该交易指标是非重绘、非延迟的指标,这使其成为手动和机器人交易的理想选择。 用户手册:设置、输入和策略。 Atomic Analyst是一种PA价格行动指标,利用价格的力量和动量来寻找市场上更好的机会。配备了高级过滤器,可帮助去除噪音和假信号,并提高交易潜力。使用多层复杂的指标,Atomic Analyst扫描图表,并将复杂的数学计算转化为任何初学者都能理解并用来做出一致交易决策的简单信号和颜色。 “Atomic Analyst”是专为新手和经验丰富的交易者量身定制的综合交易解决方案。它将高级指标和一流功能融合为一体的交易策略,使其成为所有类型交易者的多功能选择。 日内交易和剥头皮策略:专为快速准确的日内交易和短期交易而设计。 日内和摆动交易策略:可用作追求价格大幅波动的日内和摆动交易者的可靠工具。 多货币和市场:凭借其可靠的精度,在不同的工具和市场上运作。 多个时间框架:可在多个时间框架上使用,性能良好。 稳定性:所有指标均不重绘、不重绘和不滞后,确保可靠的信号。 信号清晰度:提供箭头信号,用于清晰的入场和出场点。 实时警报:通过交易入场、SL和TP警报通知交
首先,值得强调的是,这个交易系统是一个非重绘、非重画和非滞后的指标,这使得它非常适合手动和机器人交易。 在线课程,手册和下载预设。 “智能趋势交易系统 MT5”是专为新手和经验丰富的交易者量身定制的综合交易解决方案。它结合了超过 10 个优质指标,具有 7 多个强大的交易策略,使其成为适用于各种市场条件的多功能选择。 趋势跟随策略:提供精确的入场和止损管理,以有效地跟随趋势。 反转策略:识别潜在的趋势反转,使交易者能够利用区域市场的机会。 剃头策略:专为快速准确的日内交易和短期交易而设计。 稳定性:所有指标都不会重绘、不会重画和不会滞后,确保可靠的信号。 定制:支持自定义策略,以满足个人交易偏好。超过 7 种策略和组合可帮助您找到最佳策略。 信号清晰度:提供箭头信号,以指示清晰的入场和退出点。 实时警报:通过交易进出警报使交易者保持了解。 深入分析:提供更高时间框架的趋势分析和实时交易监控。 自适应颜色编码:利用蜡烛颜色编码来显示成交量、趋势和反转蜡烛信号。通过蜡烛颜色分析市场方向。 “智能趋势交易系统 MT5”赋予交易者必要的工具,以便在各种市场条件下做出明智和战略性的交易决策。无论
Quantum Trend Sniper
Bogdan Ion Puscasu
4.92 (48)
介绍   量子趋势狙击指标 ,突破性的 MQL5 指标,正在改变您识别和交易趋势反转的方式!由拥有超过13年交易经验的资深交易员团队开发,     量子趋势狙击指标   旨在通过其创新的方式以极高的准确度识别趋势反转,将您的交易之旅推向新的高度。 ***购买量子趋势狙击指标,即可免费获得量子突破指标!*** 当量子突破指标识别出趋势反转时,它会向您发出警报和信号箭头,并建议您三个止盈水平。 它既适合新手交易者,也适合专业交易者。 量子 EA 通道:       点击这里 MT4版本:       点击这里 建议: 时间范围: 所有时间范围。为了获得最佳结果,我们建议在 M15、M30 和 H1 时间范围内使用它。 货币对:欧元兑美元、英镑兑美元、澳元兑美元、欧元兑英镑、, EURAUD,  XAUUSD 账户类型:ECN、Raw 或 Razor,点差极低 经纪时间:任意 经纪商:IC Markets、Pepperstone with Raw 和 Razor 的点差最低 建议止损:50 点 建议止盈水平:20 点、50 点和
FX Power MT5 NG
Daniel Stein
5 (6)
通过 mql5 和 Telegram 上 的晨间简报获取每日市场更新,包括详细信息和屏幕截图 ! FX Power MT5 NG 是我们长期以来非常受欢迎的货币强度计算器 FX Power 的下一代产品。 这款下一代强度计算器能提供什么?您所喜爱的原版 FX Power 的所有功能 附加功能 黄金/XAU 强度分析 更精确的计算结果 可单独配置的分析周期 可自定义计算限制,以获得更好的性能 为希望查看更多信息的用户提供特殊的多实例设置 无尽的图形设置,可在每个图表中设置您最喜欢的颜色 无数的通知选项,让您再也不会错过任何重要信息 采用 Windows 11 和 macOS 风格的全新圆角设计 神奇的移动指标面板 FX Power 主要功能 所有主要货币的完整强势历史 所有时间框架内的货币强弱历史 所有经纪商和图表的计算结果完全相同 100% 可靠的实时计算 -> 无重绘 可通过下拉列表选择分析时段 通过自定义模式单独配置分析时段 可在一个图表中使用多个实例 可移动 FX Power 显示屏(通过拖放) 适用于高分辨率 QHD、UHD 和 4K 显示器 自动终端配置 针对平板电脑
Trend Screener Pro MT5
STE S.S.COMPANY
4.88 (66)
使用趋势筛选指标释放趋势交易的力量:由模糊逻辑和多货币系统提供支持的终极趋势交易解决方案! 使用趋势筛选器(由模糊逻辑提供支持的革命性趋势指标)提升您的趋势交易。 它是一个强大的趋势跟踪指标,结合了超过 13 种高级工具和功能以及 3 种交易策略,使其成为使您的 Metatrader 成为趋势分析器的多功能选择。 限时优惠:趋势筛选指标终身仅需 50 美元。 ( 原价 125$ ) (优惠延长) 体验趋势筛选器 100% 无需重新绘制的准确性,确保您的交易决策不受过去价格变化的影响。 释放多时间框架和多货币功能的多功能性,使您能够以无与伦比的信心在外汇、商品、加密货币和指数领域进行交易。 利用 Trend Screener 的综合策略套件增强您的交易: - 趋势跟踪策略和趋势延续策略 :趋势筛选器的趋势跟踪策略提供清晰的趋势延续信号,让您有效捕捉趋势走势并管理风险。 - 反转策略和早期入场点策略 :趋势筛选器的反转策略可检测市场方向的潜在变化,使您能够预测趋势反转并利用疲弱的市场趋势。通过早期入场点,您可以在潜在的趋势变化之前定位自己 获取可观的利润。 - 倒卖策略: 趋势筛选器的倒卖
Entry Points Pro for MT5
Yury Orlov
4.55 (161)
这款指标用于 MT5,可提供准确的入场交易信号,且无重绘。 它可应用在任何金融资产:外汇、加密货币、贵金属、股票、指数。 它将提供极其精准的评估,并告诉您何时开仓和平仓的最佳时机。 观看 视频 (6:22),其中包含一个仅处理单一信号的示例,该信号即可值回指标购价! 大多数交易者在 Entry Points Pro 指标的帮助下,在第一个交易周内即改善了他们的交易结果。 订阅我们的 Telegram 群 ! Entry Points Pro 指标的益处。 入场信号无重绘 如果信号出现,并得到确认,则它不会再消失;不像是重绘指标,它会导致重大的财产损失,因为它们可以在显示信号后再将其删除。 无差错开仓 指标算法可令您找到入场交易(买入或卖出资产)的理想时机,从而提高每位交易者的成功率。 Entry Points Pro 可操作任何资产 它允许您在 MT5 平台上交易任何经纪商的加密货币、股票、贵金属、指数、大宗商品和货币。 提供任何方向的信号 Entry Points Pro 指标提供针对任意价格走势的入场交易信号 - 上涨、下跌或横盘(横向)。
首先,值得强调的是,这个交易工具是非重绘、非重画和非滞后的指标,非常适合专业交易。 在线课程,用户手册和演示。 智能价格行动概念指标是一个非常强大的工具,既适用于新手,也适用于经验丰富的交易者。它将超过20个有用的指标合并到一个指标中,结合了高级交易思想,如内圈交易员分析和智能资金概念交易策略。该指标侧重于智能资金概念,提供有关大型机构交易方式的见解,帮助预测它们的动向。 它在流动性分析方面尤其擅长,有助于理解机构的交易方式。它擅长预测市场趋势,并仔细分析价格波动。通过将您的交易与机构策略对齐,您可以更准确地预测市场走向。该指标多才多艺,擅长分析市场结构,识别重要的订单区块,并识别各种模式。 它擅长识别BOS和CHoCH等模式,理解动量的转变,并突出显示供需强劲的关键区域。它还擅长发现强大的不平衡,并分析价格创造更高高点或更低低点的模式。如果您使用斐波那契回撤工具,该指标可以满足您的需求。它还可以识别相等的高点和低点,分析不同的时间框架,并通过仪表板显示数据。 对于使用更高级策略的交易者,该指标提供了工具,如公平价值差指标和优惠和折扣区域的识别。它特别关注高时间框架订单
FX Volume MT5
Daniel Stein
4.94 (17)
通过 mql5 和 Telegram 上 的 " 晨间简报 "获取每日市场更新,包括详细信息和屏幕截图 ! 外汇交易量(FX Volume)是第一个也是唯一一个从经纪商角度真正洞察市场情绪的交易量指标。 直接在您的图表上看到这些信息是真正改变游戏规则和突破性的交易解决方案。 受益于独特的市场数据洞察,如 比率(Ratios )显示货币多头和空头头寸的比率(百分比 比率变化 显示所选时间段内的多头比率及其百分比变化 总交易量 显示货币的总交易量(多头和空头),以手为单位 多头 交易量显示货币所有多头头寸的交易量 空头 交易量显示所有货币空头头寸的交易量 净多头 显示净多头交易量,即所有多头头寸减去所有空头头寸(以手为单位)。 净多头百分比 显示货币净多头交易量的变化 请阅读我们的基本教程 -> "如何使用外汇交易量进行交易 " 获取更多信息,如常见问题、交易技巧和教程视频,请访问我们的 外汇交易量公共信息频道 请 安装并运行 SI Connect 以建立与我们数据中心的持续连接 背景信息 我们都知道,外汇是一个分散的市场。这就是为什么我们必须打破常规思维,开发一个独
TPSpro RFI Levels MT5
Roman Podpora
5 (8)
Reversal First Impulse levels (RFI)      INSTRUCTIONS        RUS       -       ENG              R ecommended to use with an indicator   -   TPSpro  TREND PRO -  Version MT4                 A key element in trading is zones or levels from which decisions to buy or sell a trading instrument are made. Despite attempts by major players to conceal their presence in the market, they inevitably leave traces. Our task was to learn how to identify these traces and interpret them correctly. Main functi
该仪表盘显示所选符号的最新可用谐波形态,因此您可以节省时间并提高效率 /  MT4 版本 。 免费指标:  Basic Harmonic Pattern 指标列 Symbol:   显示所选符号 Trend:     看涨或看跌 Pattern:    形态类型(Gartley、蝴蝶、蝙蝠、螃蟹、鲨鱼、Cypher 或 ABCD) Entry:     入口价格 SL: 止损价 TP1: 第一止盈价 TP2: 第二次获利价格 TP3: 第三次获利价格 Current price:    当前价格 Age (in bars):   最后绘制的模式的年龄 主要输入 Symbols :   从 "28 种主要货币对 "或 "选定符号 "中选择。 Selected Symbols :   希望监控的符号,用逗号分隔("EURUSD,GBPUSD,XAUUSD")。如果您的经纪商为货币对设置了后缀或前缀,您必须在以下两个参数中添加(货币对前缀或货币对后缀)。 Max Iteration:   调整模式的最大迭代次数(如果该值越小,则模式越少,性能越快;如果该值越大,则模式越多,性能
IX Power MT5
Daniel Stein
4.17 (6)
IX Power 终于将 FX Power 的无与伦比的精确性带到了非外汇交易符号中。 它能准确判断您喜爱的指数、股票、商品、ETF 甚至加密货币的短期、中期和长期趋势强度。 您可以 分析 终端提供的 一切 。试试吧,体验一下您在交易时如何把握 时机 。 IX Power 主要功能 100% 精确的非重绘计算结果 - 适用于您终端中的所有交易符号 下拉式选择预配置以及可单独配置的强度分析周期 通过电子邮件、消息和手机通知的无数种通知选项 可访问的 EA 请求缓冲区 可自定义计算限制,以获得更好的性能 为希望查看更多信息的用户提供特殊的多实例设置 无尽的图形设置,让您在每个图表中都能找到最喜欢的颜色 采用 Windows 11 和 macOS 风格的圆角新面板设计 神奇的移动指标面板,可在子窗口和主图表之间无缝移动 适用于高分辨率 QHD、UHD 和 4K 显示器,并针对平板电脑和触摸屏进行了优化 IX Power 参数 最重要的参数不言自明,但我们很快会在另一篇文章中为您提供所有 IX Power 参数的完整说明。 使用别名 "参数可为技术交易符号
AT Forex Indicator MT5
Marzena Maria Szmit
5 (4)
The AT Forex Indicator MT5 is a sophisticated trading tool designed to provide traders with a comprehensive analysis of multiple currency pairs. This powerful indicator simplifies the complex nature of the forex market, making it accessible for both novice and experienced traders. AT Forex Indicator uses advanced algorithms to detect trends, patterns and is an essential tool for traders aiming to enhance their forex trading performance. With its robust features, ease of use, and reliable signal
介绍     Quantum Breakout PRO   ,突破性的 MQL5 指标,正在改变您交易突破区域的方式!由拥有超过13年交易经验的资深交易员团队开发,     量子突破 PRO     旨在通过其创新和动态的突破区域策略将您的交易之旅推向新的高度。 量子突破指标将为您提供带有 5 个利润目标区域的突破区域的信号箭头,以及基于突破框的止损建议。 它既适合新手交易者,也适合专业交易者。 量子 EA 通道:       点击这里 重要的!购买后请私信我领取安装手册。 建议: 时间范围:M15 货币对:GBPJPY、EURJPY、USDJPY、NZDUSD、XAUUSD 账户类型:ECN、Raw 或 Razor,点差极低 经纪商时间:GMT +3 经纪商:IC Markets、Pepperstone with Raw 和 Razor 的点差最低 规格: 不重漆! 最多 5 个建议利润目标区域 建议止损水平 可定制的盒子。您可以设置自己的 Box Time Start 和 Box Time End。 接触 如果您有任何疑问或需要帮
Matrix Arrow Indicator MT5
Juvenille Emperor Limited
5 (14)
矩阵箭头指标 MT5   是一种独特的 10 合 1 趋势,遵循   100% 非重绘多时间框架指标 ,可用于所有符号/工具: 外汇 、 商品 、 加密货币 、 指数 、 股票 。 Matrix Arrow Indicator MT5 将在其早期阶段确定当前趋势,从多达 10 个标准指标中收集信息和数据,它们是: 平均定向运动指数 (ADX) 商品渠道指数 (CCI) 经典 Heiken Ashi 蜡烛 移动平均线 移动平均收敛散度 (MACD) 相对活力指数 (RVI) 相对强弱指数 (RSI) 抛物线SAR 随机振荡器 威廉姆斯的百分比范围 当所有指标给出有效的买入或卖出信号时,相应的箭头将打印在图表上,在下一根蜡烛/柱线开盘时,指示强劲的上升趋势/下降趋势。用户可以选择使用哪些指标,并可以单独调整每个指标的参数。 Matrix Arrow Indicator MT5 仅从选定的指标中收集信息,并仅根据其数据打印箭头。   Matrix Arrow Indicator MT5   还可以为所有新信号发送终端、推送通知或电子邮件警报。无论您是黄牛、日内交易者还是波段交易者, Mat
该仪表盘可根据您对所选符号的交易策略,以剥头皮和长期模式在图表上发现并显示供需区。此外,仪表盘的扫描模式可帮助您一目了然地检查所有需要的符号,不错过任何合适的仓位/ MT4 版本 免费指标: Basic Supply Demand 功能 允许您查看多个货币对的交易机会,为您提供所有货币对的清晰简明视图,并根据其与供需区的接近程度进行排序 可定制设置,从颜色到检测参数,满足您的特定需求 主要输入 Indicator mode : 选择指标模式或具有新功能的面板模式 Symbols : 从 "28 种主要货币对 "或 "选定符号 "中进行选择 Selected Symbols : 您希望监控的符号,用逗号分隔("EURUSD,GBPUSD,XAUUSD")。如果您的经纪商对货币对有后缀或前缀,您必须在以下两个参数中添加(货币对前缀或货币对后缀) Trading Style : 选择剥头皮或长期模式 Allowed Deviation : 该参数允许修改需求或供应区域的精确度(数值越小,精确度越高) Zone   thickness : 通过该参数可以修改需求和供应
Blahtech Supply Demand MT5
Blahtech Limited
4.54 (13)
Was: $299  Now: $99   Supply Demand uses previous price action to identify potential imbalances between buyers and sellers. The key is to identify the better odds zones, not just the untouched ones. Blahtech Supply Demand indicator delivers functionality previously unavailable on any trading platform. This 4-in-1 indicator not only highlights the higher probability zones using a multi-criteria strength engine, but also combines it with multi-timeframe trend analysis, previously confirmed swings
Gartley Hunter Multi
Siarhei Vashchylka
5 (7)
Gartley Hunter Multi - An indicator for searching for harmonic patterns simultaneously on dozens of trading instruments and on all possible timeframes. Manual (Be sure to read before purchasing) | Version for MT4 Advantages 1. Patterns: Gartley, Butterfly, Shark, Crab. Bat, Alternate Bat, Deep Crab, Cypher 2. Simultaneous search for patterns on dozens of trading instruments and on all possible timeframes 3. Search for patterns of all possible sizes. From the smallest to the largest 4. A
Auto Order Block with break of structure based on ICT and Smart Money Concepts (SMC) Futures Break of Structure ( BoS )             Order block ( OB )            Higher time frame Order block / Point of Interest ( POI )    shown on current chart           Fair value Gap ( FVG ) / Imbalance   -  MTF      ( Multi Time Frame )    HH/LL/HL/LH  -  MTF      ( Multi Time Frame )  Choch  MTF      ( Multi Time Frame )  Volume Imbalance     ,  MTF          vIMB Gap’s Power of 3 Equal High
ICT, SMC, SMART MONEY CONCEPTS, SMART MONEY, Smart Money Concept, Support and Resistance, Trend Analysis, Price Action, Market Structure, Order Blocks, BOS/CHoCH,   Breaker Blocks ,  Momentum Shift,   Supply&Demand Zone/Order Blocks , Strong Imbalance,   HH/LL/HL/LH,    Fair Value Gap, FVG,  Premium  &   Discount   Zones, Fibonacci Retracement, OTE, Buy Side Liquidity, Sell Side Liquidity, BSL/SSL Taken, Equal Highs & Lows, MTF Dashboard, Multiple Time Frame, BigBar, HTF OB, HTF Market Structure
Easy Buy Sell Signal Alert
Franck Martin
4.86 (7)
Easy By Sell is a market indicator for opening and closing positions. It becomes easy to track market entries with alerts. It indicates trend reversal points when a price reaches extreme values ​​and the most favorable time to enter the market. it is as effective as a Fibonacci to find a level but it uses different tools such as an algorithm based on ATR indicators and Stochastic Oscillator. You can modify these two parameters as you wish to adapt the settings to the desired period. My othe
Dark Absolute Trend MT5
Marco Solito
5 (11)
Dark Absolute Trend   is an Indicator for intraday trading. This Indicator is based on   Trend Following  strategy but use also candlestick patterns and Volatility. We can enter in good price with this Indicator, in order to follow the main trend on the current instrument. It is advised to use low spread ECN brokers. This Indicator does   Not repaint   and   N ot lag . Recommended timeframes are M5, M15 and H1. Recommended working pairs: All. I nstallation and  Update Guide   -  Troubleshooting
Trend Sensor MT5
Yuriy Lyachshenko
该指标显示最合适的进入和退出点。它还显示所有信号的统计数据,以便更好地分析交易。 在这个指标的帮助下,你将能够更好地了解市场。 一旦趋势的力量开始减弱(这将显示在面板上),趋势线将引向水平位置 - 这是退出交易的信号。或者你可以在达到平均/中值利润水平时退出。 该指标是我自2010年以来的交易经验的结晶。 MT4的指标版本 特点 这个指标不会重新绘制。印在历史图表上的东西也将被实时打印出来。 它可以用于交易任何资产:加密货币、股票、金属、指数、商品和货币。 在所有的时间框架上都可以工作。 进入的信号出现在新蜡烛的开端。 退出交易的信号是暂定的,因为通常你可以用更大的利润关闭交易。 在左上方有一个详细的交易统计面板,它可以被最小化。 在M1到W1的时间框架上,一次显示趋势的方向和它的力量。 有一个轻量级的代码,所以它不需要加载,也不会降低终端的速度。 使用一个特殊的公式计算移动平均线,它决定了趋势的方向。 为了不错过交易的信号,你可以在警报窗口和推送中收到通知。 适用于所有级别的用户,从初学者到专家。 统计小组 取自信号历史的天数。 提供统计的信号总数。 盈利和亏损信号
PZ Support Resistance MT5
PZ TRADING SLU
4 (5)
厌倦了绘制支撑线和阻力线? 支撑阻力 是一个多时间指标,可以自动检测并绘制图表中的支撑线和阻力线,并具有非常有趣的变化:随着时间的推移测试价格水平及其重要性的提高,线变得越来越粗。 [ 安装指南 | 更新指南 | 故障排除 | 常见问题 | 所有产品 ] 一夜之间增强您的技术分析 无需浏览图表即可检测重要的价格水平 一目了然地识别所有价格水平的相对优势 每次交易最多可节省半小时的绘图线 指标显示所有价格水平的期限 指示器不重涂 过去和现在的价格水平因接近程度而崩溃,并根据当前的市场行为进行了调整。在动作发生的地方绘制了线条,而不一定在峰值处绘制了线条。 价格水平随着时间的推移而被拒绝,变得越来越暗 定期清除不重要的价格水平以避免噪音 可自定义的时间范围选择和崩溃因子 它实现了电子邮件/声音/推送警报的突破 输入参数 指标设置:指标将从当前时间段读取价格,但您可以选择另一个。例如,您可以在H4图表中显示D1支撑线和阻力线。您还可以使用 价格水平密度 参数选择在图表上显示多少价格水平。 颜色设置:根据重要性输入所需的支撑线和阻力线颜色。 标签设置:(可选)可以在指示器
MTF Supply Demand Zones MT5
Georgios Kalomoiropoulos
下一代自动化供需区。适用于任何图表的创新算法。所有区域都是根据市场的价格行为动态创建的。 两种类型的警报 --> 1) 当价格触及区域时 2) 当新区域形成时 你不会再得到一个无用的指标。您将获得一个完整的交易策略和经过验证的结果。     新的功能:     价格触及供需区时发出警报     创建新的供应/需求区时发出警报     推送通知警报     以点为单位的区域宽度标签     关于 MTF 的又一个时间表。因此,现在您将能够看到高于当前 3 个时间帧,而不是高于当前 2 个时间帧     启用/禁用警报/区域/MTF 功能的按钮 您获得的优势:     消除交易中的情绪。     客观化您的交易条目。     通过高概率设置提高您的利润。     节省绘图区域的时间。     像专业人士一样交易金融市场。     任何市场的即时多时间框架分析。 你在图表上看到了什么?     蓝色和红色矩形是当前时间范围的供需区。     虚线
[ MT4 Version ] Only the next 10 units at current price! Final price: $299 Are you tired of spending months on demo or live accounts to test your trading strategies? The Backtesting Simulator is the ultimate tool designed to elevate your backtesting experience to new heights. Utilizing Metatrader historical symbol information, it offers an unparalleled simulation of real market conditions. Take control of your testing speed, test ideas quickly or at a slower pace, and witness remarkable improve
Volume by Price MT5
Brian Collard
3.6 (5)
The Volumebyprice.com Indicator for MetaTrader 5 features Volume Profile and Market Profile TPO (Time Price Opportunity). Volume and TPO histogram bar and line charts. Volume Footprint charts. TPO letter and block marker collapsed and split structure charts. Static, dynamic and flexible range segmentation and compositing methods with relative and absolute visualizations. Session hours filtering and segment concatenation with Market Watch and custom user specifications. Graphical layering, posit
AW Trend Predictor MT5
AW Trading Software Limited
4.78 (58)
一个系统中趋势和故障水平的组合。先进的指标算法过滤市场噪音,确定趋势、进入点以及可能的退出水平。指标信号记录在统计模块中,您可以选择最合适的工具,显示信号历史的有效性。该指标计算获利和止损标记。 手册和说明 ->   这里 / MT4 版本 ->   这里 如何使用指标进行交易: 使用趋势预测器进行交易只需三个简单的步骤: 第 1 步 - 开仓 收到买入信号,成功率超过 70% 第 2 步 - 确定止损 通过相反的信号选择中继线 第 3 步 - 定义止盈策略 策略一:达到 TP1 时平仓 策略 2:达到 TP1 时平仓 50%,达到 TP2 时平仓剩余 50% 策略三:在趋势反转时平仓 好处: 从不重绘结果,信号严格位于蜡烛收盘时 它可以在顾问中使用 获利和止损标记 对交易策略或独立策略的重要补充 市场噪音过滤算法 适用于任何工具 统计模块: 为了更好地选择配对,请使用内置的统计计算。 计算交易 - 给出统计数据的信号总数 成功评级 - 达到 TP1 的信号百分比,或反转那些正获利的信号时的百分比 TakeProfit1 Hit - 达到 TP1 的信号百分比 TakeProfit2
成為突破者,隨著價格反轉,市場結構會改變利潤。 訂單突破者指示器可以識別趨勢或價格走勢何時接近枯竭並準備好逆轉。它會提醒您市場結構的變化,通常會在發生逆轉或重大回調時發生。 該指標使用專有計算來確定突破和價格動能。每當在可能的耗盡點附近形成新的高點時,指標就會繪製最後一個生成該高點的順序塊。然後,它將隨價格移動隨價格跟隨定單。然後,當價格轉向相反方向並突破該訂單塊時,它會提醒您,從而創建新的市場結構並開始趨勢或重大回調的可能逆轉。 訂單塊是在創建高/低之前的最後一個相反的彩色蠟燭,並且當價格跌破這些關鍵區域以下時,這表明趨勢可能會發生短期或長期反轉。 特徵 提醒您關鍵耗盡點的市場結構變化 價格接近耗盡水平時自動提取訂單塊 在一個方向繼續移動時,在價格後面跟踪定單,以提醒您最佳的反轉輸入 將顏色更改為純色塊,以顯示何時發生市場結構中斷。 適用於所有交易品種和時間範圍 內置集成的彈出窗口和電子郵件警報 策略和如何與定單破壞者指標進行交易 當斷路器塊發生時,您有兩個選擇。 看左邊!我們正在尋求供應/需求或支撐/阻力位嗎?市場結構轉變(逆轉)通常發生在價格重新測試舊水平或
Trend Reversal Scanner MT5
Reza Aghajanpour
5 (4)
**   All Symbols   x   All Timeframes   scan just by pressing scanner button ** *** Contact me after the purchase to send you instructions and add you in "Trend Reversal group" for sharing or seeing experiences with other users. Introduction: Trendlines are the most famous technical analysis in trading . Trendlines continually form on the charts of markets across all the different timeframes providing huge opportunities for traders to jump in and profit on the action. In the other hand,  The tre
作者的更多信息
Binary Absorption
Bogdan Kupinsky
5 (1)
Бинарный индикатор находит свечной паттерн "Поглощение" и рисует соответствующий сигнал для входа рынок. Имеет встроенные фильтры и панель для просчета количества успешных сделок. Особенности Работает для всех валютных пар и любых таймфреймов. Индикатор рассматривает комбинацию из 2-х или 3-х свечей в зависимости от настроек. Имеется возможность фильтровать сигналы путем настройки количества свечей одного цвета (тренда) до образования паттерна. Присутствует панель для отображения точности
OuterIndiTool
Bogdan Kupinsky
5 (1)
Это специальная утилита, для подключения внешнего индикатора к торговой панели . Она позволяет получать данные из буфера индикатора и рисует стрелочные объекты для передачи их в торговую панель. Входные параметры Number of call buffer - номер индикатора для покупки Number of sell buffer -номер индикатора для продажи Indicator window - окно индикатора Indicator position in list - позиция индикатора в списке Default value of indicator - значения по умолчанию для индикатора Show information - пока
FREE
Price Action Free
Bogdan Kupinsky
This indicator looks for 3 rather strong patterns: Spinning Top pattern Hammer or Hanging Man Inverted Hammer or Shooting Star These patterns may indicate a trend continuation or its reversal, depending on the location of the patterns. Input parameters Distance - distance between the signal and the formed signal Note: the higher the timeframe, the greater the value should be used in Distance to display the signal correctly Indicator Features Suitable for any currency pair Operating timeframe
FREE
This is a demo version of the Candle Absorption Full indicator. It has limitations on operation. This indicator detects the Engulfing candlestick pattern and draws the corresponding market entry signal. Features It works only with EURUSD on timeframes M1 and M5. The indicator analyzes a combination of 2 or 3 candlesticks depending on settings. The number of pre-calculated bars (signals) is configurable. The indicator can send an alert to notify of a found signal. Signal can be filtered by sett
FREE
Binary Absorption Demo
Bogdan Kupinsky
5 (2)
Бинарный индикатор находит свечной паттерн "Поглощение" и рисует соответствующий сигнал для входа рынок. Имеет встроенные фильтры и панель для просчета количества успешных сделок. Демо версия является ознакомительной, в ней нет возможности изменять параметры. Полная версия . Особенности Работает для всех валютных пар и любых таймфреймов. Индикатор рассматривает комбинацию из 2-х или 3-х свечей в зависимости от настроек. Имеется возможность фильтровать сигналы путем настройки количества свеч
FREE
Binary BB Demo
Bogdan Kupinsky
3 (1)
Стрелочный индикатор, выдающий сигнал при пересечении канала боллинждера. Сигналы выдаются в виде стрелок и подходят для торговли бинарными опционами.  Входные параметры Period of BB -  период боллинджера Shift of BB  - смещение боллинджера Deviation of BB  - отклонение боллинджера Inform about finding the signal  - параметр, отвечающий за получение уведомлений (Alert) о найденном сигнале. По умолчанию - да
FREE
RSI Binary Demo
Bogdan Kupinsky
3 (1)
Индикатор, показывающий моменты пересечения важных уровней индикатора RSI. Может быть использован для поиска моментов пересечения уровней для успешной торговли на отскок или по тренду. Входные параметры Inform about finding the signal  - параметр, отвечающий за получение уведомлений (Alert) о найденном сигнале. По умолчанию - нет RSI period  - Период RSI для работы RSI Max  - Значение максимальной границы RSI RSI Min  - Значение минимальной границы RSI
FREE
Простая утилита показывающая время до формирования свечи. Может быть очень полезна, если вход в сделку завязан на начале/завершении свечи. Демо версия работает на валюте EURUSD Входные параметры FontColor  - Цвет текста. FontSize  - Размер текста. FontName  - Шрифт текста. TimeOnly  - Указывать только время, без дополнительного текста. TypeOfDrawing  - Тип отображения информации Важно :  возможна задержка в 1 сек.
FREE
Binary MACD Demo
Bogdan Kupinsky
Индикатор, показывающий момент преодоления нулевой отметки индикатора MACD. Индикатор стрелочный и может быть использован для торговли бинарными опционами. Входные параметры Period of SMA1  - Период 1 скользящей средней Period of SMA2 -  Период 2 скользящей средней Period of SMA3 -  Период 3 скользящей средней Inform about finding the signal  - подавать уведомление, при нахождении сигнала
FREE
BidAsk indi
Bogdan Kupinsky
Простой индикатор, показывающий цены Bid и Ask. Есть настройки отображения информации и возможность перетаскивать панель. Индикатор используется для наглядного отображения цен покупки и продажи актива. Входные параметры : Support - Ссылка, на помощь проекту heigth - Высота формы width - Ширина формы size - Размер текста bidcol - Цвет текста bid askcol - Цвет текста
FREE
Простая утилита показывающая время до формирования свечи. Может быть очень полезна, если вход в сделку завязан на начале/завершении свечи. Входные параметры FontColor  - Цвет текста. FontSize  - Размер текста. FontName  - Шрифт текста. TimeOnly  - Указывать только время, без дополнительного текста. TypeOfDrawing - Тип отображения информации Важно :  в работе программы возможна задержка в 1 секунду. 
Binary 2 SMA Demo
Bogdan Kupinsky
Стрелочный индикатор, выдающий сигнал при пересечении 2 SMA. Сигналы выдаются в виде стрелок и подходят для торговли бинарными опционами.  Это демо версия индикатора, в не нельзя изменять параметры. Полная версия .  Входные параметры First period-  период 1 MA Second period -  период 2 MA Invert signals -  Возможность давать инвертированные сигналы (для работы по тренду) Candles to count  - количество свечей для подсчета статистики Expiration - время экспирации сигнала Length - расстояние
FREE
Candle Absorption Full
Bogdan Kupinsky
5 (1)
This indicator detects the Engulfing candlestick pattern and draws the corresponding market entry signal. Features It works on all pairs and timeframes. The indicator analyzes a combination of 2 or 3 candlesticks depending on settings. The number of pre-calculated bars (signals) is configurable. The indicator can send an alert to notify of a found signal. Signal can be filtered by setting the number of candlesticks of the same color (trend) preceding the pattern formation. The indicator has an
Price Action Full
Bogdan Kupinsky
This indicator looks for 3 rather strong patterns: Spinning Top pattern Hammer or Hanging Man Inverted Hammer or Shooting Star These patterns may indicate a trend continuation or its reversal, depending on the location of the patterns. Input parameters Zero - consider candles without a body Multiplier for hammerhigh - multiplier for the larger shadow of the Hammer Multiplier for hammerlow - multiplier for the smaller shadow of the Hammer Multiplier for wolf - multiplier for the shadows of the
Binary RSI
Bogdan Kupinsky
Индикатор, показывающий моменты пересечения важных уровней индикатора RSI. Может быть использован для поиска моментов пересечения уровней для успешной торговли на отскок или по тренду. Подходит для бинарной торговли, т.к. имеется возможность посчитать точность сигналов, в зависимости от времени экспирации. Входные параметры Inform about finding the signal  - параметр, отвечающий за получение уведомлений (Alert) о найденном сигнале. По умолчанию - да Show Panel - Показать/ скрыть панель Period
Binary Bollinger
Bogdan Kupinsky
Стрелочный индикатор, выдающий сигнал при пересечении канала боллинждера. Сигналы выдаются в виде стрелок и подходят для торговли бинарными опционами.  Входные параметры Period of BB - период боллинджера Shift of BB - смещение боллинджера Deviation of BB - отклонение боллинджера Type of BB Signals - тип поиска сигналов Invert signals  - Возможность давать инвертированные сигналы (для работы по тренду) Inform about finding the signal  - параметр, отвечающий за получение уведомлений (Alert) о н
Binary 2SMA
Bogdan Kupinsky
Стрелочный индикатор, выдающий сигнал при пересечении 2 SMA. Сигналы выдаются в виде стрелок и подходят для торговли бинарными опционами.  Входные параметры First period-  период 1 MA Second period -  период 2 MA Invert signals -  Возможность давать инвертированные сигналы (для работы по тренду) Candles to count  - количество свечей для подсчета статистики Expiration - время экспирации сигнала Length - расстояние для сигналов Особенности :  Возможность использовать инверсию сигналов Возможн
Binary MACD
Bogdan Kupinsky
Индикатор, показывающий момент преодоления нулевой отметки индикатора MACD.  Подходит для бинарной торговли, т.к. имеется возможность посчитать точность сигналов, в зависимости от времени экспирации. Входные параметры Period of SMA1  - Период 1 скользящей средней Period of SMA2 -  Период 2 скользящей средней Period of SMA3 -  Период 3 скользящей средней Price Type - Тип цены, используемый индикатором MACD Invert signals  - Возможность давать инвертированные сигналы (для работы по тренду) Infor
Help Panel
Bogdan Kupinsky
Данная панель предназначена для удобного совершения сделок в платформе Metatrader. Она позволяет с легкостью открывать позиции, устанавливать стоп лосс и тэйк профит, использовать трейлинг стоп и тд.. Входные параметры : Magic - уникальный номер эксперта Lot step - шаг изменения лота Custom - произвольная сумма для высчитывания риска Risk Value  - тип поиска значения риска (в %) Функции панели : Открытие sell и buy позиций Возможность установки profit / loss для позиции, в том числе и графи
筛选:
无评论
回复评论