Ara volatility
- 指标
- Anatolii Zainchkovskii
- 版本: 1.0
- 激活: 10
Ara volatility - это индикатор волатильности, показывает силу трендового движения. Удобен в использовании. Не перерисовывается. Для расчёта индикатора была применена авторская разработка.
Индикатор будет вам очень полезен как самостоятельный инструмент показывающий периоды тренда или затишья. Также индикатор может служить как дополнительный фильтр к вашей торговой системе.
Ara volatility очень прост в настройках, всего один параметр Period Volatility . Рекомендуемые значения от 24 до 1000.

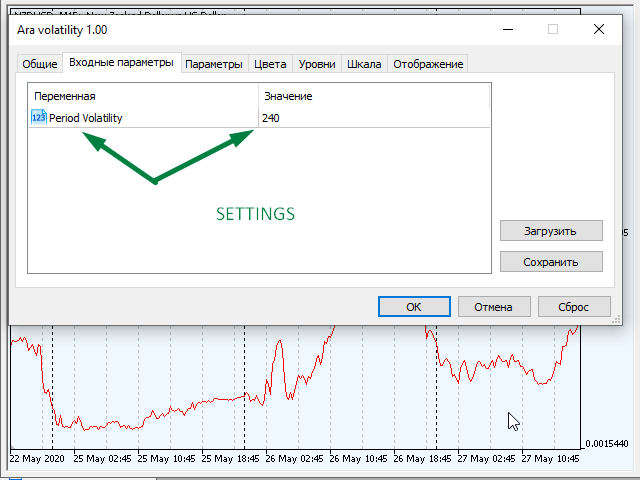

Действительно - проверил настройки для графика М5 период 240. для графика Н1 период 120. Отлично показывает Фазу рынка- Тренд или флетовая ситуация - очень полезный индикатор.