Bollinger Bands Dashboard MT5
- 指标
- Taras Slobodyanik
- 版本: 3.80
- 更新: 14 三月 2024
- 激活: 10
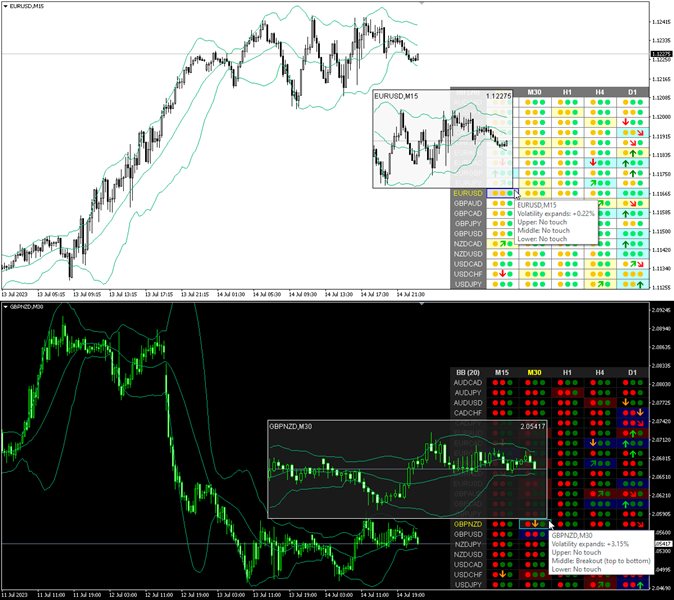
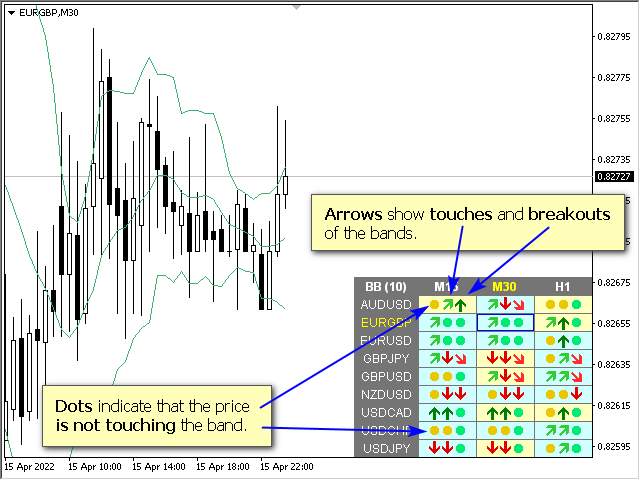
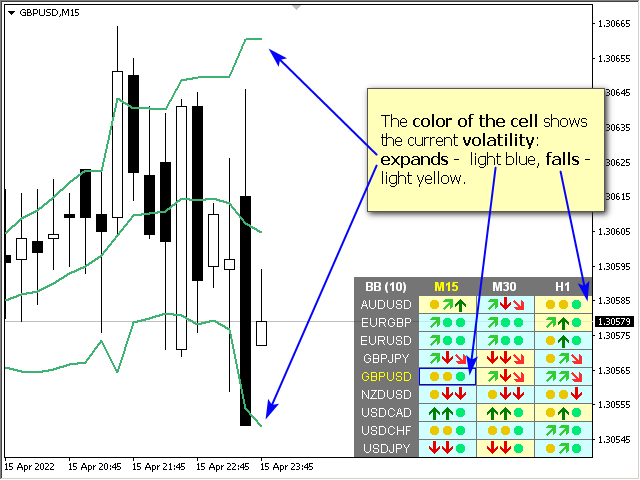
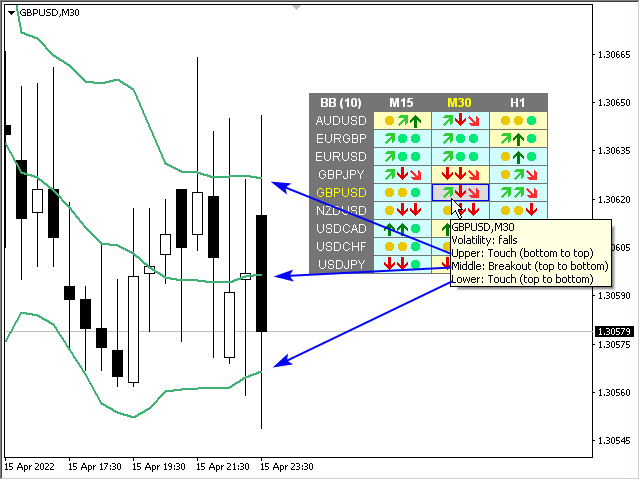
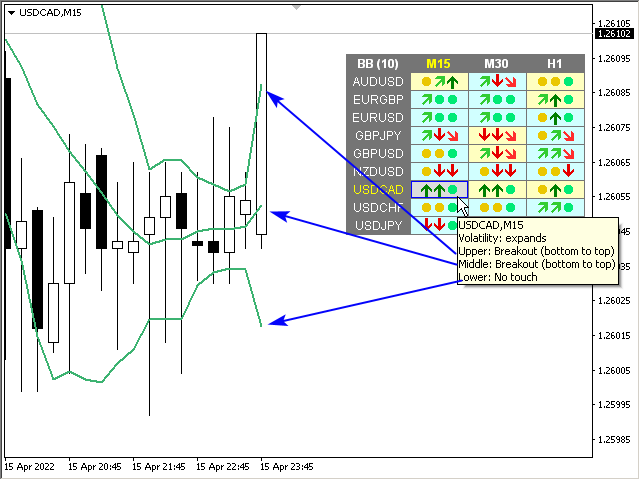
布林带指标的多货币和多时间框架修改。 在仪表板上,您可以看到布林带的突破和触及。 在参数中,您可以指定任何所需的货币和时间范围。 当价格触及布林线、当前波动率发生变化(扩大或下跌)以及价格触及所有布林线时,该指标还可以发送通知。 通过单击带有句点的单元格,将打开该符号和句点。 这是 MTF 扫描仪。
默认情况下,从图表中隐藏仪表板的键是“D”。
参数
Bollinger Bands Settings
Averaging period — 计算指标的平均周期。
Standard deviations — 与主线的标准差数。
Bands shift — 指标相对于价格图表的移动。
Applied price — 用于计算的价格。
Show BB on the current chart — 在当前图表上显示 BB。
仪表板
Clear the chart at startup — 启动时清除图表。
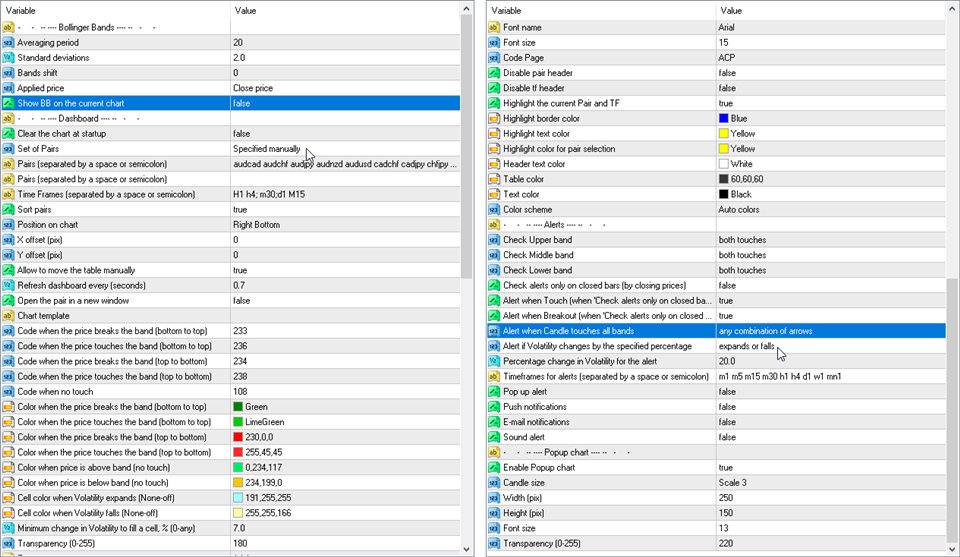
Set of Pairs — 符号集
— Market Watch — 来自“市场观察”的配对。— Specified manually — 在参数“Pairs”中手动指定对。— Current pair — 仅显示当前对。
Pairs (separated by a space or semicolon) — 由空格或分号分隔的符号列表。 货币名称的书写方式应与经纪商的名称完全相同,并保留大小写和前缀/后缀。
Time Frames (separated by a space or semicolon) — 由空格或分号分隔的时间范围列表(多个时间范围)。
Sort pairs — 对对列表进行排序。
Position on chart — 在图表上显示面板的角落。
X offset (pix) — 沿 X 轴移动面板;
Y offset (pix) — 沿 Y 轴移动面板;
Refresh dashboard every (seconds) — 所有货币对和时间范围的更新周期。
Open the pair in a new window — 通过单击在新图表窗口中打开交易品种。
Chart template — 图表模板的名称(如果图表在新窗口中打开)。
Code when touch from bottom to top (price above band) — 从下到上触摸且价格高于波段时的交易品种代码;
Code when touch from bottom to top (price below band) — 从下到上触摸且价格低于波段时的交易品种代码;
Code when touch from top to bottom (price below band) — 从上到下触摸且价格低于波段时的交易品种代码;
Code when touch from top to bottom (price above band) — 从上到下触摸且价格高于波段时的交易品种代码;
Code when no touch — 无触摸时的符号代码;
Color when touch from bottom to top (price above band) — 从下到上触摸时的颜色(价格高于带);
Color when touch from bottom to top (price below band). With clrNONE it will just lighten the touch color — 从下到上触摸时颜色(价格低于带)。 使用 clrNONE 它只会减轻触摸颜色;
Color when touch from top to bottom (price below band) — 从上到下触摸时的颜色(价格低于带);
Color when touch from top to bottom (price above band). With clrNONE it will just lighten the touch color — 从上到下触摸时着色(价格高于带)。 使用 clrNONE 它只会减轻触摸颜色;
Color when price is above band (no touch) — 价格高于区间时显示颜色(无触摸);
Color when price is below band (no touch) — 价格低于区间时显示颜色(无触摸);
Cell color when Volatility expands (None-off) — 波动率扩大时的单元格颜色(无关闭)
Cell color when Volatility falls (None-off) — 波动率下降时的单元格颜色(无关闭)
Minimum change in Volatility to fill a cell, % (0-any) — 填充单元格的波动性的最小变化,%(0-任意)
Transparency (0-255) — 透明度(0-255);
Font name — 字体名称;
Font size — 字体大小。
警报
Check Upper band — 追踪布林带上轨线;
Check Middle band — 追踪布林线中带;
Check Lower band — 追踪布林带下轨;
Check alerts only when the candle is closed — 仅在蜡烛关闭时检查警报;
— disable — 禁用— between Upper and Lower bands — 上限和下限之间— outside Bands — 乐队外— any close — 任何接近的
Alert when Touch (when 'Check alerts only on closed bars') — 触摸时发出警报(当“仅在关闭的栏上检查警报”时)
Alert when Breakout (when 'Check alerts only on closed bars') — 突破时发出警报(当“仅在已关闭的柱上检查警报”时)
Alert when Candle touches all bands — 当蜡烛触及所有带时发出警报
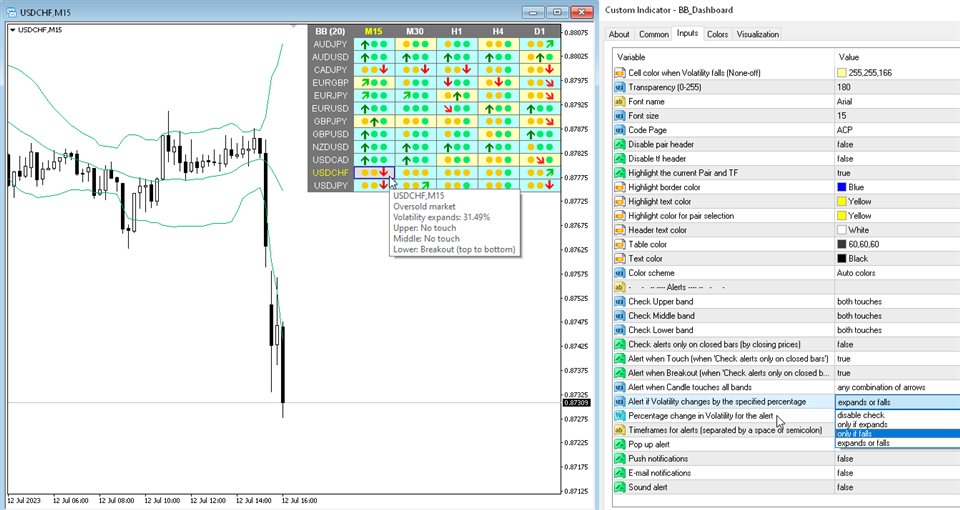
Alert if Volatility changes by the specified percentage — 如果波动率变化指定的百分比,则发出警报
Percentage change in Volatility for the alert — 警报波动率变化百分比
Timeframes for alerts (separated by a space or semicolon) — 警报的时间范围(用空格或分号分隔)。
Pop up alert — 弹出提醒;
Push notifications — 推送通知;
E-mail notifications — 电子邮件通知;
Sound alert — 声音警报。
弹出图表
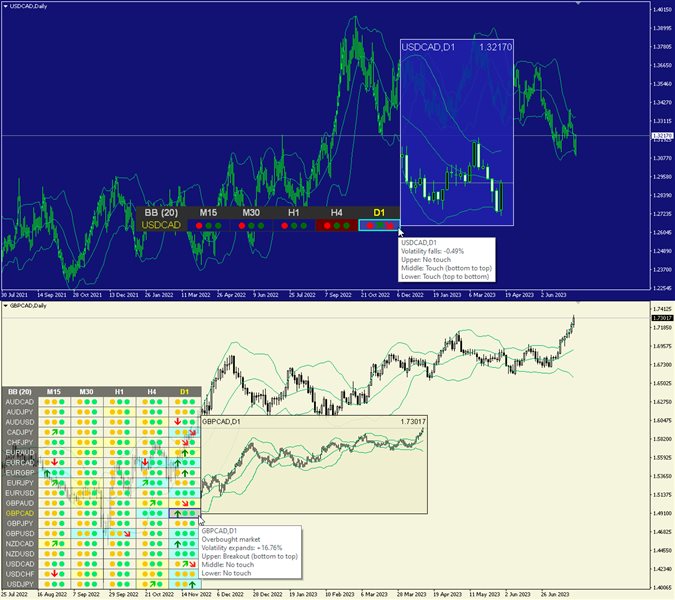
Enable Popup chart — 启用弹出图表
Candle size — 蜡烛尺寸
Width (pix) — 宽度(像素)
Height (pix) — 高度(像素)
Font size — 字体大小
Transparency (0-255) — 透明度(0-255)










It is not the typical Bollinger Bands Dashboard, it is a quality tool, the information is displayed in an efficient and intuitive way, it is well organized, easy to interpret, totally customizable, it works and runs very well. The user experience with the author is top notch, he is very responsive and really cares about what he offers, he has great ideas and talent to spare.