• 概述
  • 评论 (4)
  • 评论
  • 新特性

Boundaries Weekly

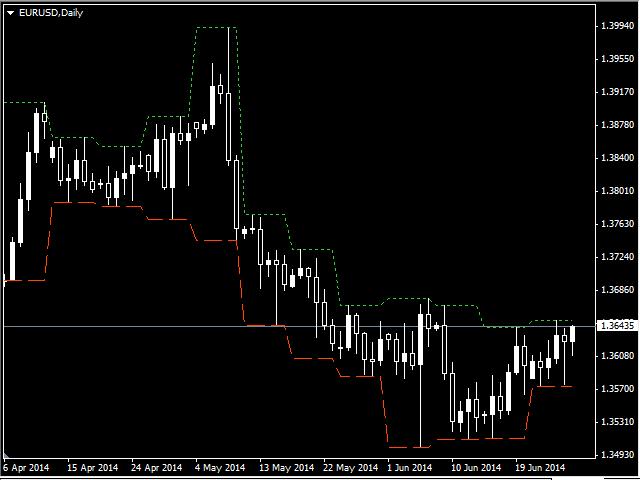
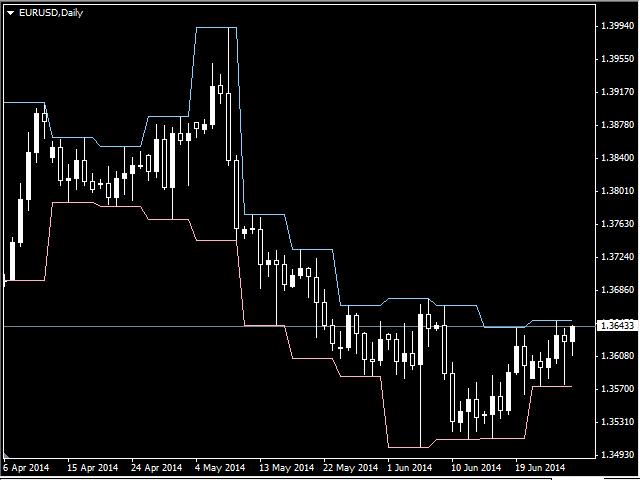
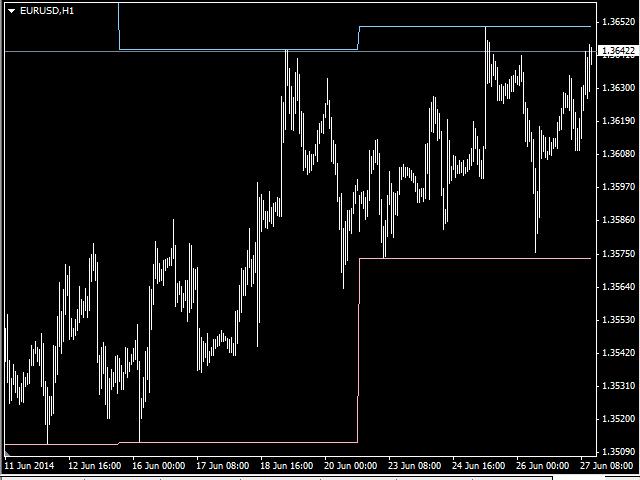
This indicator works exactly the same as the Boundaries indicator, but here as a free demo that only shows the high and low of the week.

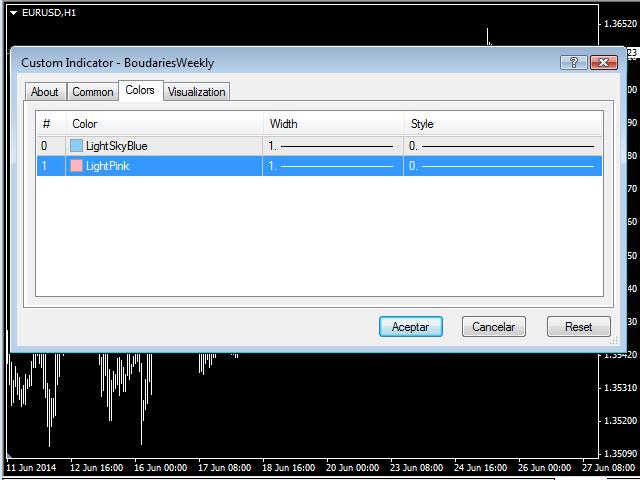
As the Boundaries indicator does, this indicator can work with any symbol. In the Colors tab you can set the color for the Upper and Lower boundaries.

Please review the pics or watch the Boundaries indicator video to better understand how it works.

推荐产品
Alpha Trend sign Alpha Trend sign 是我么长期以来非常受欢迎的交易工具,它可以验证我们的交易系统,并且明确的提示交易信号,并且信号不会漂移。 主要功能: •  根据市场显示活跃区域,根据指标可以很直观的判断当前行情是属于趋势行情,还是震荡行情。    并根据指标的指示箭头切入市场,绿色箭头提示买入,红色箭头提示卖出。 •  建议使用5分钟以上的时间周期进行交易,避免因为小周期波动出现频繁的交易信号。 •  您也可以开启信号提示,以免错过最佳的交易时机。 •  本指标不但可以很好的预测趋势行情,也可以在宽幅震荡行情中获利。 •  本指标本着大道至简的原则,适合不同阶段的交易者使用。 注意事项: •  Alpha Trend sign 有明确的进出场信号,不建议逆势操作,以免造成损失。 •  Alpha Trend sign 是特别成熟的指标,我们团队人手一个,使用它可以实现稳定盈利。     
Trend Flasher
Amarnath K M
Trend Flasher Trend is your friend is the age old saying quote in trading arena, there are though many ways to gauge the trend and its direction, more scientific measure and logically meaningful will be an ATR break outs to identify and spot the trend and its acceleration, so we created this easy to use trend identification panel and optimized super trend based multi time frame panel entry system to aid and help the traders to make their trading decision. Unique Features of Trend Flasher 1
Trend PA
Mikhail Nazarenko
5 (3)
The Trend PA indicator uses   Price Action   and its own filtering algorithm to determine the trend. This approach helps to accurately determine entry points and the current trend on any timeframe. The indicator uses its own algorithm for analyzing price changes and Price Action. Which gives you the advantage of recognizing, without delay, a new nascent trend with fewer false positives. Trend filtering conditions can be selected in the settings individually for your trading style. The indicator
AndInvest Impulse
Bruno Ravardiere De Oliveira Goncalves
Em uma negociação no Mercado Financeiro nada é mais importante que saber o momento certo de entrar em uma negociação. O AndInvest Impulse auxilia traders a capturar o momento exato de abrir uma negociação, para isto ele desenha topos e fundos facilitando a leitura do Price Action e após um breve momento de realização do mercado ele identifica o retorno da ponta compradora ou vendedora de força antecipada e sem repintura. Comprovação de Resultados: https://youtu.be/CA1_ZtZY0vk Funciona em qualque
Limitless MT4
Dmitriy Kashevich
Limitless MT4 is a universal indicator suitable for every beginner and experienced trader. works on all currency pairs, cryptocurrencies, raw stocks Limitless MT4 - already configured and does not require additional configuration And now the main thing Why Limitless MT4? 1 complete lack of redrawing 2 two years of testing by the best specialists in trading 3 the accuracy of correct signals exceeds 80% 4 performed well in trading during news releases Trading rules 1 buy signa
Oscillator The Trend Signal indicator is an indicator designed to generate trend signals. It uses its own set of algorithms and the moving average indicator to find signals. It has the feature of filtering the signals with the channel system. In this way, it tries to improve the quality of the signals. Features and Trade strategy There are two channels in the indicator. These channels are 70 and -70 channels. You will reach the signals without losing time thanks to the alarm features found on
Mk R
Can Pei Pu
MK_R It is based on contrary patterns for EURUSD.  Basically, it will entry using the condition of 1 buy wave and 6 sell wave of Granville's law. The EA does not use indicators, grid, martingale, arbitrage.  The EA has been proven to be profitable in the six months of 2020 and is particularly suitable for the current EURUSD market since mid-December 2020. Monitoring: https://www.mql5.com/en/signals/789229 Timeframe is M5. EA needs M1 chart,M5 chart,M15 Chart,H1 chart,H4 chart. Maxium Sp
AMAN Signals
Niravkumar Maganbhai Patel
Introducing AMAN Signals. An MT4 Indicator that predicts the trend where the prices are heading! Indicator parameters Period 1 : the number of bars used for the indicator calculations. Proper values - Above 21. Multiplier 1 : Proper values - from: 5. Period 2 : the number of bars used for the indicator calculations. Proper values - Above 21. Multiplier 1 : Proper values - from: 5. Using the AMAN Signals FAST Indicator: Green: Buy or Bullish Candle Red: Sell or Bearish Candle Strength Percent
Five Candles Pattern
Miguel Antonio Rojas Martinez
The "Five Candle Pattern" indicator is a novel way to see the market, because with it we can compare and/or seek training or the pattern of the past 4 or 5 Candles, and identify them in the same graph, to view your behavior at an earlier time. The indicator creates a pattern of those 4 or 5 candles and searches backward, identifies, and marks the same formation or pattern. With that information you adjust the strategy that is operating, or create a new one, because you can compare the past devel
Signal From Level
Yaroslav Varankin
Binary Options Support Resistance Indicator This indicator is designed for binary options trading and effectively shows retracements from support and resistance levels. Signals appear on the current candle. A red arrow pointing downwards indicates a potential selling opportunity, while a blue arrow pointing upwards suggests buying opportunities. All that needs adjustment is the color of the signal arrows. It is recommended to use it on the M1-M5 timeframes as signals are frequent on these timef
ADR Scalping Indicator MT4
Robert Mathias Bernt Larsson
这很容易成为最容易被忽视的指标,它可以为您提供对价格行为的最大洞察力。这是我自己使用的唯一指标。 该指标可让您深入了解今天的价格走势,以及最有可能朝哪个方向移动。 ADR 代表平均每日范围。如果您在盘中交易或剥头皮,您必须知道价格将移动多少的范围。 假设价格已经移动了当天正常水平的一半,并且处于价格行动的底部,价格更有可能继续下跌,而不是再次一路上涨以达到平均每日范围。价格总是寻求在平均每日范围内移动。 您还将获得动态支撑和阻力。当价格移动到平均范围时,您可以向中间交易。 该指标还将让您知道价格是否可能从趋势线反弹。因此,如果您喜欢使用趋势线进行交易,这就是您的指标! 你会得到 3 种类型的范围。 1. 黑色区间 - 基于当前价格的当前区间,但如果价格波动超过平均水平,则会吸引顶部或底部。当价格移动超过 ADR 的 50% 时,该范围最终将与其他两个范围之一保持一致。 2. 绿色区间 - 如果我们从今天的低点计算,价格平均会移动多远? 3. 红色范围 - 如果我们从今天的高点计算,价格平均会移动多远?
Crosskalp1
Mikhail Bilan
Добрый День уважаемые трейдеры!  Вашему вниманию индикатор созданный и работающий на базе трендовика ADX,  для торговли на смене направления движения который учитывает коррекцию и даёт возможность на ней заработать.  Применяю этот индикатор для скальпинга. Рекомендую таймфреймы от 15 ти минутного(М15) до часового (Н1) периодов.  Красный кружок сигнал на продажу- Sell) Зелёный кружок  сигнал на покупку Buy) Чем меньше ваш таймфрейм тем меньше пунктов вы зарабатываете.   Важно выставлять стопы! !В
Srcci
Jorge Alejandro Agudelo Alvarez
SRCCI An indicator based on RCCI , is a combination of the RSI and CCI indicators, adapted into three levels categorized into A, B and C. Taking advantage of their combination to maintain a controlled filter and applicable to different strategies. The RSI (Relative Strength Index) is one of the most popular and used oscillators to operate in the markets. It is a valuable tool to measure both the speed of price changes and the possible levels of overbought or overbought. The CCI (Commodity Channe
Big Trend Signal   indicator is designed for trend and signal trading. This indicator generates trend signals.  It uses many algorithms and indicators to generate this signal. It tries to generate a signal from the points with the highest trend potential. This indicator is a complete trading product. This indicator does not need any additional indicators.  You can only trade with this indicator. The generated signals are displayed on the graphical screen.  Thanks to the alert features you can ge
Trend Direction ADX indicator for MT4
Renaud Herve Francois Candel
Trend Direction ADX indicator for MT4 Trend Direction ADX is part of a series of indicators used to characterize market conditions. Almost any strategy only work under certain market conditions. Therefore it is important to be able to characterize market conditions at any time: trend direction, trend strength, volatility, etc.. Trend Direction ADX is an indicator to be used to characterize trend direction: trending up trending down ranging Trend Direction ADX is based on ADX standard indi
This indicator works on MT4 and is very easy to use. When you receive a signal from it, you wait for that candle with the signal to close and you enter your trade at the beginning of the next new candle . A red arrow means sell and a green arrow means buy. All arrows comes with Alert  like for easy identification of trade signal. Are you okay with that? 1 minute candle 1 minute expire
该指标最多绘制 6 个级别,可以根据交易者的要求启用/禁用以使图表更清晰 这 6 个级别分为 2 组:高和低 对于每组,可以选择不同的时间范围 它基于先前高低反转的策略,因为它认为当价格达到每日、每周或每月高低时,价格通常会在更小的时间范围内(如 5 分钟)显示拒绝 特征 : - 在单个图表中跟踪多达 6 个时间帧高低点 - 在这些级别设置警报,邮件、推送或终端警报,当价格触及这些级别时,您将立即收到警报 - 自定义关卡样式,包括线条样式、宽度、颜色等 - 班次:想要跟踪或研究第 2 天或第 3 天的高低?您可以将 shift 设置为 2 用于 2nd Bar 的 High Low 或 3 设置为 3rd Bar 的 High Low 等等。 该指标最多绘制 6 个级别,可以根据交易者的要求启用/禁用以使图表更清晰 这 6 个级别分为 2 组:高和低 对于每组,可以选择不同的时间范围 它基于先前高低反转的策略,因为它认为当价格达到每日、每周或每月高低时,价格通常会在更小的时间范围内(如 5 分钟)显示拒绝 特征 : - 在单个图
The Polarized Fractal Efficiency (PFE) was introduced by Hans Hannula in 1994. The indicator was intended to quantify the efficiency of price movement and  how trendy or choppy  the recent past price action has been. This is calculated by contrasting the price traveled in the window of study  against the total accumulation of movements during the same period of time. For example: If in 10 days, an active raised from 50 to 100, by increasing it's value 5 points or dollars each session, the effici
POWER TO GET WEALTHY TRADING SYSTEMS.  NON REPAINT REVERSAL ARROW AND CHANNEL  Intra-Day trading and Scalping Strategy:   Designed for fast and accurate day trading and short-term trades. Day and Swing Trading Strategy:   Can be used as a reliable tool for day and swing traders who aim for the big moves of the price. Multi Currencies and Markets:   Works on different instruments and markets with its reliable precision. Multi Timeframes:   Can be used on multiple timeframes with good perfor
PABT Pattern Indicator - it's classical system one of the signal patterns. Indicator logic - the Hi & Lo of the bar is fully within the range of the preceding bar, look to trade them as pullback in trend. In the way if indicator found PABT pattern it's drawing two lines and arrow what showing trend way.  - First line - it's entry point and drawing at: 1. On the high of signal bar or on middle of the signal bar (depending from indicator mode) for buy; 2. On the low of signal bar or on middle of t
This Indicator is use the ZigZag to calculate the Upper and  Lower Bound and the uptrend and the downtrned. Red for downtrend, Green for uptrend and Yellow is for the horizontal trend this horizontal trend also bookmarked the upper limited and the lower limited the the price swings.  Or in simple the Support and the Resistance level. However, You may use the Heikin Ashi to confirm the trend of the buy sell signal above. I cannot guarantee the win rate, Nevertheless, you must study well the timef
TrendMaestro
Stefano Frisetti
5 (3)
note: this indicator is for METATRADER4, if you want the version for METATRADER5 this is the link:  https://www.mql5.com/it/market/product/108106 TRENDMAESTRO ver 2.4 TRENDMAESTRO recognizes a new TREND in the bud, he never makes mistakes. The certainty of identifying a new TREND is priceless. DESCRIPTION TRENDMAESTRO identifies a new TREND in the bud, this indicator examines the volatility, volumes and momentum to identify the moment in which there is an explosion of one or more of these data a
Multi Andrew PitchFork
Kourosh Hossein Davallou
5 (1)
ANDREW’S PITCHFORK TRADING STRATEGY       Essentially, Andrew’s Pitchfork is a tool for drawing price channels. While two lines surrounding price are usually enough to draw a channel, the Pitchfork has an extra line. It is the median line or the handle of the Pitchfork.     The median line is central to this trading method. This is why Andrew’s Pitchfork is also known as the Median Line Method. TRADING RULES      There are many ways to trade using Andrew’s Pitchfork but the basic idea is that pr
Owl smart levels
Sergey Ermolov
4.34 (35)
MT5版本  |  FAQ Owl Smart Levels Indicator   是一個完整的交易系統,包含   Bill Williams   的高級分形、構建正確的市場波浪結構的 Valable ZigZag 以及標記準確入場水平的斐波那契水平等流行的市場分析工具 進入市場和地方獲利。 策略的详细说明 指示灯使用说明 顾问-贸易猫头鹰助手助理 私人用户聊天 ->购买后写信给我,我会将您添加到私人聊天中,您可以在那里下载所有奖金 力量在於簡單! Owl Smart Levels   交易系統非常易於使用,因此適合專業人士和剛開始研究市場並為自己選擇交易策略的人。 策略和指標中沒有隱藏的秘密公式和計算方法,所有策略指標都是公開的。 Owl Smart Levels 允許您快速查看進入交易的信號,突出顯示下訂單的水平並向您發送有關已出現信號的通知。 優點很明顯: 清楚地顯示主要和更高時間框架的趨勢方向。 指示儀器信號的出現。 標記開單、止損設置和固定利潤的水平。 沒有多餘的,只有必要的結構! ZigZag   表示全球趨勢的方向,因此也表示貿易方向。 市場反轉點的短線清楚地表明在
Welcome to enhanced pattern detection with the Double Top and Bottom Pattern Scanner ! Transform your trading approach with this powerful MT4 indicator designed for efficient pattern scanning and actionable alerts. Key Features: Advanced Zig Zag Pattern Detection : The Double Top and Bottom Pattern Scanner uses the zig zag pattern to detect tops and bottoms. It identifies points where the price bounces back twice from the same level after a long trend, signaling potential market reversals. Real
GMMA Trade X is an EA based on GMMA. GMMA parameters such as MovingAveragePeriod1-24, MovingAverageMAShift1-24, MovingAverageShift1-24 and CandlestickShift1-24 can be adjusted. GMMA Trade X applies BTN TECHNOLOGY's state-of-the-art intelligent technology to help you create optimal results for your trades. May your dreams come true through GMMA Trade X. Good luck. = == == Inquiries = == == E-Mail:support@btntechfx.com
BSA Indicator
Ahmet Metin Yilmaz
BSA indicator is a ZigZag based indicator. This indicator is used to find the reversal level of the price. You can use the existing risk ratio and calculation timeframe in the entries by optimizing them according to your usage preference.  In lower time frames, the indicator can repaint. For healthier results, you can detect the least repainting by observing for a while according to the graphic you will apply.
True Magic Oscillator
Muhammed Emin Ugur
The   True Magic Oscillator   indicator is designed for signal trading. This indicator generates trend signals. It uses many algorithms and indicators to generate this signal. It tries to generate signals from the points with the highest trend potential. This indicator is a complete trading product. This indicator does not need any additional indicators. The indicator is never repainted. The point at which the signal is given does not change.         Features and Recommendations Wor
CRAZY SALE! Was 250, NOW 50 USD till the end of MAY!!! --->  Check all the other products  <--- The WTR Dynamic Range Indicator is a powerful and deeply customizable range indicator that takes in account the average upward and downward movement of the price in the past trading days.  This fully customizable indicator can be setted for a lot of uses and cases:  • Trend trading on level breakouts  • Spotting high probability targets for Take Profits • Setting a multiple targets for position
Trend Sniper Super Indicator is one of the best indicator which can provide you will perfect signals for short term and long term trades. This indicator is suitable for both scalping and swing trading strategies. The indicator is over 85% accurate. It uses terminal Message Alerts, Emails and Push notifications to your mobile device to inform you about the new trading opportunities and it will calculate the take profit and stop loss level for you. All you will need to do is to place a trade. Subs
该产品的买家也购买
Gann Made Easy
Oleg Rodin
4.81 (85)
Gann Made Easy 是一个专业且易于使用的外汇交易系统,它基于使用先生理论的最佳交易原则。 W.D.江恩。该指标提供准确的买入和卖出信号,包括止损和获利水平。您甚至可以使用推送通知在旅途中进行交易。 购买后请联系我!我将免费与您分享我的交易技巧和丰厚的红利指标! 您可能已经多次听说过江恩交易方法。通常 Gann 的理论不仅对于新手交易者而且对于那些已经有一定交易经验的人来说都是非常复杂的东西。这是因为江恩的交易方法在理论上并不那么容易应用。我花了几年时间来完善这些知识,并将最好的原则应用到我的外汇指标中。 该指标非常易于应用。您所需要的只是将其附加到您的图表并遵循简单的交易建议。该指标不断进行市场分析工作并寻找交易机会。当它检测到一个好的入口点时,它会为您提供一个箭头信号。该指标还显示止损和获利水平。 换句话说,当您像先生一样进行交易时,该指标会为您提供最佳江恩建议。江恩亲自告诉你此时此刻该做什么。但最好的部分是您不需要了解任何有关江恩交易原则的知识,因为该指标会为您完成整个市场分析工作。
- Real price is 80$ - 40% Discount ( It is 49$ now ) Contact me for instruction, add group and any questions! Related Products:  Bitcoin Expert , Gold Expert Introduction The breakout and retest strategy is traded support and resistance levels. it involves price breaking through a previous level.  The break and retest strategy is designed to help traders do two main things, the first is to avoid false breakouts. Many false breakouts start with a candlestick that breaks out of a level but ends w
FX Volume
Daniel Stein
4.58 (33)
通过 mql5 和 Telegram 上 的 " 晨间简报 "获取每日市场更新,包括详细信息和屏幕截图 ! 外汇交易量(FX Volume)是第一个也是唯一一个从经纪商角度真正洞察市场情绪的交易量指标。 直接在您的图表上看到这些信息是真正改变游戏规则和突破性的交易解决方案。 受益于独特的市场数据洞察,如 比率(Ratios )显示货币多头和空头头寸的比率(百分比 比率变化 显示所选时间段内的多头比率及其百分比变化 总交易量 显示货币的总交易量(多头和空头),以手为单位 多头 交易量显示货币所有多头头寸的交易量 空头 交易量显示所有货币空头头寸的交易量 净多头 显示净多头交易量,即所有多头头寸减去所有空头头寸(以手为单位)。 净多头百分比 显示货币净多头交易量的变化 请阅读我们的基本教程 -> "如何使用外汇交易量进行交易 " 获取更多信息,如常见问题、交易技巧和教程视频,请访问我们的 外汇交易量公共信息频道 请 安装并运行 SI Connect 以建立与我们数据中心的持续连接 背景信息 我们都知道,外汇是一个分散的市场。这就是为什么我们必须打破常规思维,开发一个独
Enigmera
Ivan Stefanov
5 (3)
ENIGMERA:市场核心 https://www.enigmera.com 简介 该指标和交易系统是金融市场的一种非凡方法。ENIGMERA 利用分形周期精确计算支撑位和阻力位。它能显示真实的累积阶段,并给出方向和目标。 该系统无论在趋势中还是在修正中都能发挥作用。 它是如何运行的? ENIGMERA 由三条线组成:支撑/阻力线、目标线和偏离线。与一般市场指标将过去的数据推断为现在和未来的情况不同,该系统能提供当前的完整情况。如果你处于支撑位,这意味着真正的支撑;如果你处于阻力位,这意味着真正的阻力。如果突破某一水平,则表示趋势发生变化。没有重绘。 由于市场在不断变化,ENIGMERA 不断调整其评估工具,定期修改策略。  这保证了每种情况都能得到全面评估。这一市场指标的独特性显而易见,其能力不言而喻。  ENIGMERA 为金融分析师和咨询师提供服务,他们需要可靠的见解与客户分享,也为投资者提供服务,他们需要最精确和最可靠的保证。 该系统能够达到最佳精度,使交易者能够自信、清晰地评估他们的选择。 ENIGMERA 将 20 年的交易专长和知识整合到一个综合软件
Atomic Analyst
Issam Kassas
5 (2)
首先值得强调的是,该交易指标是非重绘、非延迟的指标,这使其成为手动和机器人交易的理想选择。 用户手册:设置、输入和策略。 Atomic Analyst是一种PA价格行动指标,利用价格的力量和动量来寻找市场上更好的机会。配备了高级过滤器,可帮助去除噪音和假信号,并提高交易潜力。使用多层复杂的指标,Atomic Analyst扫描图表,并将复杂的数学计算转化为任何初学者都能理解并用来做出一致交易决策的简单信号和颜色。 “Atomic Analyst”是专为新手和经验丰富的交易者量身定制的综合交易解决方案。它将高级指标和一流功能融合为一体的交易策略,使其成为所有类型交易者的多功能选择。 日内交易和剥头皮策略:专为快速准确的日内交易和短期交易而设计。 日内和摆动交易策略:可用作追求价格大幅波动的日内和摆动交易者的可靠工具。 多货币和市场:凭借其可靠的精度,在不同的工具和市场上运作。 多个时间框架:可在多个时间框架上使用,性能良好。 稳定性:所有指标均不重绘、不重绘和不滞后,确保可靠的信号。 信号清晰度:提供箭头信号,用于清晰的入场和出场点。 实时警报:通过交易入场、SL和TP警报通知交
Dynamic Forex28 Navigator
Bernhard Schweigert
5 (1)
Dynamic Forex28 Navigator - 下一代外汇交易工具。 当前 49% 折扣。 Dynamic Forex28 Navigator 是我们长期流行的指标的演变,将三种功能合二为一: 高级货币强度 28 指标 (695 条评论)+ 高级货币 IMPULSE 带警报 (520 条评论)+ CS28 组合信号(奖励)。 有关指标的详细信息 https://www.mql5.com/en/blogs/post/758844 下一代强度指标提供什么? 您喜欢的原始指标的一切,现在通过新功能和更高的精度进行了增强。 主要特点: 专有货币强度公式。  所有时间范围内的平滑和准确的强度线。 非常适合识别趋势和精确进入。 动态市场斐波那契水平(市场斐波那契)。  此指标独有的独特功能。 斐波那契应用于货币强度,而不是价格图表。 适应实时市场活动以获得准确的反转区域。 实时市场动量。  第 9 行显示市场是活跃还是被动。 对于定时交易至关重要。 全面的警报和显示。  每种货币最强的买入和卖出动量。 ​​28 对的双重动量买入和卖出。 超买/超卖警告外部范围
Gold Stuff
Vasiliy Strukov
4.89 (241)
Gold Stuff 是专为黄金设计的趋势指标,也可用于任何金融工具。 该指标不会重绘,也不会滞后。 推荐时间框架 H1。 在它指标工作全自动专家顾问 EA Gold Stuff。 你可以在我的个人资料中找到它。 重要! 购买后立即与我联系,以获得说明和奖金!   您可以免费收到我们的强力支持和趋势扫描指标的副本,请私信。大部头书! 购买后立即联系我以获得设置和个人奖励!   设置 绘制箭头 - 打开关闭。 在图表上绘制箭头。 警报 - 打开关闭声音警报。 电子邮件通知 - 打开关闭。 电子邮件通知。 Puch-notification - 打开关闭。 推送通知。 接下来,调整色域。 Gold Stuff 是专为黄金设计的趋势指标,也可用于任何金融工具。 该指标不会重绘,也不会滞后。 推荐时间框架 H1。 在它指标工作全自动专家顾问 EA Gold Stuff。 你可以在我的个人资料中找到它。 购买后立即联系我以获得设置和个人奖励!   设置 绘制箭头 - 打开关闭。 在图表上绘制箭头。 警报 - 打开关闭声音警报。 电子邮件通知 - 打开关闭。 电子邮件通
Trend Punch
Mohamed Hassan
4.95 (19)
This indicator is unstoppable when combined with our other indicator called  Support & Resistance . After purchase, send us a message and you will get it   for  FREE as a BONUS! Introducing Trend Punch , the revolutionary forex trend indicator that will transform the way you trade! Trend Punch is uniquely designed to provide precise buy and sell arrows during strong market trends, making your trading decisions clearer and more confident. Whether you're trading major currency pairs or exotic sym
TPSproTREND PrO
Roman Podpora
4.79 (19)
TPSpro TREND PRO 是一个趋势指标,可以自动分析市场并提供有关趋势及其每次变化的信息,并给出进入交易的信号而无需重新绘制! 该指标使用每根蜡烛,分别对其进行分析。指不同的脉冲——向上或向下脉冲。货币、加密货币、金属、股票、指数交易的准确切入点! MT5版本                 指标的完整描述   我们建议将其与 指示器 -   RFI LEVELS 一起使用 主要功能: 准确的输入信号,无需渲染! 如果出现信号,它仍然相关!这是与重提指标的一个重要区别,重提指标可以提供信号然后改变信号,这可能导致存款资金的损失。现在您可以以更高的概率和准确度进入市场。还有一个功能是在箭头出现后为蜡烛着色,直到达到目标(止盈)或出现反转信号。 显示止损/获利区域 为了提高搜索切入点时的视觉清晰度,创建了一个模块,该模块最初显示买入/卖出区域,在该区域中搜索进入市场的最佳点。用于处理止损水平的附加智能逻辑有助于随着时间的推移减小其大小,从而降低进入交易(移动 sl)时的初始风险。 显示较高时间范围内的最小值/最大值(MTF 模式) 添加了一项功能,可以显示较高时间间隔的最小
Gann Swing Structure
Kirill Borovskii
5 (1)
This indicator is based on the mathematics of the great trader W.D. Ganna. With its help, you can easily find strong levels by analyzing swings to find the optimal entry point. The indicator works on all instruments and all timeframes. The indicator is fully manual and has control buttons. All you need to do is press the NEW button, a segment will appear, which you can place on any movement, swing or even 1 candle that you want to analyze. By placing the segment, press the OK button. A grid (th
Scalper Inside PRO
Alexey Minkov
4.73 (56)
An exclusive indicator that utilizes an innovative algorithm to swiftly and accurately determine the market trend. The indicator automatically calculates opening, closing, and profit levels, providing detailed trading statistics. With these features, you can choose the most appropriate trading instrument for the current market conditions. Additionally, you can easily integrate your own arrow indicators into Scalper Inside Pro to quickly evaluate their statistics and profitability. Scalper Inside
FX Power MT4 NG
Daniel Stein
5 (13)
通过 mql5 和 Telegram 上 的晨间简报获取每日市场更新,包括详细信息和屏幕截图 ! FX Power MT4 NG 是我们长期以来非常受欢迎的货币强度计算器 FX Power 的下一代产品。 这款下一代强度计算器能提供什么?您所喜爱的原版 FX Power 的所有功能 附加功能 黄金/XAU 强度分析 更精确的计算结果 可单独配置的分析周期 可自定义计算限制,以获得更好的性能 为希望查看更多信息的用户提供特殊的多实例设置 无尽的图形设置,可在每个图表中设置您最喜欢的颜色 无数的通知选项,让您再也不会错过任何重要信息 采用 Windows 11 和 macOS 风格的全新圆角设计 神奇的移动指标面板 FX Power 主要功能 所有主要货币的完整强势历史 所有时间框架内的货币强弱历史 所有经纪商和图表的计算结果完全相同 100% 可靠的实时计算 -> 无重绘 可通过下拉列表选择分析时段 通过自定义模式单独配置分析时段 可在一个图表中使用多个实例 可移动 FX Power 显示屏(通过拖放) 适用于高分辨率 QHD、UHD 和 4K 显示器 自动终端配置 针对平板电脑
目前八折优惠! 对任何新手或专家交易者来说都是最好的解决方案! 这个仪表板软件适用于28种货币对。它基于我们的两个主要指标(高级货币强度28和高级货币冲动)。它对整个外汇市场提供了一个伟大的概述。它显示高级货币强度值,货币运动速度和28个外汇对在所有(9)时间段的信号。想象一下,当你可以使用图表上的单一指标观察整个市场,以确定趋势和或剥头皮的机会时,你的交易将得到改善 我们已经在这个指标中建立了一些功能,使你更容易识别强势和弱势货币,同时识别和确认潜在的交易。该指标以图形方式显示货币的强势或弱势是增加还是减少,以及它在所有时间段的表现。 增加的新功能是动态市场斐波那契水平,它适应当前的市场条件变化,这是一个已经在我们的高级货币强度28和高级货币冲动指标中使用的成熟的加分项。 在交易时,总是将弱势货币和强势货币配对,这个新指标将帮助你做到这一点。 用户手册:点击这里  https://www.mql5.com/en/blogs/post/708783 特点  显示每个时间段的ACS28和GAP-speed(冲动)的货币强度值。 列:颜色代码以7种颜色
Trend Screener
STE S.S.COMPANY
4.81 (88)
趋势指标,趋势交易和过滤的突破性独特解决方案,所有重要趋势功能都内置在一个工具中! 它是 100% 非重绘多时间框架和多货币指标,可用于所有符号/工具:外汇、商品、加密货币、指数、股票。 限时优惠:支撑和阻力筛选指标仅售 50美元,终身有效。(原价 250 美元)(优惠延长) 趋势筛选器是有效的指标趋势跟踪指标,它在图表中提供带有点的箭头趋势信号。 趋势分析器指标中可用的功能: 1.趋势扫描仪。 2. 具有最大利润分析的趋势线。 3.趋势货币强度计。 4. 带有警报的趋势反转点。 5. 带有警报的强趋势点。 6. 趋势箭头 每日分析示例,每日信号表现...等与我们的趋势筛选指标,可以在这里找到: 点击这里 限时优惠:Trend Screener Indicator 仅售 50 美元且终身可用。原价 125$) 通过访问我们的 MQL5 博客,您可以找到我们所有的高级指标以及分析示例、每日信号表现...等。 : 点击这里 我们的趋势系统由 2 个指标组成: 1. Trend Screener Indicator:显示趋势仪表盘、图表中的趋势线、入场点...等。 2.
介绍 ON Trade Waves Patterns Harmonic Elliot Wolfe,这是一款高级指标,旨在使用手动和自动方法检测各种市场模式。以下是它的工作原理: 谐波模式: 该指标可以识别出现在您图表上的谐波模式。这些模式对于练习谐波交易理论的交易者非常重要,正如Scott Carney的书《谐波交易第1卷和第2卷》所描述的那样。无论您是手动绘制它们还是依赖自动检测,ON Trade Waves Patterns都可以胜任。 控制面板: 我们配备了一个用户友好的控制面板,它会保存您的图表和时间帧设置,使您可以轻松切换不同配置。您甚至可以最小化它以最大化图表空间。如果您更喜欢使用其他分析工具,只需单击关闭按钮即可隐藏所有指标数据。 模板保存: 当您自定义设置或添加其他指标,如移动平均线或布林带时,该指标会自动保存您的模板。这意味着您可以随时轻松加载您喜欢的设置。 优化显示: 对于Windows 10用户,我们建议调整您的DPI设置以获得高清设备上的最佳屏幕体验。右键单击MetaTrader图标,选择“兼容性”,然后选择“更改高DPI设置”,将其设置为“系统(增强)”。
Scalper Vault
Oleg Rodin
5 (27)
Scalper Vault 是一个专业的剥头皮系统,为您提供成功剥头皮所需的一切。该指标是一个完整的交易系统,可供外汇和二元期权交易者使用。推荐的时间范围是 M5。 该系统为您提供趋势方向的准确箭头信号。它还为您提供顶部和底部信号以及江恩市场水平。无论您拥有何种交易经验,该系统都易于使用。您只需要遵循简单的规则并每天重复该过程。 建议将此系统用于主要货币对。感谢您的关注! 请注意,该指标在策略测试器中可能无法正常工作。因此,我建议仅在模拟或真实账户的真实交易条件下使用该系统。 指示器提供所有类型的警报,包括推送通知。 购买指标后请与我联系。我将免费与您分享我的个人交易建议和出色的奖励指标! 祝您交易愉快,盈利!
TPA True Price Action indicator reveals the true price action of the market makers through 100% non-repainting signals (except early signals mode) strictly at the close of a candle! TPA shows entries and re-entries, every time the bulls are definitely stronger than the bears and vice versa. Not to confuse with red/green candles. The shift of power gets confirmed at the earliest stage and is ONE exit strategy of several. There are available now two free parts of the TPA User Guide for our custo
Stratos Pali
Michela Russo
5 (1)
Stratos Pali Indicator   is a revolutionary tool designed to enhance your trading strategy by accurately identifying market trends. This sophisticated indicator uses a unique algorithm to generate a complete histogram, which records when the trend is Long or Short. When a trend reversal occurs, an arrow appears, indicating the new direction of the trend. Important Information Revealed Leave a review and contact me via mql5 message to receive My Top 5 set files for Stratos Pali at no cost! D
Currency Strength Wizard
Oleg Rodin
4.93 (44)
货币强度向导是一个非常强大的指标,为您提供成功交易的一体化解决方案。该指标使用多个时间范围内所有货币的数据来计算这个或那个外汇对的力量。此数据以易于使用的货币指数和货币电力线的形式表示,您可以使用它们来查看这种或那种货币的力量。 您所需要的只是将指标附加到您要交易的图表上,该指标将向您显示您交易的货币的真实强度。该指标还向您显示买卖量压力的极值,您可以在顺势交易时利用这些压力。该指标还显示了基于斐波那契的可能目标。该指标可用于各种交易时间范围。该指标支持各种货币对的交易。 该指标为您提供所有类型的警报,包括推送通知。 购买后请联系我。我将与您分享我的交易技巧,并免费为您提供丰厚的红利指标! 祝您交易愉快,获利丰厚!
PRO Renko System
Oleg Rodin
5 (25)
PRO Renko Arrow Based System for trading renko charts.  准确的信号交易任何外汇工具. 另外,我将免费提供系统的附加模块! PRO Renko系统是RENKO图表上高度准确的交易系统。该系统是通用的。 该交易系统可应用于各种交易工具。 该系统有效地中和了所谓的市场噪音,打开了获得准确反转信号的通道。 该指标易于使用,只有一个参数负责产生信号。 您可以很容易地使算法适应您感兴趣的交易工具和renko酒吧的大小。 我很乐意通过提供任何咨询支持来帮助所有客户有效地使用该指标。 祝您交易成功!购买后,立即写信给我! 我将与您分享我的建议和我的renko发电机。 另外,我将免费提供系统的附加模块!
Currency Strength Exotics
Bernhard Schweigert
4.87 (30)
目前8折优惠! 对任何新手或专家交易者来说都是最好的解决方案! 这个指标是专门用来显示任何符号的货币强度,如异国货币对、商品、指数或期货。它是同类产品中的第一个,任何符号都可以添加到第9行,以显示黄金、白银、石油、DAX、US30、MXN、TRY、CNH等的真实货币强度。这是一个独特的、高质量的、负担得起的交易工具,因为我们已经纳入了一些专有的功能和一个新的公式。想象一下,你的交易将如何改善,因为你能够准确地确定新趋势或剥头皮机会的触发点? 用户手册:点击这里   https://www.mql5.com/en/blogs/post/708876 它适用于所有时间框架。你将很快能够看到TREND! 根据新的基础算法设计,它使识别和确认潜在交易变得更加容易。这是因为它以图形方式显示了8种主要货币和一种符号的强弱。 该指标显示了8种主要货币(澳元加元瑞士法郎欧元英镑日元新西兰美元)的强弱线,再加上一个符号! 该指标显示了符号的真实价值。例如:对于XAUUSD(黄金):价格以美元报价。如果黄金在上涨,你怎么能知道是黄金的强势还是美元的弱势?只有当黄金走强时,我们才会进行
TPSpro RFI Levels
Roman Podpora
4.82 (22)
指示       俄罗斯 -        英语   建议 与指示器一起使用     -       TPSpro 趋势专业版 -   MT4版本       交易中的一个关键要素是做出买卖交易工具决定的区域或水平。尽管主要参与者试图隐藏他们在市场中的存在,但他们不可避免地会留下痕迹。我们的任务是学习如何识别这些痕迹并正确解释它们。 主要功能: 向卖家和买家显示活跃区域! 该指标显示所有正确的初始买入和卖出脉冲水平/区域。激活这些水平/区域后,开始寻找切入点,水平会改变颜色并填充特定阴影。此外,还会显示箭头,以便更直观地了解情况。 显示更高时间范围内的级别/区域(MTF 模式) 添加了使用更高时间间隔显示级别/区域的功能。此外,该指标还具有自动趋势检测功能(   TPSproTREND PRO   )。 用于交易的单独专业的逐步算法。 该算法专为日内交易而设计,既可顺势交易,也可逆势交易。每个活动模板均提供详细说明。 适用于多种时间范围 。 TPSpro RFI 水平指标可用于图表上的任何时间范围,从一分钟(M1)开始一直到每月(MN)。 图形和声音警报。 该指标提供图形和声音指示
首先,值得强调的是,这个交易工具是非重绘、非重画和非滞后的指标,非常适合专业交易。 在线课程,用户手册和演示。 智能价格行动概念指标是一个非常强大的工具,既适用于新手,也适用于经验丰富的交易者。它将超过20个有用的指标合并到一个指标中,结合了高级交易思想,如内圈交易员分析和智能资金概念交易策略。该指标侧重于智能资金概念,提供有关大型机构交易方式的见解,帮助预测它们的动向。 它在流动性分析方面尤其擅长,有助于理解机构的交易方式。它擅长预测市场趋势,并仔细分析价格波动。通过将您的交易与机构策略对齐,您可以更准确地预测市场走向。该指标多才多艺,擅长分析市场结构,识别重要的订单区块,并识别各种模式。 它擅长识别BOS和CHoCH等模式,理解动量的转变,并突出显示供需强劲的关键区域。它还擅长发现强大的不平衡,并分析价格创造更高高点或更低低点的模式。如果您使用斐波那契回撤工具,该指标可以满足您的需求。它还可以识别相等的高点和低点,分析不同的时间框架,并通过仪表板显示数据。 对于使用更高级策略的交易者,该指标提供了工具,如公平价值差指标和优惠和折扣区域的识别。它特别关注高时间框架订单
Market Reversal Alerts
LEE SAMSON
4.19 (113)
成為突破者,隨著價格反轉,市場結構會改變利潤。 訂單突破者指示器可以識別趨勢或價格走勢何時接近枯竭並準備好逆轉。它會提醒您市場結構的變化,通常會在發生逆轉或重大回調時發生。 該指標使用專有計算來確定突破和價格動能。每當在可能的耗盡點附近形成新的高點時,指標就會繪製最後一個生成該高點的順序塊。然後,它將隨價格移動隨價格跟隨定單。然後,當價格轉向相反方向並突破該訂單塊時,它會提醒您,從而創建新的市場結構並開始趨勢或重大回調的可能逆轉。 訂單塊是在創建高/低之前的最後一個相反的彩色蠟燭,並且當價格跌破這些關鍵區域以下時,這表明趨勢可能會發生短期或長期反轉。 特徵 提醒您關鍵耗盡點的市場結構變化 價格接近耗盡水平時自動提取訂單塊 在一個方向繼續移動時,在價格後面跟踪定單,以提醒您最佳的反轉輸入 將顏色更改為純色塊,以顯示何時發生市場結構中斷。 適用於所有交易品種和時間範圍 內置集成的彈出窗口和電子郵件警報 策略和如何與定單破壞者指標進行交易 當斷路器塊發生時,您有兩個選擇。 看左邊!我們正在尋求供應/需求或支撐/阻力位嗎?市場結構轉變(逆轉)通常發生在價格重新測試舊水平或
Trend Pulse
Mohamed Hassan
5 (4)
Please contact me after purchase to immediately get your PDF strategy + documentation for Trend Pulse !  Introducing Trend Pulse , a unique and robust indicator capable of detecting bullish, bearish, and even ranging trends! Trend Pulse uses a special algorithm to filter out market noise with real precision. If the current symbol is moving sideways, Trend Pulse will send you a ranging signal, letting you know that it's not a good time to enter a trade. This excellent system makes Trend Pulse
MetaBands M4
Vahidreza Heidar Gholami
5 (2)
MetaBands使用强大且独特的算法绘制通道并检测趋势,以便为交易者提供进出交易的潜在点。它是一个通道指标和强大的趋势指标。它包括不同类型的通道,可以通过使用输入参数简单地合并以创建新通道。MetaBands使用所有类型的警报通知用户市场事件。 功能 支持大多数通道算法 强大的趋势检测算法 能够合并不同类型的通道 多时间帧和多货币(信号矩阵) 所有类型的警报功能(声音、屏幕闪烁、推送通知、电子邮件、弹出窗口、箭头) 它永远不会重绘 趋势检测 MetaBands使用在通道内振荡的蓝色线来检测趋势。当该线遇到通道的上界时,表明开始下跌趋势,当它遇到下界时,表明开始上涨趋势。如果蓝线接近中线,则市场处于整理期。 该指标使用独特的方法来检测趋势。一开始可能看起来有些复杂,但如果您观看视频教程,您就会意识到它是多么强大且易于使用。 入场和出场信号 当趋势变化或价格穿过上下通道时,MetaBands会立即通过不同的方法提醒交易者,这些方法可以在指标设置中启用。 信号矩阵 要监视来自不同时间框架的多个符号并在一个地方查看信号,请单击右上角按钮或按键盘上的M键以打开信号矩阵。该矩阵可以
Gold Channel XAUUSD
Paulo Rocha
5 (2)
Gold Channel is a volatility-based indicator, developed with a specific timing algorithm for the XAUUSD pair, which consists of finding possible corrections in the market. This indicator shows two outer lines, an inner line (retracement line) and an arrow sign, where the theory of the channel is to help identify overbought and oversold conditions in the market. The market price will generally fall between the boundaries of the channel. If prices touch or move outside the channel it is a tra
Automated Trendlines
Georgios Kalomoiropoulos
5 (16)
趋势线是外汇交易中最重要的技术分析工具。不幸的是,大多数交易者没有正确绘制它们。自动趋势线指标是专业交易者的专业工具,可帮助您可视化市场的趋势运动。 有两种类型的趋势线看涨趋势线和看跌趋势线。 在上升趋势中,外汇趋势线是通过价格变动的最低摆动点绘制的。 连接至少两个“最低点”将创建一条趋势线。 在下跌趋势中,趋势线是通过价格走势的最高摆动点绘制的。 连接至少两个“最高点”将创建一条趋势线。 趋势线何时突破? 当看跌蜡烛收于看涨​​趋势线下方并且蜡烛的高点在趋势线上方时,看涨趋势线会被打破。 当看涨蜡烛收于看跌趋势线上方并且蜡烛的低点低于趋势线时,看跌趋势线会被打破。 趋势线何时删除? 当一根完整的蜡烛在看涨趋势线下方形成时,看涨趋势线将被删除。 当完整的蜡烛在看跌趋势线上方形成时,看跌趋势线将被删除。 您可以从输入参数更改看涨和看跌趋势线的颜色和宽度。
Advanced Supply Demand
Bernhard Schweigert
4.91 (295)
现在优惠 33%! 任何新手或专业交易者的最佳解决方案! 该指标是一款独特、高质量、且价格合理的交易工具,因为我们已经整合了许多专有功能和新公式。 依据此更新,您将能够显示双重时间帧区域。 您不仅可以显示一个较高的时间帧,还可以同时显示图表时间帧,加上更高的时间帧:显示嵌套时区。 供需双方所有交易者都会喜欢它。 :) 重要信息披露 高级供需的最大潜力,请访问 https://www.mql5.com/zh/blogs/post/720245   想象您的交易如何得以改善,是因为您能够精准定位入场或目标位吗? 构建于新的底层算法,它可以更轻松地识别出买卖双方之间的潜在失衡。 这是因为它以图形方式展示供需最强劲区域,及其过去的表现(显示旧区域)。 这些功能旨在帮助您更轻松地发现最佳入场区域和价位。 现在您可以针对您的交易品种和时间帧来优化和编辑区域强度! 高级供需指标适用于所有产品和时间帧。 它是一个新的公式,非常新的功能是两个区域强度函数可由用户输入进行调整! 这在交易中是一大优势。 当您学习如何使用专有功能,例如带有价格游离最小 X 因子的区域强度时,您能够判断该区域强劲与否。 供
Reversal Sniper is designed to find the extreme reversals of the price. Indicator collects data of Cycle Sniper Indicator. NOTE: REVERSAL SNIPER Indicator is made for Cycle Sniper Users as an additional tool.  However, it can be used by the traders who look for finding out strong reversal levels. Indicator works on all timeframes and all instruments. Reversal  Sniper  Checks: Harmonic Patterns RSI Zig Zag and Harmonic Swings Cycle Sniper Indicator's Buy / Sell Signals The complex algo i
作者的更多信息
Fibo Pro
Sergio D. Rocha
4.33 (3)
When you combine short term fibos with the long term, your chart get missed up with a lot of lines that hardly make sense at first view. The best way to improve the clearness and there for the easiness to read your chart is by deleting the fibo levels that you no longer need, for example those levels that the price proved didn’t work as support or resistance. With Fibo Pro, you can activate or deactivate from a set of fibo levels pre-settled by you, without miss with the default fibo configurati
Dollar Index
Sergio D. Rocha
4.5 (4)
This indicator calculates directly the value of the dollar index by using the ICE formula to plot the chart, this can help you as reference. You do not need your broker to provide the ICE DX to use this indicator, is a way to have it calculated. Little discrepancies could be found in the exact value of the candles or time due closing time of the trading floor and the use of decimals, but generally will give you good reference.  You need your broker offers the feed for the following pairs in orde
FREE
Moon Phase
Sergio D. Rocha
5 (1)
Gann and other analyst had found a curious correlations between moon phases and change in trends, this is an excellent indicator to test those relation and use what you find useful. It's very simplistic, can calculate the moon phases using the average moon cycle duration of 29 days 12 hours 44 minutes since the 1970 first full moon registered at January 22nd. You can also place a known full moon's date, to start the count since the daily opening of that date. In its window will plot a vertical l
这是已发布产品 埃洛特波浪工具 7 步骤 的删节演示版。 与埃洛特波浪工具 7 步骤相比的限制如下: 只可能有一个账户,原版工具有一个主账户和四个轮换账户。 只有一级 (首要) 可用,在原版工具里根据您的性格有不同的12 级(微账户里有 6 级)。 由于只有一级可用,则选择的波浪升级和降级功能被禁用。 固定颜色计数, 在原版工具里信可以设置主要和轮换计数的颜色。 每个结构只有第一波可以标记,一旦第一波结构被释放,复选按钮将删除实际结构,开始一个新的。 帮助屏幕提醒您结构的关键点 (脉动,对角线,三角形,横盘等) 被禁用,在原版工具里,当按下 "?" 按钮,将显示实际结构的关键点简介。 所有其余选项保留。 这个视频针对原版工具 https://www.youtube.com/watch?v=0uMhTtUVsmo , 所有功能同样调用。与轻量版中的仅有不同是按钮被限制,无动作或不出现。
FREE
LevelsGrid
Sergio D. Rocha
This is a simple script that places a defined number of lines above and below a given price.  The script lets you set the number of lines, the separation in pips and the color.   Instructions: Drop the script on a chart to draw the level lines  If the last parameter is set to false, the script will delete the lines previously placed by it.  Parameters:  English? Turn it yes to use English language, false will turn language to Spanish  Separation Set the pips distance among lines  From Price
FREE
This is a very simple indicator that mixes the Sunday session with the Monday one. This is useful because the Sunday session is a partial session mostly with only Australian and Asian sessions included, so the analysis of the Monday's daily session if mixed with Sunday tends to be more comprehensive. This indicator plots a candle with the following values: Open - the Friday's Close or Sunday's Open (depending on your choice). High - the highest High of Sunday and Monday. Low - the lowest Low of
FREE
DollarAndEuroIndex
Sergio D. Rocha
4.67 (3)
This is an extension of the previous published DollarIndex with the addition of the function for calculating EURO Index under ICE Formula. Note that the broker should provide the following data: For Dollar Index formula, EURUSD, USDJPY, GBPUSD, USDCAD, USDSEK and USDCHF are needed. For Euro Index formula, EURUSD, EURGBP, EURSEK and EURCHF are needed. Now in this version if the SEK (the most uncommon) is not provided, the formula still works, since it adds 0.0001 to its value, but the index will
FREE
This is a technical indicator that works as a plug-in for "Control adora" - the Expert Advisor that helps you to calculate, place and control positions on the chart. When run on a chart with Control adora EA, this plug-in allows setting entry levels that send orders at contact, while you have StopCloseOnly (OCO in Comments) = 1 settled in Control adora (meaning that without this, the indicator will send the order only when the price Close crosses the arrow level). This indicator only works if yo
FREE
AllHere is a plug-in for Control-adora that works as information panel. Its main function is to show you all the Control-adora elements placed in the chart, like the Control-adora's orders or the exit lines. On the lower left corner, AllHere shows a collection of buttons classified by color (you can set them in the indicator's properties) for several elements used in Control-adora system: Stop loss indications (stop loss Arrows) Exit lines Above (Above trend lines) Exit lines Below (Below trend
FREE
"TradeALot" is a plug-in for the Expert Advisor Control-adora . It allow you to place programmed orders without the need to write the name of the order in the Arrow (like bs, ss, bl, sl, sl1, sl2, etc). Just drag and drop the button for "Programmed Buys" or "Programmed Sells" over the candles-zone at the place where you want to program the order and TradeALot will compare the bid price with the position where you dropped the button and will decide if the order need to be "Stop" or "Limit". With
FREE
Trailing Even is a free complement for the Control adora Expert Adviser. It adds a trailing stop function and changes the exit level that works as stop loss if some price is reached, let's review how to make it work: First of all make sure you have the same language selected both in the Control adora Expert and in this indicator.  Change of the exit level that works as stop loss with "BES" and "BEO": This function needs 2 arrows to work: 1 named BES (stands for Break Even Start) place it at the
FREE
This is a system consistent of 2 components: RepliTrades Source: It sends the trades to one or more terminals into the same Computer RepliTrades Trader: It trades the orders sent by RepliTrades Source  Please watch the video to learn how it works and use it. Features: Manage up to 300 trades at same time in each terminal Work with any broker, no matter if uses suffix or prefix in symbols names Replicate pending orders (limits or stops orders) or direct trades (market orders, etc) and its modif
FREE
Delete All
Sergio D. Rocha
This is a very silly script but perhaps you find it useful. It deletes all objects from the chart. I recommend setting a hot key to call it just by pressing a couple of keys on your keyboard.  To avoid accidental deletion of object, the script will ask you to confirm the action as you won't be available to restore them with "undo" (Ctrl+Z).
FREE
This is a technical indicator that put on strategy tester the buttons of the expert adviser "Control adora". Usually when applied the controladora to the strategy tester, the buttons do not appear and therefore its functions (like directly buy, sell, close orders or place stop loss indicator) can't be used. But now you can if have the Manual Backtest indicator. If you don't have Control adora, you can get it from here . This indicator get on the chart the buttons that can be of use in strategy t
FREE
CorExTi is a tool that will save you literally hours in your daily routine to draw lines and other graphic elements in your charts.   With a temporary panel discreetly displayed on your screen at the touch of a graphic element as trendline:  Changes the object between 4 favorite line styles (with color, line thickness and style)  Cuts trendlines, when are extended, just at the point where you touch them Extends trendlines (active property of Ray) which are not extended  Or deactivates visualizat
RotaGrafico
Sergio D. Rocha
The best way to monitor multiple pairs within little workspace. RotaGrafico sequentially displays up to 6 different pairs. It has buttons to set a pair more time for observation. Normal exposure time adjustable. Broad exposure time adjustable. Combine in a profile, Rotagrafico and use the rest of your workspace to the pair that you want to analyze in detail.
Object Copier
Sergio D. Rocha
5 (2)
Did you have to start again the very same analysis because the original one, from where you want to modify, just have so much information that no longer fits? Have you ever wanted to change some in one of your charts and make this new line, Fibo or channel automatically appear in some or the rest of your set of charts? Object Copier is the solution to replicate any object into one or several charts at your desire. No matter if you changed an object, or made it from the scratch. With Object Copie
Control adora
Sergio D. Rocha
4.33 (6)
Controladora 在西班牙语中意为控制器, 这是一款简单而强大的 EA, 可令您轻松、精确地控制您的交易。 您是否希望在价格穿越趋势线时终止您的交易?不要担忧, Controladora 能够做到。您是否希望在价格到达通道顶端时止盈?Controladora 能够做到。 按照您帐户的确切比例计算开单, 其大小代表亏损时占您余额的百分比, 如果您正在剥头皮, 进行这种计算时间昂贵且几乎不可能对您有帮助。利用 Controladora 则无此问题, 使用标准止损点数或您希望的的一个固定值。 当您希望评价一个交易信号, Controladora 通过显示级别帮助您查看是否风险盈利与您的策略标准相匹配, 在何处您需要离场来兑现风险回报。 您是否希望将一笔交易自动划分为多个止盈价位?利用 Controladora 这没问题, 它可以放置每笔交易作为完整操作或划分为若干笔小交易。 您是否只用收盘价停止 (意即只在蜡烛高于或低于给定的级别时才开、平仓), Controladora 能够做到。 利用 Controladora 您可以通过点击买入和卖出按钮直接开单, 但您也可以将停止程序化并利用
FHDrawer
Sergio D. Rocha
4 (1)
Free Hand Drawer is a small app that runs as technical indicator and the only thing that does is that it draws continuous line. To activate it, after adding the indicator to the chart just press the D on your keyboard and click where you want to start drawing. Then every click you make on your chart will be the next nod in your drawing. Use it to draft Elliott waves, or to illustrate ideas on your chart. If you like to draw manually your Gann line you’ll find it handy as well. Each time you want
BreakEven
Sergio D. Rocha
BreakEven shows the location of the average price level of the orders in the symbol, to which the indicator is attached. This information allows you to find the break-even. The indicator is helpful if you manage several positions, since it allows you to evaluate the performance of your open trades in a glance. If you trade a single order, it allows you to evaluate the effect of your stop loss and the profit or loss during the time your trade is open. Apart from drawing a break-even level line (w
Gann Line
Sergio D. Rocha
Gann Line indicator is usually used in combination with other Gann’s techniques, some say this is a key point in its success. The Gann line is interpreted as trend indicator, a series of higher highs and higher lows in it's trend are considered bullish, and a series of lower lows and lower highs are bearish. As with other technical indicators, for better results Gann Line should be used in combination with other technical concepts as Gann Fan, fibo, swings, supports and resistance, etc. When rev
RepliTrades Trader
Sergio D. Rocha
2.5 (2)
This is a system consistent of 2 components: RepliTrades Source: It sends the trades to one or more terminals into the same Computer RepliTrades Trader: It trades the orders sent by RepliTrades Source   Please watch the video to learn how it works and use it. Features: Manage up to 300 trades at same time in each terminal. Work with any broker, no matter if uses suffix or prefix in symbols names. Replicate pending orders (limits or stops orders) or direct trades (market orders, etc) and its mo
The indicator that helps you by plotting a reference to easily determine if a scalping trade (or intraday trade) has chances to work out in your favor. One of the most common issues intraday traders have is the lost of reference to know if a movement is big or small due to the scaling of the chart. With this indicator, you have 3 visual aids on your chart that will help you: "Screener" : Please set the normal stop loss size that you usually apply in your strategy. This will plot a rectangle afte
Pointer Sync
Sergio D. Rocha
3.75 (4)
This indicator plots a crosshair pointer in all charts of the terminal in the position relative to the active chart. To activate the Pointer Sync, just press the "+" button that will appear in one of the 4 corners of the chart where the indicator is added. To deactivate the Pointer Sync, just press the "+" button again. Once Pointer Sync is deactivated, the cross lines will disappear in all charts as well. You can adjust the color of the pointers and the button, the corner where the button appea
Boundaries
Sergio D. Rocha
This indicator plots a line that shows the high and low of a higher time frame than the one where you have actually in your chart. For example if you want to see the high and low of the day while you are in 1hour chart, set Boundaries to Daily. Boundaries have predefined Monthly, Weekly, Daily and Hourly time frames, but if you want to use a different timeframe, just choose the option Other_TF and write on the next field the minutes for your desired timeframe. As MT4 only works beyond M1 with 5,
AntiCursing
Sergio D. Rocha
Having a trade about to reach its take profit and suddenly see that it turns around to go strait ahead to your Stop Loss is one of the few things that makes me curse (a lot). This is why I created AntiCurse. Just add this Expert Advisor to an empty chart, set a "Trigger" and "Lock" in its properties and you'll have one less reason to curse! AntiCursing Settings: "Trigger" is set in percentage terms, it is the distance between the entry price and the Take Profit that needs to be covered in orde
PerfectLine
Sergio D. Rocha
5 (2)
When drawing a trend line or other objects, there is a natural deviation when you place the object from a higher time frame, and then go to watch it in a lower time frame. PerfectLine is a technical indicator that solves this problem. Once you touch a line after drawing it, Perfect Line will find the exact spot in the lower time frame available for it's position and then rectifies where it should be. Perfect Line uses a five pixels pre-established tolerance, if a difference between the line's no
The Polarized Fractal Efficiency (PFE) was introduced by Hans Hannula in 1994. The indicator was intended to quantify the efficiency of price movement and  how trendy or choppy  the recent past price action has been. This is calculated by contrasting the price traveled in the window of study  against the total accumulation of movements during the same period of time. For example: If in 10 days, an active raised from 50 to 100, by increasing it's value 5 points or dollars each session, the effici
CrossAlert
Sergio D. Rocha
Cross Alert is an all-in-one solution for oscillators' cross over and under. Cross Alert manages the levels for the cross under and cross over separately. Thanks to this you can use it to signal zero cross over (by fixing both levels, above to below, and below to above as zero) or over-bought and over-sold levels (like 70 and 30) as well.  With CrossAlert you can also avoid alerts from one kind of crosses (overs or unders), for example if you are in an uptrend perhaps you do not want to have ale
AdvancedTradeLog
Sergio D. Rocha
5 (2)
AdvancedTradeLog is a system that allows you to keep visual register of what you had in your chart when you take a trade decision. Basically it takes screenshots of your chart each time you open, modify or close a trade. But not just that, AdvancedTradeLog gives you the ability to record the reasons of why you take those decisions. All who had been trading some time knows that keep a track-record of what you decide and why on the market, is a powerful tool to improve your performance. AdvancedTr
筛选:
Tim Eubanks
5762
Tim Eubanks 2018.03.18 23:40 
 

用户没有留下任何评级信息

Maksym Mudrakov
29866
Maksym Mudrakov 2016.08.31 18:56 
 

用户没有留下任何评级信息

Rabbitpips
299
Rabbitpips 2015.06.11 20:39 
 

用户没有留下任何评级信息

MasterExpertAd
261
MasterExpertAd 2014.07.06 02:17 
 

用户没有留下任何评级信息

回复评论
版本 1.10 2021.11.23
Recompiled with latest MT4 build, requested by mql5.com