Zscore Indicator Suite
- 指标
- Ricardo Dacosta
- 版本: 1.6
- 更新: 4 二月 2021
- 激活: 5
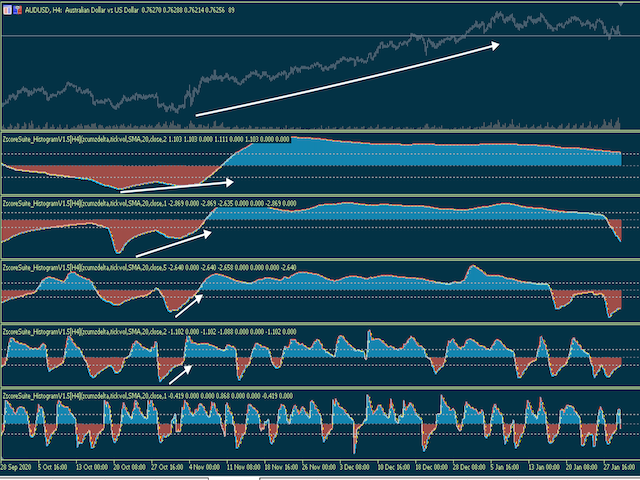
******** 5 INDICATORS IN 1 ***********
In statistics, the Zscore tells us the number of standard deviations by which the value of a raw score is above or below the mean value of what is being observed or measured. In trading the Zscore tells us the number of standard deviations by which the value of price is above or below a moving average of choice. For example a Zscore of 1.5 in a period of 20 tells us the closing price is currently 1.5 x standard deviations above the 20 period Moving Average.
The ZscoreSuite offers to calculate & illustrate the Zscore not only of Price, but of Moving Averages, Volume, and two custom functions Range (Volatility) and Trend in the form of an Oscillator combined with a moving average of the Zscore which serves as a signal line to better determine entries or exits when these two cross.
The following 5 modes are now available:
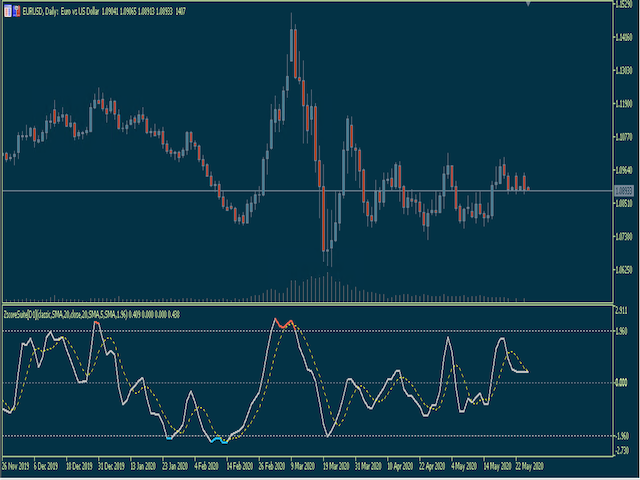
1) 1st ScreenShot ~ Classic (Calculates ZScore of Price), in this mode you can see whether price is above or below the mean average (period of your choice) determined by a + or - value. The value itself represents a Standard Deviation multiplier. In essence it tells you how much Price is currently deviated from such Moving Average.
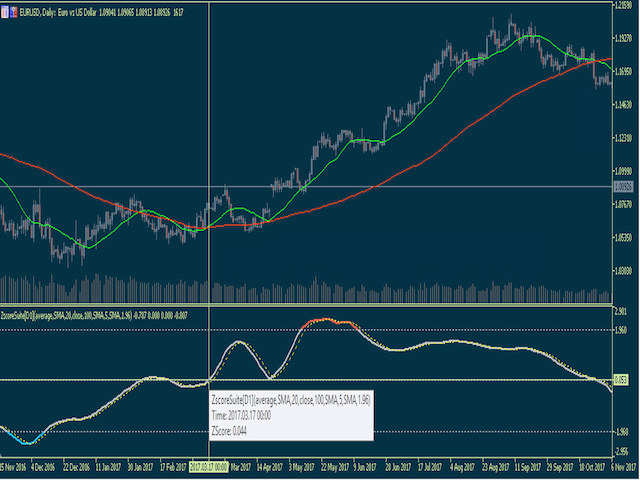
2) 2nd Screenshot ~ ZAverage (Calculates the ZScore of an Average, instead of price) in this mode you can see whether an Average of your choice (ideally a short period moving average), instead of Price, is above or below the mean average (A slow moving average, period of your choice) determined by a + or - value. The value itself represents a Standard Deviation multiplier. In essence it tells you how much a Short Period Moving Average is currently deviated from the Long Period Moving Average. The idea here was to eliminate noise of price by using an average instead of Price itself. In this mode one can easily identify Moving Average Crossovers since any crossing of the ZERO line signifies a crossing of the averages.
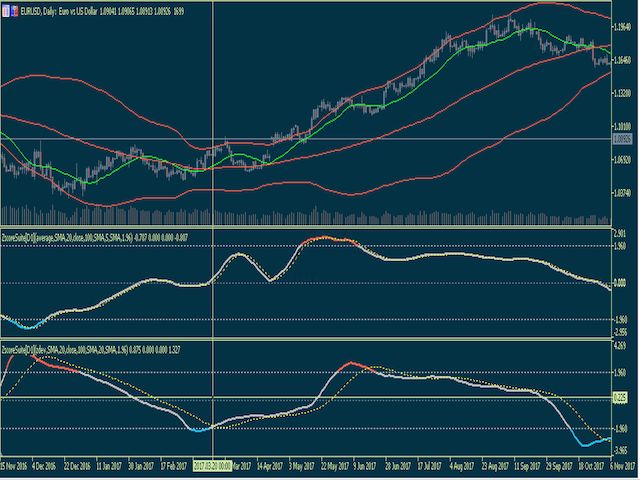
3) 3rd Screenshot ~ ZDev (Calculates ZScore of Standard Deviation), in this mode you can see whether the actual Standard Deviation is above or below the mean average of the Standard Deviation (period of your choice) determined by a + or - value. The value itself represents a Standard Deviation multiplier. In essence it tells you how much the Standard Deviation is currently deviated from the Average. A low reading of below -1.00 simulates the Bollinger Band Squeeze, a time of price consolidation that is bound to break. Ideally you want to enter trades when the ZDEV is increasing. Strategies where price is trending sideways will benefit when the ZDEV is decreasing as it signifies price entering consolidation mode.
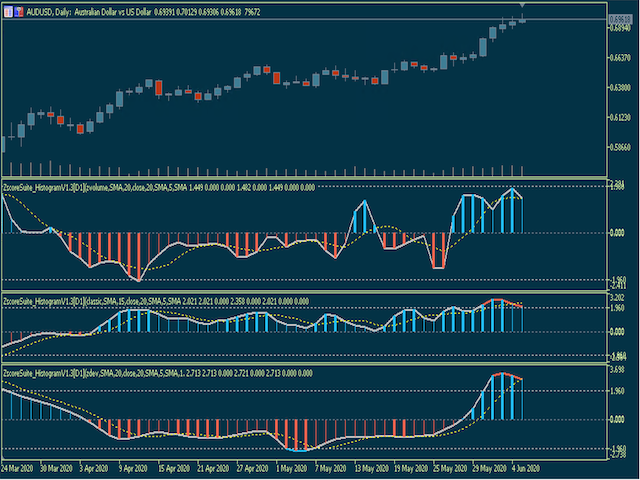
4) 4th mode ~ ZVolume (Calculates the ZScore of Tick Volume, Volume Delta & Cumulative Volume Delta), this mode serves as a great Volume indicator since it allows you to see clearly spikes in Volume based on a set period of your choice.
5) 5th mode ~ ZTrend Index, this is a custom made function we created to allow a clear identification of a Trend if there is one. On its own, this mode is a great Trend Strength Indicator.
If the concept of Standard Deviations & ZScore is new to you, I highly recommend you visit my website at fxbabatrading.com where I explain in details these and other concepts related to the use of statistics in trading.
I would like to give credits to: Brian Twomey, FX trader & author, without whom I would be clueless about ZScore & statistics in trading and to Igor Durkin, Master MQL developer, without whom this project would not have been completed.
******************** TRADINGVIEW INDICATOR INCLUDED *********************
NOTE: Those of you who have purchased the indicator. I have managed to port the code to the TRADINGVIEW platform. If you send me an email with proof of purchase to fxbaba108@gmail.com and the email address registered to your tradingview account, I can give you access to the indicator to be used in that platform as well
Love this set of indicator, especially the custom made trend indicator provided by Ricardo. ZSCORE is very useful