MarketMeter
- 指标
- Stanislav Korotky
- 版本: 1.6
- 更新: 23 十一月 2021
- 激活: 5
This is an easy to use indicator based on multitimeframe cluster analysis of specified currencies. It provides simple yet powerful signals for trading and gives numerical measures of signal strength in percentage value.
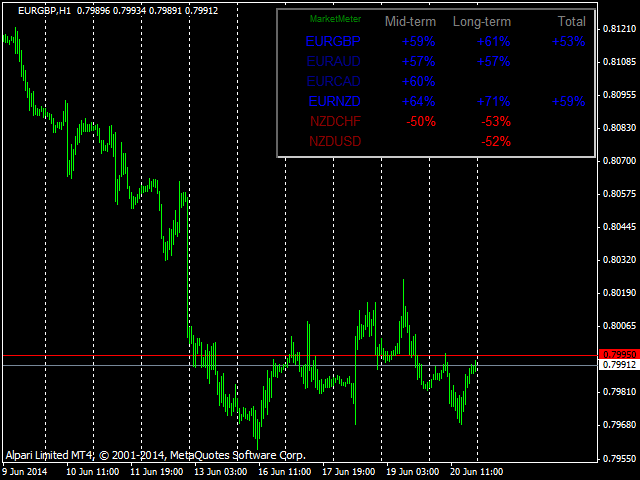
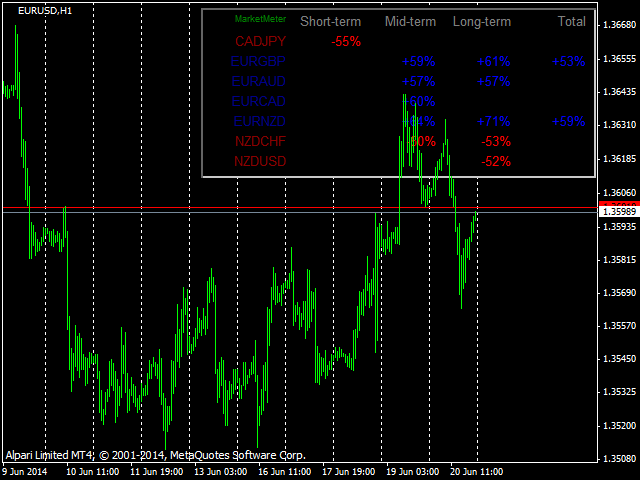
After placing the indicator on a chart, it displays a table with the following structure: all symbols with currently available opportunities to trade are listed in rows, and trading strategies are listed in columns as short-term (hours), mid-term (days), and long-term (weeks) trading. In the last column, named Total, most reliable generalized measures are shown. Signal strengths are shown in the cells: positive values are for buy, while negative ones are for sell. Symbols, for which all shown columns are filled with coherent signals, are highlighted in bright color: blue - for buy and red - for sell. If there is an empty cell for a symbol (some trading strategy is not confirmed), the symbol's color is dimmed. When contradictory signals are found in a single row, corresponding symbol is shown in gray.
Parameters:
- Instruments - comma separated list of instruments with a common currency. For Forex symbols, the common currency is either a quote currency or a base currency, which is detected in all given symbols. If the autodetection failed (as for non-Forex tickers), DefaultBase parameter is used (here, 'base' means a common currency between all tickers, not a base currency of a Forex symbol); the default set of instruments includes all Forex majors - EURUSD, GBPUSD, USDCHF, USDJPY, AUDUSD, USDCAD, NZDUSD. Please note that NZDUSD can be missing at some demo servers, so do not forget to edit as appropriate;
- DefaultBase - default common currency to use; it is used only if the base cannot be detected automatically;
- MA_Method - moving average method (the default is linear weighted);
- Price - moving average applied price type (the default is weighted price);
- Threshold - a value of minimal signal strength to show (default - 50);
- ShowShortTerm - show (true) or hide (false) the short-term column (default - true);
- ShowMidTerm - show (true) or hide (false) the mid-term column (default - true);
- ShowLongTerm - show (true) or hide (false) the long-term column (default - true); NB: Total column is always shown;
- Corner - a corner used to display the table (default value - 1 - upper right corner; other possible values: 0 - upper left corner; 2 - bottom left corner; 3 - bottom right corner);
- CellWidth - width of the table cells (default - 75);
- CellHeight - height of the table cells (default - 20);
- ColorBG - color of the table background (default - black).
The indicator requires all work instruments mentioned in the parameters to be available in the market watch. When the indicator is placed on a chart first time, it may require some time to build all necessary data. If some data is missing or is not synchronized between work instruments, "NO DATA" message is shown in the table (see logs for details). If you receive this message, open indicator dialog and apply settings once more - the data will be, most likely, calculated at that moment.
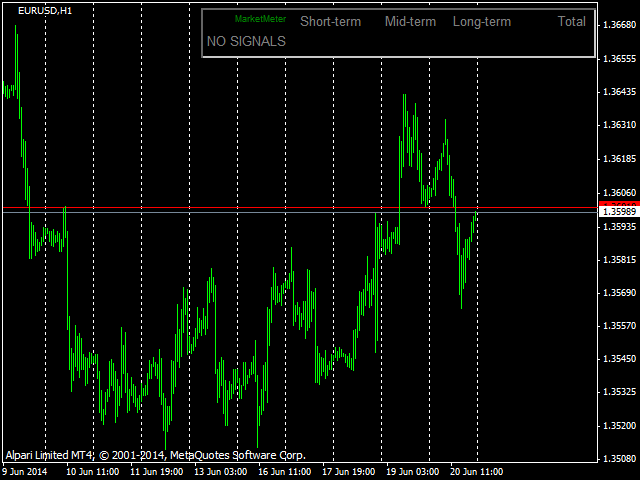
If there are no signals satisfying given conditions, the indicator displays "NO SIGNALS" message in the table.
The indicator works on bar-by-bar principle, there is no tick processing.
Behind the scenes, the indicator uses the algorithms running in the related CCFpExtraSuperMulti indicator. The latter may be used for more in-depth market analysis, on arbitrary timeframes and historical perspectives, including dynamics.


