Calendar File Converter
- 实用工具
- Boguslaw Nejmanowski
- 版本: 9.0
- 更新: 4 十二月 2020
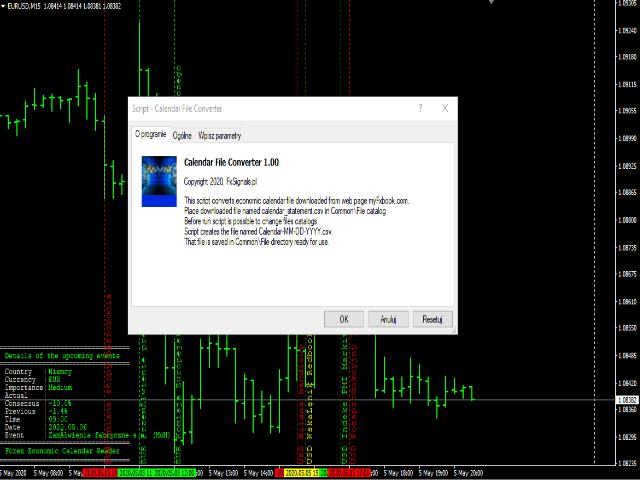
Calendar File Converter
This script adapts the csv economic calendar file downloaded from the myfxbook.com portal for use by the Economic Calendar Viewer
indicator. This indicator displays on the MT4 chart data about the upcoming current economic event and displays its data. It also
notifies you with a sound before the upcoming event time.
The read file should be named: - calendar_statement.csv
The temporary intermediate file is named: - calendar_statement2.csv
The output file is named: - Calendar-MM-DD-YYYY.csv
(MM is month 05, DD is day 12, YYYY is year 2020)
To convert the downloaded calendar_statement.csv file, place it in the Common \\ File directory and put the script on the chart, that's
all. The generated file named Calendar-MM-DD-YYYY.csv will be ready for reading by Economic Calendar Reader 2020 at the Common \\ File
director.
The default settings are the Common \\ File directory for the original, intermediate and output files. These directories can be changed and
named freely. remember to write two backslashes at the end of the directory name, for example: Source \\.
The output file is saved in the format below and separated by commas. It also has individual column headers. Here is an example.
Date, Time, Currency, Country, Description, Impact, Previous, Consensus, Actual
04/17 / 2020.00: 00, EUR, Netherlands, Liberation Day, None ,,,
04/17 / 2020.11: 00, EUR, Germany, ZEW study - economic mood, High, -49.50, -43.0, -50.0
04/17 / 2020.11: 30, EUR, USA, Consumer Price Index (YoY), Medium, 0.7%, 0.7%, 0.7%
04/17 / 2020.12: 00, EUR, Germany, Production Goods Price Index (YoY), Low, -0.1%, 0.2%, 0.1%
The original and temporary file are deleted after conversion but you can change it in the script settings and leave them in the directory.