Peaks and Troughs MT5
- 指标
- Pavel Verveyko
- 版本: 1.5
- 更新: 8 十二月 2020
- 激活: 5
The indicator detects important peaks and troughs (extremes) on the chart.
These points can be used to plot support/resistance levels and trend lines, as well as any other graphical analysis.
These points can serve as reference points for setting trading orders.
The indicator does not redraw.
Settings:
- Size_History - the size of the calculated history.
- Num_Candles_Right - number of candles to the right of the peak or trough.
- Num_Candles_Left - number of candles to the left of the peak or trough.
- Type_Arrows_extremum - label style.
- Send_Sound - sound alert.
- Send_Mail - send an email notification.
- Send_Notification - send a mobile notification.
- Send_Alert - standard terminal alert.
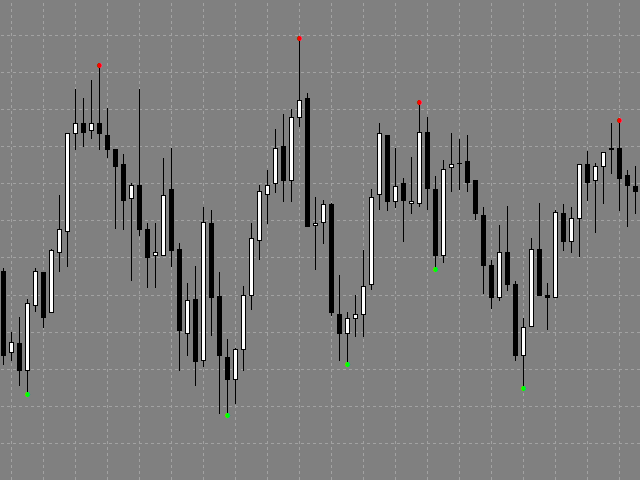

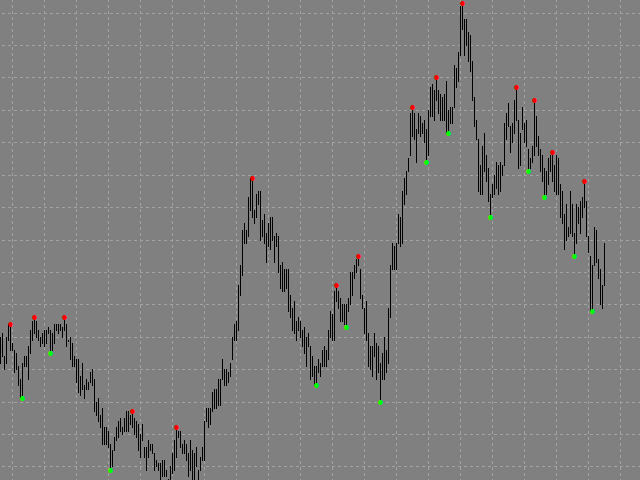
This indicator helps finding peaks and valleys .It uses green and red dots .By using the "number of candles" parameter,one can qualify the type of swing .The dots dont repaint which was important criteria for me.The peaks and troughs dots also make drawing trend lines and pitchforks easier.It is visually pleasing to the eyes.