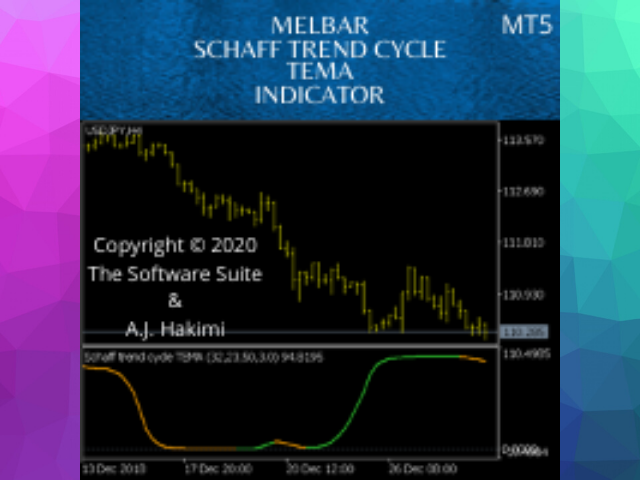
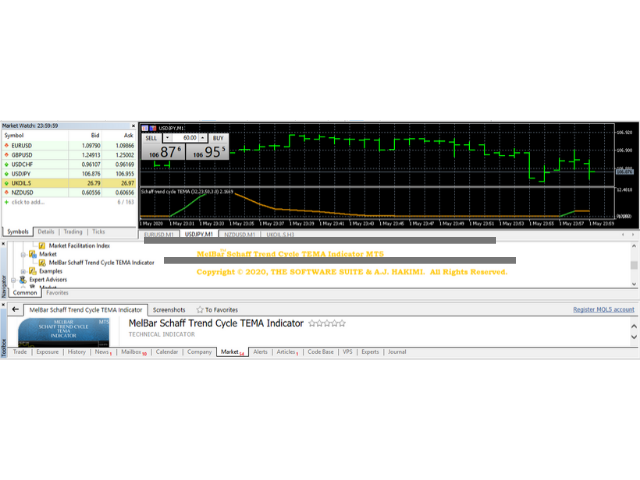
MelBar Schaff Trend Cycle TEMA Indicator
- 指标
- Hakimi Bin Abdul Jabar
- 版本: 7.88
- 激活: 5
Schaff Trend: A Faster And More Accurate Indicator In Combination With The TEMA MACD - Scalping Systems Advantage
The Schaff Trend Cycle (STC) is a charting indicator that is commonly used to identify market trends and provide buy and sell signals to traders. Developed in 1999 by noted currency trader Doug Schaff, STC is a type of oscillator and is based on the assumption that, regardless of time frame, currency trends accelerate and decelerate in cyclical patterns.
https://www.investopedia.com/articles/forex/10/schaff-trend-cycle-indicator.asp
Many traders are familiar with moving average convergence/divergence (MACD) charting tool, which is an indicator that is used to forecast price action and is notorious for lagging due to its slow responsive signal line . By contrast, STC’s signal line enables it to detect trends sooner. In fact, it typically identifies up and downtrends long before MACD indicator.
- Schaff Trend Cycle is a charting indicator used to help spot buy and sell points in the forex market.
- Compared to the popular MACD indicator, STC will react faster to changing market conditions.
The STC indicator is a forward-looking, leading indicator, that generates faster, more accurate signals than earlier indicators, such as the MACD because it considers both time (cycles) and moving averages. Like any chart indicator, the tool is best used with other forms of analysis and its performance will surely vary as market conditions change.
The MelBar™ Schaff Trend Cycle TEMA Indicator uses the TEMA MACD for calculation which makes it faster in determining the trend changes (even compared to the DEMA version) and thus, produces signals a few bars earlier. This advantage is of utmost significance in scalping systems.
Democratization and Social-Justice in Wealth Management. Profit Maximization in Wealth Management.
A Serious Tool For Serious Traders!
THE SOFTWARE SUITE
Dedicated fax line at :
+1-503-461-0251 (USA)
Dedicated eMail :
the.software.suite@protonmail.com
Visit Our Online Store/Shop :
Copyright © 2020, THE SOFTWARE SUITE
https://www.facebook.com/TheSoftwareSuite/
Support Our Noble Efforts through Crypto-Funding :
BitCoin : 1NHyCimd4hBeWVTAB156hVCuQaGrpuF7qx
Ethereum : 0x2CCf0603345c02e9b7EAFA78F423B138cf70D24c
USD Digital : 0x2CCf0603345c02e9b7EAFA78F423B138cf70D24c
+----------------------------------------------------------------+
Developed by : Hakimi Abdul Jabar & The Software Suite
the.software.suite@protonmail.com
+----------------------------------------------------------------+
Registered USA & Global/International Address :
The Software Suite
Suite #55507
6650A NE Mt. St. Helens Ave.
Portland, OR 97250
United States of America
Registered Business Trading and Postal & Correspondence Address :
THE SOFTWARE SUITE
Unit 34351, PO Box 6945,
London, W1A 6US
Britain
Global Customer Support :
+1-646-741-3233 (Manhattan, NYC, USA)
+1-503-914-4198 (Portland, OR, USA)
Asia - Customer Hotline :
+60-012-213-2308 (Kuala Lumpur, Malaysia)
Risk warning: Before you start trading, you should completely understand the risks involved with the currency market and trading on margin, and you should be aware of your level of experience.
Any copying, reproduction, republication, as well as on the Internet resources of any materials from this site is possible only upon written permission.


用户没有留下任何评级信息