• 概述
  • 评论 (36)
  • 评论 (62)
  • 新特性

SL Currency Strength Meter 28 Pair

4.95

My  Intraday trading session indicator.   SL Session Strength 28 Pair https://www.mql5.com/en/market/product/57585 

This strategy is even used by the Banks to make profits. They take a strong currency and pitch against a weak currency

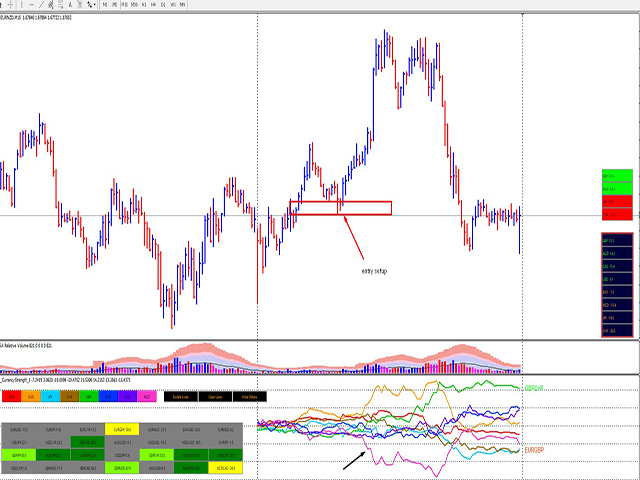
This indicator allows you to analyze the hidden trends and correlations between the 8 most traded currencies via unique strength meter which creates multiple charts in a single window based on the price action of each currency in relation to all other currencies. The indicator also includes interactive panel where you can see the trends for all 28 pairs as well as the distance to the stronger and the weakness pair for the selected period. With this panel you can switch between currency pairs with one click.

Suggested timeframes to trading :

M1 - M5 - M15-M30 -H1 -H4 -D1

You can however just change session strength to check in the settings. Bear in mind that scanning very low timeframes. 

How does it work?

The SL Currency Strength Meter 28 Pair Indicator will run calculations on all the 28 pairs, resulting in the overall strength across the market of individual currencies at any given moment. You can use this data to spot currencies that are strong, getting stronger, weak, getting weaker.

index line going +15 upwards means that the currency is gaining strength.

index line pointing -15 downwards means that the currency is becoming weak.

index line above another one means that one currency is stronger than the other.

Flat lines, or almost flat, represent currencies that are maintaining the current strength.

index line above +15 is likely to have a bullish trend against currencies below zero and vice versa.

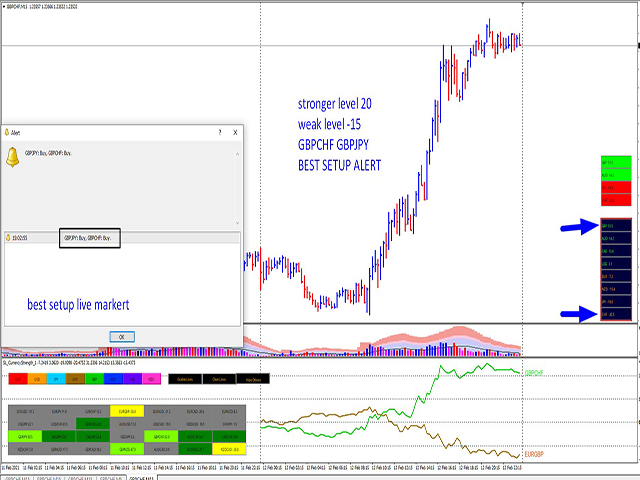
If the option is enabled, the indicator will draw arrows for possible BUY or SELL signals on the current symbol. You can also select to be notified top ranking symbol.

How to trade with SL Currency Strength Meter 28 Pair

SL Currency Strength Meter 28 Pair Indicator can be used for short term long and scalping. It is better to confirm entry signals with high low price action.

Diverging lines, that is where a currency is gaining strength and the other is losing strength.(+15and-15 best Diverging symbol possible trending this value valid day trader)

Better when a line above +15-15 and one below.

BUY the STRONG and SELL the WEAK.

Why you should use the SL Currency Strength Meter 28 Pair?

The Currency Strength Lines indicator is a very useful tool to:

spot trend continuation weekly monthy strength

spot possible trend reversal weekly monthy strength 

Filter the best rank pairs to trade, showing which currencies are strong and which are weak

Buy Signal Color - buy Diverging arrow color.

Sell Signal Color - sell Diverging arrow color.

Neutral signal color - stop signal color.

Enable Notification - enable/disable notifications.

Send Alert Notification - send alert notifications (popup screen in MetaTrader).

Send Notification to Mobile - send notifications to the mobile app.

Send Notification via Email - send notifications via emails.

Charts symbol changer and synchronizer Mt4

if you want more information please  pm me


评论 36
swarren777
1037
swarren777 2022.09.26 05:41 
 

GREAT TOOL FOR TRADING TRENDS THE OPEN TO DATE RESET ALLOWS U TO REALLY GET IN SYNC WITH PRICE ACTION

Qaisar Abbas
56
Qaisar Abbas 2022.01.31 22:08 
 

This is such a beautiful work by the author, you do not need to scan or monitor 28 pairs' charts- the good thing is you can set it to a fixed time frame or relative one, which gives it a edge over other currency strength indicators. Also, dashboard is very useful which gives insight into the potential buy/sell side of the market. Highly recommended tool!

Radzhin
479
Radzhin 2022.01.30 08:04 
 

This is the best indicator among all currency strength indicators I've come across in MQL5. The interface of the indicator is very clear and understandable! Technical support is excellent as always! I am very satisfied!

推荐产品
A technical indicator that calculates its readings on trading volumes. In the form of a histogram, it shows the accumulation of the strength of the movement of the trading instrument. It has independent calculation systems for bullish and bearish directions. Works on any trading instruments and time frames. Can complement any trading system. The indicator does not redraw its values, the signals appear on the current candle. It is easy to use and does not load the chart, does not require addition
BoxChart MT4
Evgeny Shevtsov
4.5 (6)
The market is unfair if only because 10% of participants manage 90% of funds. An ordinary trader has slim changes to stand against these "vultures". This problem can be solved. You just need to be among these 10%, learn to predict their intentions and move with them. Volume is the only preemptive factor that faultlessly works on any timeframe and symbol. First, the volume appears and is accumulated, and only then the price moves. The price moves from one volume to another. Areas of volume accumu
Simply The Best Pro
Szymon Palczynski
5 (1)
This indicator displays the histogram and arrows on chart. When Simple The Best Pro are placed on a chart, they identify the trend.  The color of may be blue or red. The blue color stands for upside moves and the red color stands for downside trends. The indicator offers to set Stop Loss (SL) and  Take Profit (TP)  setting. The default value is ATR. Indicator has automatic optimization. The STB is a unique indicator that shows the tendency (button Bars) of a particular signals. The STB tells us
Volume Profile Indicator for MT4 Gain a trading edge with the "Volume Profile" indicator for MetaTrader 4 (MT4). This advanced technical analysis tool allows you to precisely identify key support and resistance levels based on transaction volume. Easily visualize market areas of high interest, where trading volumes are highest, and use this information to make more informed trading decisions. Key Features: Clear and detailed visualization : The indicator displays volume histograms directly on th
MarketProfile EForex
Veridiana Adorno Kendrick
Market Profile Shows where the price has spent more time, highlighting important levels that can be used in trading. It is a powerful tool which is designed to take the fundamental components which comprise every market; price/volume/time, and visually display their relationship in real-time as the market develops for a pre-determined time period. Very powerful tool!
Blahtech Market Profile
Blahtech Limited
4.53 (15)
Was: $249  Now: $149   Market Profile defines a number of day types that can help the trader to determine market behaviour. A key feature is the Value Area, representing the range of price action where 70% of trading took place. Understanding the Value Area can give traders valuable insight into market direction and establish the higher odds trade. It is an excellent addition to any system you may be using. Blahtech Limited presents their Market Profile indicator for the MetaTrader community. In
UPD1 Profile Levels
Vitaliy Kuznetsov
5 (5)
该指标在指定柱数的工作直方图上找到最大和最低价格量(市场概况)的水平。   复合型材 。 柱状图的高度是全自动的,并适应任何仪器和时间框架。 作者的算法被使用,并且不重复众所周知的类似物。 两个直方图的高度近似等于蜡烛的平均高度。 智能警报将帮助您了解有关交易量水平的价格。 概念Smart Money   。 Low Volume - Imbalance. 用于寻找良好的市场环境,确定市场结构并作为二元期权的过滤器。 它是价格的磁铁。 High Volume - Liquidity. 用于退出累积时的测试。 输入参数   。 基本   。 Bars Count - 要计数和显示的条数   。 Signal Fractal = 5 (对于颜色信号电平)。 水平将在以下条件下成为信号:顶部和底部有五个直方图不超过它   。 Min Candles For High Volume Level - 在水平蜡烛的最小数量,以便它可以成为一个信号   。 按钮设置   。 Visual Button - 按钮显示(启用/禁用)   。 Corner - 按钮的卡角   。 X inden
VR Grid
Vladimir Pastushak
5 (3)
VR 网格指示器 设计 用于创建具有用户定义设置的图形网格。与 标准网格 不同,VR 网格用于构建 圆形关卡 。根据用户的选择,轮次级别之间的步长可以是任意的。此外,与其他指标和实用程序不同,即使时间段发生变化或终端重新启动,VR Grid 也能保持网格的位置 。 设置、设置文件、演示版本、说明、问题解决,可以从以下位置获取 [博客] 您可以在以下位置阅读或撰写评论 [关联] 版本为 [MetaTrader 5] 垂直级别 基于实际时间间隔并 忽略缺失 或不存在的周期。因此,级别之间的步长严格对应于用户选择的值。 使用 VR 网格指标时,交易者 可以更改任何级别的垂直线和水平线的样式 、颜色和粗细。这使您可以控制金融工具的 回合水平 。 整数位是 以两个或多个零结尾 的价格(例如:1.23500、5.65900、1923.200)。人们相信,这样的水平 经常充当 作为支撑或阻力的强点。 Horizontal line settings Horizontal line step Horizontal line color Horizontal line style Horizonta
FREE
Volume Volatility
Dominik Mandok
4 (2)
Volume Volatility is an indicator which analyzes currency pairs, indices, commodities etc. in terms of extremely high and extremely low accumulation to distribution ratio in comparison to values from past. The most important parameter is "Volume Volatility Factor" - this parameter, in big simplification, determines how far distance in the past is analyzed. The lower value of the parameter, the indicator analyzes less data from the past. I recommend you to set and test e.g. 3, 5, 15, 35, and 48 w
Displays the local time with the time difference you set. (It does not correspond to the time difference in 30-minute increments.) It also displays a price line with a good price, such as 100.000 .100 or .200. The standard gridlines are displayed with the time and price by MT4, but they are very confusing as they become the broker's time and are displayed at the halfway point along with the price. It hides them and displays gridlines at user-defined time differences and prices in easy-to-unders
Blahtech Supply Demand
Blahtech Limited
4.58 (36)
Was: $299  Now: $149   Supply Demand uses previous price action to identify potential imbalances between buyers and sellers. The key is to identify the better odds zones, not just the untouched ones. Blahtech Supply Demand indicator delivers functionality previously unavailable on any trading platform. This 4-in-1 indicator not only highlights the higher probability zones using a multi-criteria strength engine, but also combines it with multi-timeframe trend analysis, previously confirmed swings
VolumeProfile
Robert Hess
3.8 (5)
Descption: The Volume Profile displays detailed informations of historical trading activities at certain price levels (Market Profile). So you can locate the areas with the best prices in the market and get an advantage about other market participants. Features: Customizable Volume Profile / Market Profile Shows the "fair" Value Area with 70% of all Volume Shows critical low volume zones Shows VPOC, VAL and VAH Points Works on all timeframes Also available for MT5 ( https://www.mql5.com/en/mark
Time Bubble
Ahmed Mohamed
Time Bubble ***Specialized for GBPJPY 1H time frame*** (tested for two years with success rates about 82%) Time Circle's smart algorithm detects the price circles with time . give strong signals at the right time as result of combine the price and time. our team spent months to develop this indicator specially for GBPJPY ..with high success rates about 82% win trades over two years .tested from December 2016 to November 2018. *** in last two years total signals 1012 with 829 Wins and 183 Lo
Dollar Mint Indicator
David Mwaniki Mbugua
Dollar mint indicator is a special workmanship with years of experience in forex.   Dollar mint ea is a fully non repaint indicator optimised with price action data such that once it gives you a signal t . The indicator   can be used to trade anything on the mt4 with much ease. Benefits ; Fully non repaint Use in any timeframe Use in all the available tradable assets on mt4 Best to use on h4. It generates fully analysed buy and sell signals based on trend and also filters out retracements and
SmartSignal Sniper
Ahmed Ismail Muhammad Ismail Al Talhat
SmartSignal Sniper:您的终极交易伴侣 发掘精准交易的力量,使用SmartSignal Sniper。这款先进的工具旨在提供准确的买入和卖出信号,让所有级别的交易者在金融市场上自信而清晰地操作。 主要特点: 精准度高: SmartSignal Sniper利用先进的算法提供精准的买入和卖出信号,帮助交易者识别市场上的利润机会。 执行速度快: 通过实时信号生成,SmartSignal Sniper立即提醒您潜在的交易机会,为您提供了竞争优势,帮助您做出明智的决策。 可定制参数: 使用可定制参数调整SmartSignal Sniper以适应您的交易偏好,让您适应各种市场条件和交易风格。 用户友好界面: 设计简单易用,SmartSignal Sniper拥有直观的界面,使得交易对于各个级别的交易者都变得轻松高效。 为什么选择SmartSignal Sniper? 明智决策: 使用SmartSignal Sniper最大程度地发挥您交易策略的潜力,为您提供有价值的市场见解,而不是保证利润。 节省时间: 摆脱手动分析的烦恼。通过SmartSignal Sniper,优化您的交易流
CumulativeDeltaBars
Stanislav Korotky
This indicator is a conventional analytical tool for tick volumes changes. It calculates tick volumes for buys and sells separately, and their delta on every bar, and displays volumes by price clusters (cells) within a specified bar (usually the latest one). The algorithm used internally is the same as in the indicator VolumeDelta , but results are shown as cumulative volume delta bars (candlesticks). Analogous indicator for MetaTrader 5 exists - VolumeDeltaBars . This is a limited substitution
The   VWAP indicator   is our version of the popular Volume-Weighted Average Price indicator. The VWAP is the ratio between the value traded (price multiplied by the number of volume traded) and the total volume traded over a specific time period. As a result, it measures the average price of the instrument much better than the simple moving average. Although there are many ways to use the VWAP, most investors use it to calculate the daily average.  The indicator works in five modes: Moving  -
History Pattern Search
Yevhenii Levchenko
该指标建立当前报价,可以与历史报价进行比较,并在此基础上进行价格走势预测。指示器有一个文本字段,用于快速导航到所需日期。 选项: 符号 - 选择指标将显示的符号; SymbolPeriod - 选择指标从中获取数据的时段; IndicatorColor - 指示器颜色; HorisontalShift - 由指标绘制的报价移动指定的柱数; Inverse - true 反转引号,false - 原始视图; ChartVerticalShiftStep - 图表垂直移动(键盘上的向上/向下箭头); 接下来是文本字段的设置,您可以在其中输入日期,您可以通过按“回车”立即跳转到该日期。 接下来是文本字段的设置,您可以在其中输入日期,您可以通过按“回车”立即跳转到该日期。
1. Updated usage descriptions in blog below:  https://www.mql5.com/en/blogs/post/760322 Smart Market Structure Trading System and Automatic Scanner - Trading Systems - 13 October 2023 - Traders' Blogs (mql5.com) https://www.mql5.com/en/blogs/post/754495 2. YouTube video link for introduction:   https://youtu.be/tMU04wo0bc8 3. The Smart Market Structure Opportunity Scanner is a great tool to find trading entries and exits based on Smart Money Concepts. It has a build-in custom choice of Forex pa
The indicator analyzes the change in the minimum and maximum prices of the previous bars fixing the entrance of the big players. If the change (delta) increases, a signal is displayed on the graph in the form of an arrow. At the same time, virtual trade on history is carried out. In case of a repeat of the signal, the positions are increased (refilling). Thus the lot of positions can differ. The results of virtual trading in the form of losses / losses, profitability, drawdown and transaction li
Volume Profile DD 1A
OBARE PAUL OTIENO
5 (1)
重要通知 – 需要许可证和激活   激活说明: 完成购买后,请立即联系我们以获取您的许可证密钥、密码或激活详情。没有这些,软件将无法运行。我们将确保激活过程顺利进行,并随时为您解答任何疑问。 多语言定制 为了提升您的交易体验,我们提供软件的多语言完整定制服务。我们的团队可以提供以下语言的翻译: 中文 | 法语 | 葡萄牙语 | 西班牙语 | 俄语 日语 | 德语 | 韩语 | 意大利语 | 土耳其语 只需告诉我们您偏好的语言,我们将定制指标,确保为您提供用户友好的体验。 成交量分布 – 高级市场分析工具 成交量分布是一个复杂的分析工具,旨在为交易者提供对市场动态的深入洞察。它捕捉价格随时间的变化,提供实时图形化的拍卖数据表示,揭示影响价格变动的集体行为模式。 其核心是 价值区域 (Value Area) ,代表包含当天68%交易活动的价格范围。这一区域与标准差对齐,突出显示大多数交易发生的区域。 主要功能: 成交量控制点 (VPOC):   识别在指定时间内交易量最高的价格水平,作为公平价格。
Volume solution
Mikhail Bilan
5 (1)
Volume, momentum, and market strength are key indications that price is about to move in a certain direction. The Volume-solution indicator is one indicator which can help traders objectively classify a momentum type of trade setup as one having volume and strength or not. What is the Volume-solution Indicator? The Trading Volume indicator is a custom technical indicator which works somewhat like a market sentiment indicator. It indicates the strength of the bulls and the bears of the market. Wh
MACDAD
Stanislav Korotky
This indicator provides you with MACD formula applied to volume-aware Accumulation/Distribution and OnBalance Volumes indicators. In addition to tick volumes it supports special pseudo-real volumes, synthesized for Forex symbols where real volumes are unknown. More details on the volume surrogates may be found in description of another indicators - TrueVolumeSurrogate and OnBalanceVolumeSurrogate (algorithm of the latter is used internally in MACDAD for AD and OBV calculation before they proceed
The Magneto Volume Trigger indicator is designed for determining the volume confirmed by the candlestick pattern and predicting the trend tendency. Indicator setup and use The calculation of values is affected by two parameters - Period and Gate . The lower the value of Gate , the higher the sensitivity of the indicator. Period allows making a sample of data for the specified number of candles. The lower the value of Period , the more the indicator is adapted to the current market conditions. I
这是一个预测蜡烛收盘价的指标。 该指标主要用于 D1 图表。 该指标适用于传统外汇交易和二元期权交易。 该指标可以用作独立的交易系统,也可以作为您现有交易系统的补充。 该指标分析当前蜡烛,计算蜡烛本身内部的某些强度因素,以及前一根蜡烛的参数。 因此,该指标预测市场走势的进一步方向和当前蜡烛的收盘价。 由于这种方法,该指标既适用于短期盘中交易,也适用于中长期交易。 该指标允许您设置指标在分析市场情况期间将产生的潜在信号的数量。 在指标设置中有一个特殊的参数。 此外,该指标可以通过图表上的消息、电子邮件以及推送通知的形式通知新信号。感谢您的关注!交易愉快! 购买后一定要写信给我! 我会给你我的交易指标的建议! 还可以获得奖金!
The Chaikin Oscillator is a technical indicator developed by Marc Chaikin that combines price and volume data to measure the accumulation and distribution of a financial instrument. It aims to identify potential buying and selling opportunities in the market. The Chaikin Oscillator is calculated by subtracting a 10-day exponential moving average of the Accumulation Distribution Line (ADL) from a 3-day exponential moving average of the ADL. Here's how to use the Chaikin Oscillator indicator in tr
Title : Market Bias Indicator - Oscillator-Based Trading Tool Introduction : Discover the potential of the "Market Bias Indicator," a revolutionary oscillator-based trading tool designed for precise market analysis. If you're in search of a robust alternative to traditional bias indicators, your quest ends here. Market Bias Indicator offers unparalleled accuracy in identifying market sentiment and is your gateway to confident trading decisions. Recommended Trading Pairs : Market Bias Indicator i
Alpha Trend sign Alpha Trend sign 是我么长期以来非常受欢迎的交易工具,它可以验证我们的交易系统,并且明确的提示交易信号,并且信号不会漂移。 主要功能: •  根据市场显示活跃区域,根据指标可以很直观的判断当前行情是属于趋势行情,还是震荡行情。    并根据指标的指示箭头切入市场,绿色箭头提示买入,红色箭头提示卖出。 •  建议使用5分钟以上的时间周期进行交易,避免因为小周期波动出现频繁的交易信号。 •  您也可以开启信号提示,以免错过最佳的交易时机。 •  本指标不但可以很好的预测趋势行情,也可以在宽幅震荡行情中获利。 •  本指标本着大道至简的原则,适合不同阶段的交易者使用。 注意事项: •  Alpha Trend sign 有明确的进出场信号,不建议逆势操作,以免造成损失。 •  Alpha Trend sign 是特别成熟的指标,我们团队人手一个,使用它可以实现稳定盈利。     
该指标的独特之处在于交易量核算算法:在所选时段内直接进行累积,而无需参考当天的开始。可以从计算中排除最后的柱线,那么当前数据对之前形成的显着水平(交易量)的影响较小。 为了更精确的计算,默认使用 M1 图表中的数据。规范了价格量的分配步骤。默认情况下,显示的右边框设置为用于分析的数据开头对应的栏,但如果需要,可以设置为您需要的栏。显示的音量带的长度(右边界)由系数调节,也可以向左或向右移动到 0(当前)条或参照当前条进行镜像。 参数: Accumulation period -  累积量计算周期 Number of excluded last bars - 从计算中排除的最后一根柱线的数量   Accumulation price step -  按价格参数的成交量总和步骤 Graph length multiplier - 显示数据的长度比例 Use data from timeframe - 用于分析的图表(时间范围) Graph show shift - 开始显示数据的移位,如果留为0,则数据将从分析数据周期开始时间对应的条开始显示; “-1”——显示在左侧; “-2” - 显示
Check My Other Products Contact me to discover all my services  This indicator is very useful to have a better understanding of the current trend. With the integration of a trend color cloud it makes it easy to see the price trend immediately on the eye and this allows the trader to make more accurate assessments. I have been using this indicator for years and I must say that it greatly limits chart errors and trades against the trend
该产品的买家也购买
目前八折优惠! 对任何新手或专家交易者来说都是最好的解决方案! 这个仪表板软件适用于28种货币对。它基于我们的两个主要指标(高级货币强度28和高级货币冲动)。它对整个外汇市场提供了一个伟大的概述。它显示高级货币强度值,货币运动速度和28个外汇对在所有(9)时间段的信号。想象一下,当你可以使用图表上的单一指标观察整个市场,以确定趋势和或剥头皮的机会时,你的交易将得到改善 我们已经在这个指标中建立了一些功能,使你更容易识别强势和弱势货币,同时识别和确认潜在的交易。该指标以图形方式显示货币的强势或弱势是增加还是减少,以及它在所有时间段的表现。 增加的新功能是动态市场斐波那契水平,它适应当前的市场条件变化,这是一个已经在我们的高级货币强度28和高级货币冲动指标中使用的成熟的加分项。 在交易时,总是将弱势货币和强势货币配对,这个新指标将帮助你做到这一点。 用户手册:点击这里  https://www.mql5.com/en/blogs/post/708783 特点  显示每个时间段的ACS28和GAP-speed(冲动)的货币强度值。 列:颜色代码以7种颜色显示货币强度:强势
Scalper Inside PRO
Alexey Minkov
4.76 (63)
!SPECIAL SALE! An exclusive indicator that utilizes an innovative algorithm to swiftly and accurately determine the market trend. The indicator automatically calculates opening, closing, and profit levels, providing detailed trading statistics. With these features, you can choose the most appropriate trading instrument for the current market conditions. Additionally, you can easily integrate your own arrow indicators into Scalper Inside Pro to quickly evaluate their statistics and profitability
Golden Trend Indicator
Noha Mohamed Fathy Younes Badr
4.9 (10)
Golden Trend indicator  is The best indicator for predicting trend movement this indicator never lags and never repaints and never back paints    and give  arrow buy and sell    before the candle appear  and it will help you and  will make your trading decisions clearer its work on all currencies and  gold and crypto and all time frame This unique  indicator uses very secret algorithms to catch the  trends, so you can trade using this indicator and see the trend clear on charts  manual guide and
Easy Breakout
Mohamed Hassan
5 (10)
After your purchase, feel free to contact me for more details on how to receive a bonus indicator called VFI, which pairs perfectly with Easy Breakout for enhanced confluence!   Easy Breakout is a powerful price action trading system built on one of the most popular and widely trusted strategies among traders: the Breakout strategy ! This indicator delivers crystal-clear Buy and Sell signals based on breakouts from key support and resistance zones. Unlike typical breakout indicators, it levera
Enigmera
Ivan Stefanov
5 (7)
ENIGMERA: 市场的核心 重要提示:MQL5.com 演示版本在策略测试器中运行,可能无法完全反映 Enigmera 的功能。请查看描述、截图和视频了解详细信息。如有任何问题,请随时联系我! 该指标的代码已完全重写。版本 3.0 增加了新功能并修复了自指标发布以来积累的错误。 简介 这个指标和交易系统是金融市场的一种独特方法。ENIGMERA 使用分形周期来精确计算支撑和阻力水平。它展示了真实的积累阶段,并提供了方向和目标。无论是在趋势中还是在修正中,这个系统都能工作。 它是如何工作的 指标的大部分功能通过图表左侧的按钮控制,使得能够快速响应不同的市场情况。 按钮 ON/OFF – 显示或隐藏整个指标。 Channel – 激活支撑通道,显示可接受的偏差范围。 Dev1 (第一偏差) – 指示价格在支撑偏差内的波动,信号表示市场正在整合或积累力量。 Dev2 (第二偏差) – 显示价格在偏差之间的波动,表示趋势形成和方向。 Dev3 (第三偏差) – 表示趋势的显著加速和高波动性。 45deg (45度) – 显示市场的节奏和相对于 45 度线的运动稳定性。 Tgt1/2
Linear Trend Predictor — 结合切入点和方向支撑线的趋势指标。按照突破高/低价通道的原理运作。该指标算法过滤市场噪音,考虑波动性和市场动态。 指示器功能  使用平滑方法,显示市场趋势和开立买入或卖出订单的切入点。  适合通过分析任何时间范围内的图表来确定短期和长期的市场走势。  输入参数可适应任何市场和时间范围,允许交易者独立定制指标。  设定的指示信号不会消失,也不会重新绘制——它是在蜡烛收盘时确定的。也可以在当前蜡烛上使用它,更早地接收信号,但信号可能会改变。  几种类型的通知以箭头组合。  该指标既可以作为独立的交易系统使用,也可以作为其他交易系统的补充。  可供任何经验水平的交易者使用。 主要参数 Volatility Smoothing Level - 指标的主要参数,允许您配置指标以实现舒适的操作。 它的数字范围是 1 到 100,从而增加了您可以获得更长趋势运动的平滑度。 通过少量的数字,您可以获得短期走势并快速退出交易。 使用指标进行交易的时刻:  红线和箭头表示下降趋势和卖出开盘信号。止损应根据前一个上分形来设置。  黄线和箭头
GOLD Impulse with Alert
Bernhard Schweigert
4.6 (10)
这个指标是我们2个产品 Advanced Currency IMPULSE with ALERT  +   Currency Strength Exotics 的一个超级组合。 它适用于所有时间框架,并以图形方式显示8种主要货币和一种符号的强势或弱势冲动! 该指标专门用于显示任何符号的货币强度加速,如黄金、异国货币对、商品、指数或期货。这是它的第一个指标,任何符号都可以被添加到第9行,以显示黄金、白银、石油、DAX、US30、MXN、TRY、CNH等的真实货币强度加速(冲动或速度)。 建立在新的基础算法上,它使识别和确认潜在的交易更加容易。这是因为它以图形方式显示了一种货币的强势或弱势是否正在加速,并测量了这种加速的速度--把它想象成你汽车中的速度表。当你加速时,事情显然会发生得更快,这在外汇市场上也是一样的,即如果你配对的货币正在向相反的方向加速,你就会发现一个潜在的有利可图的交易。 动态市场斐波那契28水平被用作警报触发器,将适应市场活动。如果冲动击中黄色触发线,你将收到警报。然后你就知道作为一个交易员应该做什么。货币对和方向已经给出。只需点击警报按钮,就可以切换到该货
Dynamic Forex28 Navigator
Bernhard Schweigert
5 (5)
Dynamic Forex28 Navigator - 下一代外汇交易工具。 当前 49% 折扣。 Dynamic Forex28 Navigator 是我们长期流行的指标的演变,将三种功能合二为一: 高级货币强度 28 指标 (695 条评论)+ 高级货币 IMPULSE 带警报 (520 条评论)+ CS28 组合信号(奖励)。 有关指标的详细信息 https://www.mql5.com/en/blogs/post/758844 下一代强度指标提供什么? 您喜欢的原始指标的一切,现在通过新功能和更高的精度进行了增强。 主要特点: 专有货币强度公式。  所有时间范围内的平滑和准确的强度线。 非常适合识别趋势和精确进入。 动态市场斐波那契水平(市场斐波那契)。  此指标独有的独特功能。 斐波那契应用于货币强度,而不是价格图表。 适应实时市场活动以获得准确的反转区域。 实时市场动量。  第 9 行显示市场是活跃还是被动。 对于定时交易至关重要。 全面的警报和显示。  每种货币最强的买入和卖出动量。 ​​28 对的双重动量买入和卖出。 超买/超卖警告外部范围和止损。 反转
Algo Pumping MT4
Ihor Otkydach
5 (4)
PUMPING STATION – 您的专属“全包式”交易策略 我们为您推出PUMPING STATION —— 一款革命性的外汇指标,它将使您的交易变得更加有趣且高效。这不仅仅是一个辅助工具,而是一套完整的交易系统,具备强大的算法,帮助您开始更加稳定的交易。 购买本产品,您将免费获得: 专属设置文件:用于自动配置,实现最大化性能。 逐步视频教程:学习如何使用PUMPING STATION策略进行交易。 Pumping Utility:专为PUMPING STATION打造的半自动交易机器人,让交易变得更加方便和简单。 购买后请立即联系我,我将为您提供所有额外资源的访问权限。 PUMPING STATION如何工作: 趋势监控:能够即时识别市场趋势方向。趋势是您最好的朋友。 进场信号:图表上的箭头会提示您何时进场以及交易方向。 明确的交易目标:指标会自动识别最佳的平仓时机。 回调交易:内置的基于布林带的价格通道可检测修正结束并发出新趋势开始的信号。 效率分析:如果当前设置效果较差,系统会自动提示。只需调整PUMPING STATION,即可获得最佳性能。 功能强大: 推送和邮件通知:即
FX Volume
Daniel Stein
4.6 (35)
FX Volume:从经纪商视角洞察真实市场情绪 简要概述 想要提升您的交易策略? FX Volume 可提供零售交易者和经纪商的持仓实时数据——远早于诸如 COT 之类的延迟报告。不论您希望获得持续稳定的收益,还是想在市场中多一分制胜的砝码, FX Volume 都能帮您识别重大失衡、确认突破以及完善风险管理。立即开启体验,让真实的成交量数据为您的交易决策带来革新! 1. 为什么 FX Volume 对交易者格外有用 极具准确度的早期预警 • 快速捕捉有多少交易者正在买入或卖出某个货币对——比大多数人提前一步。 • FX Volume 是 唯一 能够整合多家零售经纪商真实成交量数据并以简洁方式呈现的工具。 强力风险管理 • 及时识别多头或空头仓位的巨大不平衡,这往往预示着潜在的趋势反转,帮助您更自信地设置止损和目标位。 • 独家而真实的数据让每一次交易决策更具可靠性。 优化进场与出场点 • 发现“过度集中”的交易(大多数交易者都在同一方向),并通过真实成交量来确认突破。 • 避免依赖常见指标可能带来的误导信号,而是利用真实的实时成交量。 适配各种交易策略 • 将 FX
Advanced Currency Strength28 Indicator
Bernhard Schweigert
4.9 (651)
目前26%的折扣 任何新手或专家交易者的最佳解决方案! 这个指标是一个独特的、高质量的、可负担得起的交易工具,因为我们纳入了一些专有的功能和一个新的公式。只需一个图表,你就可以读出28个外汇对的货币强度!想象一下,你的交易将如何得到改善,因为你的交易是在你的手中进行的。想象一下,你的交易将如何改善,因为你能够准确地确定新趋势或剥头皮机会的触发点? 用户手册:点击这里  https://www.mql5.com/en/blogs/post/697384 这是第一本,原版的! 不要买一个毫无价值的崇拜者的克隆品。 特别的 子窗口中的箭头显示强劲的货币势头GAP将指导你的交易! 当基础货币或报价货币处于超卖/超买区域(外盘斐波那契水平)时,在个人图表的主窗口中出现警告信号。 当货币力量从外围区间回落时,回撤/反转警报。 十字星模式的特别警报 可选择多个时间框架,以快速查看趋势! 货币强度线在所有的时间框架中都非常平稳,当使用较高的时间框架来识别总体趋势,然后使用较短的时间框架来确定精确的入口时,效果非常好。你可以根据自己的意愿选择任何时间框架。每个时间框架都由其自身进行了优化。
Max Min Cycle
Vitalyi Belyh
Cyclical indicator for trading and predicting the direction of the market. Shows the cyclical behavior of the price in the form of an oscillator. Gives signals for opening deals when rebounding from the upper and lower boundaries of the oscillator. In the form of a histogram, it shows the smoothed strength of the trend. Will complement any trading strategy, from scalping to intraday. The indicator does not redraw. Suitable for use on all symbols/instruments. Suitable time frames for short-term t
Advanced Supply Demand
Bernhard Schweigert
4.91 (294)
现在优惠 33%! 任何新手或专业交易者的最佳解决方案! 该指标是一款独特、高质量、且价格合理的交易工具,因为我们已经整合了许多专有功能和新公式。 依据此更新,您将能够显示双重时间帧区域。 您不仅可以显示一个较高的时间帧,还可以同时显示图表时间帧,加上更高的时间帧:显示嵌套时区。 供需双方所有交易者都会喜欢它。 :) 重要信息披露 高级供需的最大潜力,请访问 https://www.mql5.com/zh/blogs/post/720245   想象您的交易如何得以改善,是因为您能够精准定位入场或目标位吗? 构建于新的底层算法,它可以更轻松地识别出买卖双方之间的潜在失衡。 这是因为它以图形方式展示供需最强劲区域,及其过去的表现(显示旧区域)。 这些功能旨在帮助您更轻松地发现最佳入场区域和价位。 现在您可以针对您的交易品种和时间帧来优化和编辑区域强度! 高级供需指标适用于所有产品和时间帧。 它是一个新的公式,非常新的功能是两个区域强度函数可由用户输入进行调整! 这在交易中是一大优势。 当您学习如何使用专有功能,例如带有价格游离最小 X 因子的区域强度时,您能够判断该区域强劲与否。 供需
Order Blocks ICT Multi TF MT4
Diego Arribas Lopez
5 (2)
[ MT5 Version ]  [ Kill Zones ]  [ SMT Divergences ] How to trade using Order Blocks:  Click here User Interface Performance:  During testing in the strategy tester, the UI may experience lag. Rest assured, this issue is specific to the testing environment and does not affect the indicator's performance in live trading. Elevate your trading strategy with the  Order Blocks ICT Multi TF  indicator, a cutting-edge tool designed to enhance your trading decisions through advanced order block analys
Gold Venamax MT4
Sergei Linskii
2 (1)
Gold Venamax   - 這是最好的股票技術指標。 此指標演算法分析資產的價格變動並反映波動性和潛在的進入區域。 指標特點: 這是一個帶有 Magic 和兩個趨勢箭頭塊的超級指標,可實現舒適且有利可圖的交易。 圖表上顯示用於切換方塊的紅色按鈕。 Magic 在指標設定中進行設置,以便您可以將指標安裝在顯示不同區塊的兩個圖表上。 Gold Venamax 可以放置在具有不同箭頭緩衝區(GV 和 SD)的兩個圖表上。 為此,您需要在設定中選擇不同的 Magic,例如,一個具有 Magic = 999,另一個具有 Magic = 666。接下來,您可以使用圖表上的紅色按鈕選擇箭頭緩衝區。 指標設定中的每個箭頭緩衝區(GV и SD)都有一個單獨的箭頭過濾器,以實現舒適且有利可圖的交易(UseFiltrGV = true; 和 UseFiltrSD = true;)。 進入的最佳訊號 = 遵循兩個緩衝區的訊號箭頭(GV 和 SD)+ 所有三個 MA 線(紅色或藍色)的方向 + TMA 通道邊界(下或上) 。 TMA 通道邊界(下限或上限)也可用於鎖定利潤和/或以較短的停損位進行逆
波浪同步器是波浪分析的可视化指标。结合蜡烛图运动序列并构建定向波浪,与市场一起产生同步运动。 每个波浪的开始都以信号箭头开始,还有警报。 该指标永远不会重绘或移动先前历史记录上的箭头。 信号箭头出现在蜡烛图的收盘价。 适用于任何交易工具和时间框架。 易于使用和配置,仅包含 2 个输入参数:选择与所选参数一起使用的时间框架和计算 MA 线的方法。 推荐的参数可以移动 1-2 个周期。 红色箭头方向用于购买交易资产。 蓝色箭头方向用于出售交易资产。 ----------------------------------------------------------------------------------------------
PZ Order Block
PZ TRADING SLU
订单块的个人实现,一种简单而有效的头寸交易策略。如果价格范围没有在与突破相反的方向被突破,则交易者应进入市场或在最后一个订单块的方向上寻找交易。为清楚起见,未绘制开放块。 [ 安装指南 | 更新指南 | 故障排除 | 常见问题 | 所有产品 ] 一个看涨的开盘是在一个新的市场低点之后的第一个看涨柱 看跌的开盘是在新的市场高点之后的第一个看跌柱 当打开的块被破坏时出现信号,成为订单块 当一个订单块被打破到相反的一侧时,它就变成了一个反转块 该指标实施各种警报 它不会重新粉刷或重新粉刷 输入参数 周期:创建新高或新低所需的柱线数量。较小的值会产生更多的信号。 最小 ATR 过滤器:订单块栏的最小主体尺寸,表示为 ATR 的乘数。 Max ATR Filter:订单块的最大主体尺寸,表示为 ATR 的乘数。 颜色:设置线条和箭头的颜色和大小。 警报:启用显示/电子邮件/推送/声音警报。 支持和问题 使用帮助台解决问题或及时获得支持。写一封电子邮件至:help@pointzero-trading.com。 作者 Arturo López Pérez,私人投资者和投机者、软件工程师和 P
IQ FX Gann Levels
INTRAQUOTES
5 (1)
CONTACT US  after purchase to get the Indicator Manual. Try Now—Limited Discount for the next 10 Buyers! Download the  Metatrader 5 Version Read the product description carefully before purchasing the product.  Due to regulatory restrictions, our service is unavailable in certain countries such as India, Pakistan, and Bangladesh. Disclaimer: • Our products are available only on mql5.com. • We never contact anyone or sell our products privately. • We do not provide any personal trading advice.
Lux Trend
Mohamed Hassan
5 (3)
After purchase, please contact me to get your trading tips + more information for a great bonus!   Lux Trend is a professional strategy based on using Higher Highs and Lower Highs to identify and draw Trendline Breakouts! Lux Trend  utilizes two Moving Averages to confirm the overall trend direction before scanning the market for high-quality breakout opportunities, ensuring more accurate and reliable trade signals. This is a proven trading system used by real traders worldwide, demonstrating
Volume by Price MT4
Brian Collard
4.67 (12)
Volume Profile, Footprint and Market Profile TPO (Time Price Opportunity). Volume and TPO histogram bar and line charts. Volume Footprint charts. TPO letter and block marker collapsed and split structure charts. Static, dynamic and flexible range segmentation and compositing methods with relative and absolute visualizations. Session hours filtering and segment concatenation with Market Watch and custom user specifications. Graphical layering, positioning and styling options to suit the user's a
Grabber System MT4
Ihor Otkydach
3 (2)
向您介绍一款优秀的技术指标——Grabber,它是一套即开即用的“全包式”交易策略。 在一个代码中集成了强大的市场技术分析工具、交易信号(箭头)、提醒功能和推送通知。 每位购买该指标的用户还可免费获得以下内容: Grabber辅助工具:用于自动管理已开仓位 视频操作指南:逐步教学如何安装、设置和使用该指标进行交易 原创Set文件:可快速自动配置,帮助实现最佳交易效果 忘掉其他策略吧!只有Grabber能够真正激励你在交易中攀登新高峰! Grabber策略的主要特点: 交易周期:从M5到H4 适用资产:任意,但我推荐我亲自测试过的品种(GBPUSD、GBPCAD、GBPCHF、AUDCAD、AUDUSD、AUDSGD、AUDCHF、NZDUSD、NZDCAD、EURCAD、EURUSD、EURAUD、EURGBP、EURCHF、USDCAD、USDSGD) 交易时间:全天候 24/7 交易效果:我分享自己的真实交易结果,并在此教学如何操作: https://www.mql5.com/ru/market/product/134563?source=Site+Market+MT5+Indic
KT Asian Breakout Indicator
KEENBASE SOFTWARE SOLUTIONS
KT Asian Breakout 指标分析亚洲交易时段的关键部分,以生成双向买卖信号,并基于价格突破的方向进行交易。当价格突破该交易时段的最高点时,会出现买入信号;当价格突破最低点时,会出现卖出信号。 注意事项 如果交易时段的范围过大,建议避免新交易,因为大部分价格走势已在该时段内完成。 如果突破K线过大,价格通常会在继续沿信号方向运行之前发生短暂回调。 功能特点 买入/卖出信号包含止损和盈利目标。 KT Asian Breakout 指标持续监测其表现,并使用第一、第二或第三盈利目标作为成功标准。 显示三个关键性能指标,包括盈亏信号、成功率和每个信号的平均点数。 如果突破K线过大,图表上会显示警告信息。 推荐设置 时间周期: 15分钟。 交易货币对: 所有 JPY 货币对。 输入参数 绘制交易时段框 :  true/false 绘制止损和盈利目标 :  true/false 性能分析 : true/false 显示文本分析(左上角) :  true/false 成功率标准 :  第一目标 | 第二目标 | 第三目标 颜色和样式设置 :  可自定义 警报设置 :  可自定义
NAM Order Blocks
NAM TECH GROUP, CORP.
3 (2)
MT4多時限訂單塊檢測指示器。 特徵 -在圖表控制面板上完全可自定義,提供完整的交互。 -隨時隨地隱藏和顯示控制面板。 -在多個時間範圍內檢測OB。 -選擇要顯示的OB數量。 -不同的OB用戶界面。 -OB上的不同過濾器。 -OB接近警報。 -ADR高低線。 -通知服務(屏幕警報|推送通知)。 概括 訂單塊是一種市場行為,它指示從金融機構和銀行收取訂單。著名的金融機構和中央銀行帶動了外匯市場。因此,交易者必須知道他們在市場上正在做什麼。當市場建立訂單塊時,它會像發生大多數投資決策的範圍一樣移動。 訂單建立完成後,市場將朝著上升和縮小的方向發展。訂單大宗交易策略的關鍵術語是它包括機構交易者正在做的事情。由於它們是主要的價格驅動因素,因此包括機構交易在內的任何策略都可以。 您將在任何時間範圍內實時看到訂單塊,使用我們的控制面板,您將能夠在所選的歷史記錄週期內檢測常規,拒收和未大寫的訂單塊。 現在您可以接收到訂單塊接近警報,我們在MT4上顯示屏幕通知,並將通知推送到您的手機!
Smart Set up Levels
Mohit Dhariwal
5 (1)
Smart Set up leve l is a very powerful indicator based on the concept of order blocks and set up entries with proper fvg and breakouts to make a very nice level to enter like a pro trader. Very easy to use interface and friendly to enter on buy and sell signals. Works Best on M15 Time frame on Gold, Bitcoin and Fx pairs. Daily 4-5 trades on each pair  Works great on gold like a pro on M15 It is non repainting nor lagging It is very powerful indicator giving precise entries and prop acts can be c
KT Candlestick Patterns MT4
KEENBASE SOFTWARE SOLUTIONS
KT Candlestick Patterns 实时识别并标注出 24 种最可靠的日本蜡烛图形态。自18世纪以来,日本交易员便一直使用蜡烛图预测价格走势。 确实,并非所有蜡烛图形态都能可靠地预测价格方向,但如果与支撑阻力等其他技术分析方法结合使用,它们可以更清晰地反映当前市场状况。 该指标涵盖了许多出现在 Steve Nison 所著《日本蜡烛图技术》中的形态。 除书中图形外,还能识别很多较为复杂但不太为人所知的蜡烛图形态。 功能特点 可设置固定点数为目标,输入成功点数后即可看到每个信号的成功率。 准确识别 24 种日本经典蜡烛图形态。 配备实时统计模块,显示每种形态的表现情况。 可设置图形之间最小间隔柱数,优化图表整洁度与信号质量。 结合市场趋势方向,提高识别的准确性。 包含反转、趋势延续与中性形态(如十字星)。 支持所有 MetaTrader 警报类型。 包含图形 ----- 反转形态 ----- 母子形态 锤头/流星 吞没 三只白兵/三只乌鸦 外包三阳/三阴 内包三阳/三阴 晨星/暮星 挤压形态 带腰带形态 乌云盖顶/刺透形态 推进阻挡/下降阻挡 反击线 阶梯底/顶 跳空
CONTACT US  after purchase to get the Indicator Manual. Download Now!  Offer valid only for next 10 Buyers.  Price   will   increase  gradually !  Download the  Metatrader 5 Version Read the product description carefully before purchasing the product.  Due to regulatory restrictions, our service is unavailable in certain countries such as India, Pakistan, and Bangladesh. Disclaimer: • Our products are available only on mql5.com. • We never contact anyone or sell our products privately. • We d
TPSpro RFI Levels
Roman Podpora
4.85 (27)
反转区域 / 峰值交易量 / 主要参与者的活跃区域 =       TS TPSPRO系统 俄语使用说明     /       指示     英语     /       Version MT5 该指标的每位购买者还可免费获得: 6 个月内可访问 RFI SIGNALS 服务的交易信号 - 根据 TPSproSYSTEM 算法准备的切入点。 定期更新的培训材料 - 让您沉浸在策略中并提高您的专业水平。 工作日每天 24 小时提供支持,并可以访问封闭的交易者聊天室 - 沟通、协助和市场情况分析。 作者设定的文件——自动指标设置,无需额外努力即可实现最大效果。 主要功能: 显示卖家和买家的活跃区域! 指标显示所有正确的买入和卖出第一脉冲水平/区域。当这些水平/区域被激活时,即开始寻找切入点的地方,水平会改变颜色并填充特定颜色。还会出现箭头,以便更直观地了解情况。 LOGIC AI - 激活模板时显示用于搜索入口点的区域(圆圈) 为了提高视觉清晰度,添加了使用人工智能搜索入口点的显示区域的功能。 显示更高时间范围内的级别/区域(MTF 模式) 添加了使用更高时间间隔显示级别/区域的功能
TPSproTREND PrO
Roman Podpora
4.68 (25)
VERSION MT5        —        ИНСТРУКЦИЯ RUS           —        INSTRUCTIONS  ENG 主要功能: 准确的输入信号,无需渲染! 如果出现信号,它仍然相关!这是与重提指标的一个重要区别,重提指标可以提供信号然后改变信号,这可能导致存款资金的损失。现在您可以以更高的概率和准确度进入市场。还有一个功能是在箭头出现后为蜡烛着色,直到达到目标(止盈)或出现反转信号。 显示止损/获利区域 为了提高搜索切入点时的视觉清晰度,创建了一个模块,该模块最初显示买入/卖出区域,在该区域中搜索进入市场的最佳点。用于处理止损水平的附加智能逻辑有助于随着时间的推移减小其大小,从而降低进入交易(移动 sl)时的初始风险。 显示较高时间范围内的最小值/最大值(MTF 模式) 添加了一项功能,可以显示较高时间间隔的最小/最大校正位置,并显示趋势变化。此外,MIN/MAX 现在有编号,显示修正内容。 风险回报率 (RR) 使用指标算法,可以检测精确的入场点,平均风险回报比超过1k2。这也伴随着视觉效果,例如,收到信号后会出现蜡烛的彩色草图。 无论价
Bomb Signal
Aleksandr Makarov
Bomb Signal : 100% does not repaint Bonus: when you buy an indicator, you get any indicator for free (optional) . (Write in a private message or in telegram in your profile to receive a bonus) Bomb Signal is a powerful indicator for MetaTrader 4 designed to identify the most relevant trends in the financial market. If you are looking for a tool that accurately predicts movements, Bomb Signal is your ally. How does this work: This indicator combines three different methods – volume analysis, can
Reversal Master
Alexey Minkov
4.92 (13)
!SPECIAL SALE! The Reversal Master is an indicator for determining the current direction of price movement and reversal points. The indicator will be useful for those who want to see the current market situation better. The indicator can be used as an add-on for ready-made trading systems, or as an independent tool, or to develop your own trading systems. The Reversal Master indicator, to determine the reversal points,  analyzes a lot of conditions since the combined analysis gives a more accura
作者的更多信息
SL Currency28 Pair Dashboard
Chalin Saranga Jayathilake
5 (13)
User Manual For more information pm me            SL Currency28 Pair Dashboard is even used by the Banks to make profits. They take a strong currency and pitch against a weak currency This strategy i am made my other indicator SL Currency Strength Meter 28 Pair more  improvement We can easily study the financial strength of multi-faceted trading SL Currency28 Pair Dashboard strength meter which creates multiple charts in a single window based on the price action of each currency in relation to
SL Session Strength 28 Pair
Chalin Saranga Jayathilake
5 (19)
SL Curruncy impulse  https://www.mql5.com/en/market/product/82593 SL Session Strength 28 Pair flow of this intraday Asian London New York Sessions strength.SL Session Strength 28 indicator best for intraday scalper. market powerful move time you can catch best symbol. because you'll know which currencies are best to trade at that moment. Buy strong currencies and sell weak currencies (Diverging currencies).   Suggested timeframes to trading : M5 - M15 - M30 - You can however just change session
SL Trend Screener
Chalin Saranga Jayathilake
5 (4)
if you want more information please  pm me HI guys this my developing indicator 1st version alert logic work well.. this indicator using can you stronger currency and top weaker currency find well,this;s indicator multy MTF time frame strength work.very good for SL trend screener intraday trader and long time trader, very easily can you watch stronger and weaker index.I hope to more improve this future further,thank you
SL Currency Heatmap
Chalin Saranga Jayathilake
5 (5)
Back testing can't; get indicator full performance  Trading the currency markets is a complex business. With so many pairs and multiple timeframes it is almost impossible to monitor them all – but with with the Currency Heatmap you can. The Currency Heatmap indicator delivers the information you need to base your trading decisions on the entire spectrum of currency pairs derived from the 8 major currencies; namely the US dollar, the Euro, the British Pound, the Swiss Franc, the Japanese Yen, t
SL Dash Gap Trading
Chalin Saranga Jayathilake
5 (1)
Here on some thoughts about the sl dash information and layout for strength indicators for clarity and view. We have Bid Ratio, Relative Strength, Currency Strength, Absolute Strength, Gap and Sync. Bid Ratio is based on the current price as a percentage of the Day Range. This range can be based on the Day Bar (the time elapsed since the brokers open time) or Rolling (the last 24 hours). Relative Strength is the Bid Ratio of a pair expressed in a range of gap diffrent value -9 to +9. Currenc
SL Scalping Arrow
Chalin Saranga Jayathilake
5 (4)
Non-Repainting Indicator dont; s forget this;s work well stronger trend fast markert lower time frame How to trade with  SL Scalping Arrow  * this system trend trading system we trade 15M chart using day tp,if you want identify Accumulation Distribution (H4) i am reccomend my SL Currency Strength Meter 28 Pair monthy weekly strenght you can easy filter best rank symbol list weekly monthy * we dont;s trade trend change time waiting trade next day pullback * if you want golden entry find.  SL Cur
SL Sniper MT4
Chalin Saranga Jayathilake
5 (2)
Suggested timeframes to trading :M1-M5 - M15-M30 -H1  wait london and newyork markert open after wait best then select the best strong index and weakest index by sniper. histogram is indicated by one arrow at a time. The signal in the end direction of weak and strong all red and green mean trending index,natural market is displayed only in white SL Sniper  Indicator can be used for short term long and scalping. It is better to confirm entry signals with high low price action. currency is gaining
SL Curruncy impulse
Chalin Saranga Jayathilake
5 (2)
SL Curruncy impulse flow of this intraday Asian London New York Sessions strength.SL Curruncy impulse indicator best for intraday scalper. market powerful move time you can catch best symbol. because you'll know which currencies are best to trade at that moment. Buy strong currencies and sell weak currencies   Suggested timeframes to trading : M1 - M5 - M15 - M30 -H1 You can however just change SL Curruncy impulse  to check in the settings. Bear in mind that scanning very low timeframes.   How d
SL Sniper
Chalin Saranga Jayathilake
SL Sniper I coded. to trade with the trap system of the main market with vsa   for more information and you want vsa system  please  pm me Suggested timeframes to trading : M1- M2- M3- M5 - M15-M30 -H1  Wait london and newyork markert open after wait best then select the best strong index and weakest index by sniper Histogram is indicated by one arrow at a time. The signal in the end direction of weak and strong All red and green mean trending index,natural market is displayed only in white SL
SL Trend Scanner MT5
Chalin Saranga Jayathilake
HI guys this my developing indicator 1st version alert logic work well.. this indicator using can you stronger currency and top weaker currency find well,this;s indicator multy MTF time frame strength work.very good for SL trend screener intraday trader and long time trader, very easily can you watch stronger and weaker index.I hope to more improve this future further,thank you if you want more information please  pm me
筛选:
Christos Ioulianos
98
Christos Ioulianos 2023.04.01 18:41 
 

用户没有留下任何评级信息

elite luis
3351
elite luis 2023.02.05 17:11 
 

用户没有留下任何评级信息

swarren777
1037
swarren777 2022.09.26 05:41 
 

GREAT TOOL FOR TRADING TRENDS THE OPEN TO DATE RESET ALLOWS U TO REALLY GET IN SYNC WITH PRICE ACTION

Qaisar Abbas
56
Qaisar Abbas 2022.01.31 22:08 
 

This is such a beautiful work by the author, you do not need to scan or monitor 28 pairs' charts- the good thing is you can set it to a fixed time frame or relative one, which gives it a edge over other currency strength indicators. Also, dashboard is very useful which gives insight into the potential buy/sell side of the market. Highly recommended tool!

Radzhin
479
Radzhin 2022.01.30 08:04 
 

This is the best indicator among all currency strength indicators I've come across in MQL5. The interface of the indicator is very clear and understandable! Technical support is excellent as always! I am very satisfied!

qawassefan
148
qawassefan 2021.09.08 19:12 
 

One of the best available indicators...!!!

Chalin Saranga Jayathilake
6314
来自开发人员的回复 Chalin Saranga Jayathilake 2021.10.31 13:33
Thanks for the feedback
HomayounT
343
HomayounT 2021.08.16 20:07 
 

It s a couple weeks I m using it. It is a trustable indicator among many similar ones in market. It s handy and very useful. There are various ways to get benefit out of that. Specially I love the table in which colours giving a prompt brief of trending pairs in market in selected TF. Author is quick response and active and supportive against questions. I recommend.

Chalin Saranga Jayathilake
6314
来自开发人员的回复 Chalin Saranga Jayathilake 2021.08.16 20:21
Thanks for the feedback
Jennynguyen777
25
Jennynguyen777 2021.05.31 11:16 
 

It's a great trading tool, very good to use in daily trading, thanks for the great support Chalin Saranga

Chalin Saranga Jayathilake
6314
来自开发人员的回复 Chalin Saranga Jayathilake 2021.10.31 13:32
Thanks for the feedback
maykelmax
326
maykelmax 2021.05.25 10:30 
 

It gives me the best of the best advice between the currency strengths. When a given currency heats up in one side, the indicator will tell you about it and it works well with the supports and resistance ... I recommend

Chalin Saranga Jayathilake
6314
来自开发人员的回复 Chalin Saranga Jayathilake 2021.05.25 12:15
Thanks for the feedback
kusai gharibeh
252
kusai gharibeh 2021.04.07 14:57 
 

very good and excellent indicator.the nice thing about it,you can change to any currency ,and it will save everthing you installed to your charts.i hope if the gold and silver were there it will be great and awsome.Great job Chalin.i am very happy with it.thank you.

stonesmooth
179
stonesmooth 2021.03.23 18:07 
 

Cool Beans!

Ted NO FX
1728
Ted NO FX 2021.03.14 22:58 
 

Best strenght indicator. Like it so much!

Paulina Andrea Madariaga Figueroa
4187
 

I have bought many products in mql5, almost 100, with the only one that I see the greatest security in my operations is with this author, I bought his complete collection, and the technique is incredible.

Paulus Nangoy
3551
Paulus Nangoy 2020.11.13 12:45 
 

I have a few currency strength indicators, so far this one is the most useful.

Inception12
60
Inception12 2020.09.24 22:06 
 

This is the best currency strength on the market right now at a very low price and very easy to understand. Highly recommended.

Chalin Saranga Jayathilake
6314
来自开发人员的回复 Chalin Saranga Jayathilake 2020.10.21 02:54
thank your word. lot of people pay an unaffordable price. for valueless Currency Strength indicator.
we are new seller this site. our product never trending world. but i will trust one you can earn money with SL Currency Strength Meter 28 Pair
Tim Eubanks
5763
Tim Eubanks 2020.08.29 19:13 
 

When I initially purchased this indicator I thought it was pretty good...then came the upgrade and the problems, nothing was working right and there seem to be a lot of confusion. But after several messages with Chalin about the problems occurring with the indicator, he figured out the problems and corrected the indicator to function better than the original, I want to thank him for taking the time to provide good customer support and developing a real good currency strength meter that will enhance any trading system as the SL Currency Strength Meter 28 Pair indicator is very accurate at pinpointing out the currency pairs that are gaining strength or weakening in strength thus allowing your trading system to do what it does best, showing you the entry and exits of a winning trade!

subzero29
724
subzero29 2020.07.23 19:58 
 

This is great. Works exceptionally well. I would highly recommend this.

jvp999
304
jvp999 2020.07.21 13:34 
 

excellent product..highly rated....5 STARS with great after service

Legacy6
631
Legacy6 2020.07.08 17:18 
 

I was browsing the market one day for tools to help me improve my trading and came across this indicator. I decided to give it a shot since I was able to rent it for just $15 for an entire year. I thought to myself, worse case scenario I'm out $15 if it doesn't work as advertised or if I don't like it. Well, I have been blown away by how much this has helped me and improved my trading. I have already made 110x's the cost to rent it in profit in my live trading account. Needless to say that I made the right choice. The support has been incredible, even with the language barrier. If you are looking for something to help put you on the right side of the market more times than not, look no further.

suresh de silva
55
suresh de silva 2020.06.19 06:26 
 

用户没有留下任何评级信息

12
回复评论
版本 2.8 2022.05.20
At the request of customers. Updated old versions again
版本 2.7 2021.12.30
new year gif.performance improvements
版本 2.6 2020.10.14
customer request rule
版本 2.5 2020.10.12
fix alert error
版本 2.4 2020.10.06
push alert error fix
版本 2.3 2020.10.05
alert error fix
版本 2.2 2020.10.03
updated version
版本 2.1 2020.09.24
updated version
版本 2.0 2020.08.26
version updated
版本 1.90 2020.08.24
version updated
版本 1.80 2020.08.20
updated version
版本 1.70 2020.06.04
Symbols' suffix
版本 1.60 2020.06.03
Mtf histogram update,please check everybody shifted day open(example shifted 3 means the day open will be shifted by 3x30 minutes = 90 minutes.
版本 1.40 2020.05.20
strength line update,,hidden and show all index line
版本 1.30 2020.05.08
horizontal line update
版本 1.10 2020.05.05
performance improvements