EasyFX Trader
- 实用工具
- APTHUR MONTGOMERY MCCAMMON
- 版本: 2.10
- 更新: 12 五月 2020
- 激活: 5
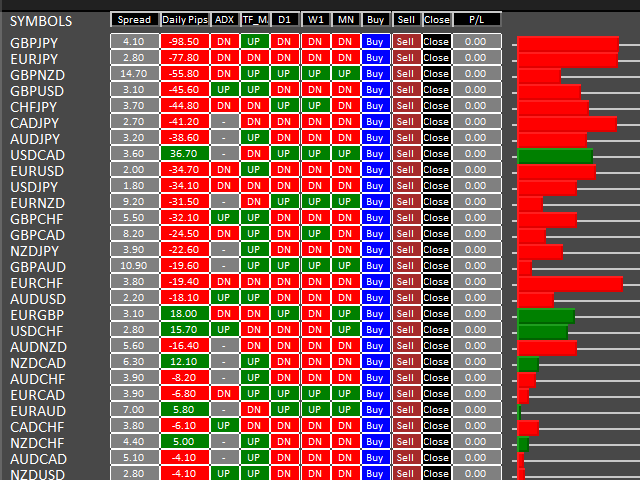
The EasyFX Trader is a very unique and customizable dashboard for manual trading. It is placed in the Expert folder but is not an auto trading robot. You input all the parameter and the dashboard will monitor and let you know when there is a good trading opportunity. The tool is simple to use whether you're experienced or just a beginner. It was designed for all types of trading styles including price action, day, swing, trend trader, or scalper. Each column is described below.
When you load the dashboard it you to input the symbols for your broker. You have the option to input all the symbols or just the pairs you want to monitor. You will also need to input the period for ADX. The default is 14. Also the upper timeframe moving average. The default is set to 1HR. You also need to set the moving average for the Daily, Weekly and monthly timeframes to get trend direction. The default settings can be accepted.
The Symbol column lists all the symbols for your broker. Simply click on any of the symbols and it brings up that chart as your current chart. To bring up any chart just click on the symbol and it will bring up that chart. For example if the dashboard is running on EURUSD and you click on GBPUSD it will replace EURUSD chart with GBPUSD.
The Spread column display the current spread for each pair.
The Daily Pips column displays the pips movement for each pair from the Daily Open to current close. If the color is green, the pair is moving up. If the color is red the pair is going down. The symbols are sorted by the biggest pip movers at the top. This lets you know which are the best pairs to trade and the direction you should be trading. If the color is green only look for Buy trades. If the color is red only look for Sell trades.
The ADX column display UP and green when the pair is trending up on the particular pair. It will display DN and red if the pair is trending down. If the color is grey then that pair is ranging. Choose a pair that is either green and UP to buy or red and DN to sell.
The TF_MA column shows the moving average trend of any upper timeframe you choose. For example if you want to scalp on the 5M chart you may set this to 1HR chart to know what direction the trend is on this upper timeframe. If the color is green and UP then only look for Buy trades on the lower 5M chart. If the color is red and DN only look for Sell trades on t he lower 5M chart.
Use the same principle above for 5M and 1HR as the trend for other timeframes you wish to trade. You can pair the 15M and the 1H or 4H. The 30M with 4H. The 1HR with 4HR, the 4H with the Daily. The Daily with the Weekly. This principle is best to help you stay in the trend and trade more successfully.
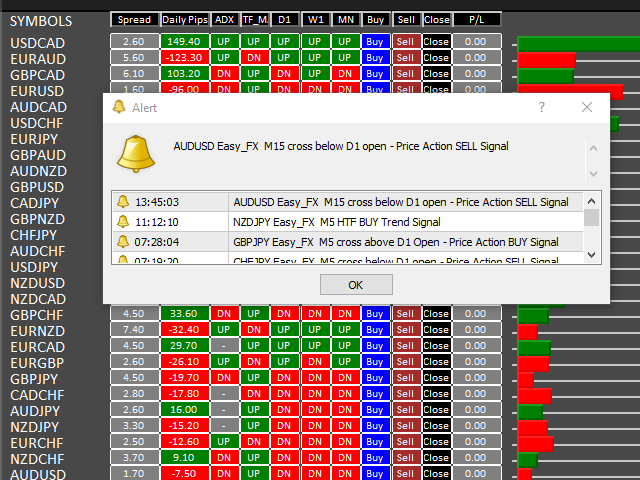
For all these pairings you will get a popup alert when the lower timeframe aligns with and going in the direction of the upper timeframe. For example, if the 1HR chart is in an uptrend and the 5M chant begins to trend up, you will get a popup alert to tell you that there is a Buy Signal for the respected pair. The popup alert will sound for any two timeframes you choose to trade. 15M and the 1H or 4H. The 30M with 4H. The 1HR with 4HR, the 4H with the Daily. The Daily with the Weekly.
Use any oscillator like Stochastics, CCI or RSI for entry.
The D1, WI and MN columns show the moving average trend on these upper timeframes. If the color is green and UP the trend is going up on the individual timeframe. If the color is red and DN the trend is going down on that particular timeframe. If you're a trend or swing trader and they all have the same color (green and UP or red and DN) then it may be a good time to go to the 1HR or 4HR charts to look for an entry in the direction of the color. These trends can run for several hundreds or thousands of pips.
The Buy, Sell, Close and P/L columns are self explanatory. Click on the Buy and it will open a buy trade at current market value for the selected pair. If you click on Sell it will open a sell trade at current market value for the selected pair. If you click on Close it will close the open trade for the selected pair. The P/L column shows each open trade whether they are in profit or loss.
The final column shows the direction of the daily candle. If the color is green then the buyers are in control and pushing price up. You should only look for buying opportunities. If the color is red then sellers are in control and pushing price down. You should only look for selling opportunities.

