• 概述
  • 评论 (75)
  • 评论 (223)
  • 新特性

Trend Screener Pro MT5

4.88

使用趋势筛选指标释放趋势交易的力量:由模糊逻辑和多货币系统提供支持的终极趋势交易解决方案!

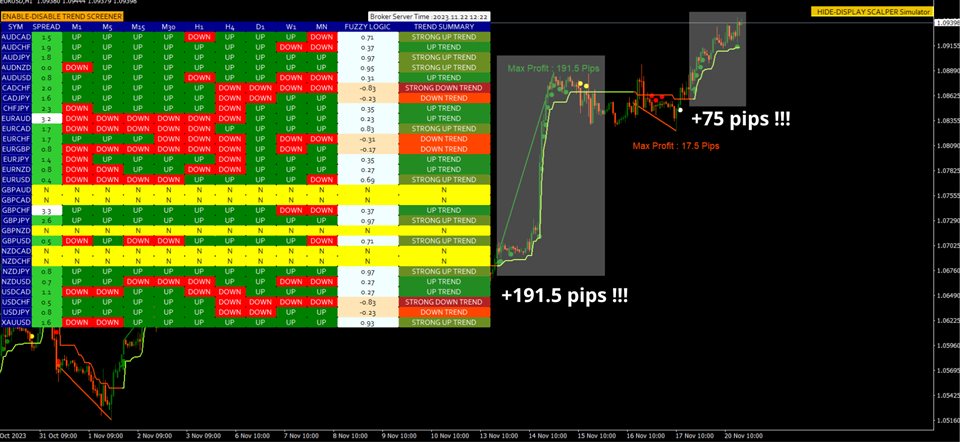
使用趋势筛选器(由模糊逻辑提供支持的革命性趋势指标)提升您的趋势交易。 它是一个强大的趋势跟踪指标,结合了超过 13 种高级工具和功能以及 3 种交易策略,使其成为使您的 Metatrader 成为趋势分析器的多功能选择。

限时优惠:趋势筛选指标终身仅需 50 美元。 ( 原价 125$ ) (优惠延长)

体验趋势筛选器 100% 无需重新绘制的准确性,确保您的交易决策不受过去价格变化的影响。 释放多时间框架和多货币功能的多功能性,使您能够以无与伦比的信心在外汇、商品、加密货币和指数领域进行交易。 利用 Trend Screener 的综合策略套件增强您的交易:

- 趋势跟踪策略和趋势延续策略:趋势筛选器的趋势跟踪策略提供清晰的趋势延续信号,让您有效捕捉趋势走势并管理风险。

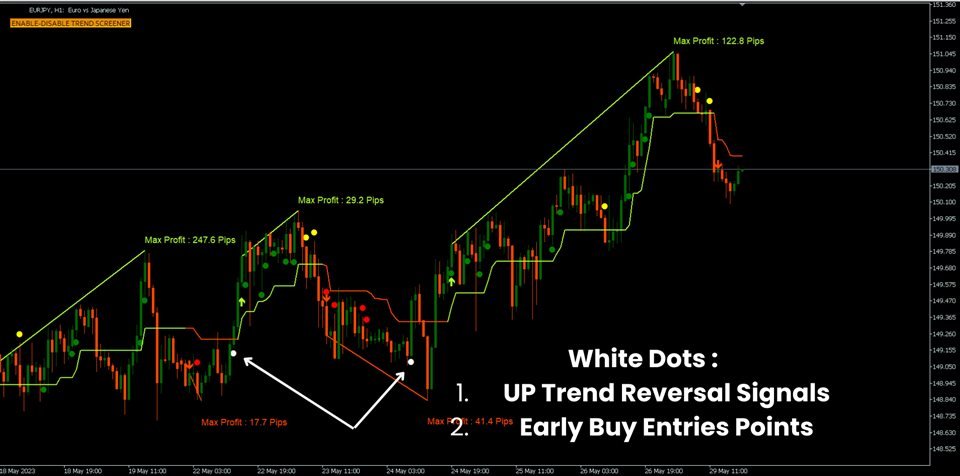
- 反转策略和早期入场点策略:趋势筛选器的反转策略可检测市场方向的潜在变化,使您能够预测趋势反转并利用疲弱的市场趋势。通过早期入场点,您可以在潜在的趋势变化之前定位自己 获取可观的利润。

- 倒卖策略:趋势筛选器的倒卖策略专为快节奏的日内交易和短期交易而设计,让您能够利用单个交易日内的小幅价格变动获利。


趋势系统

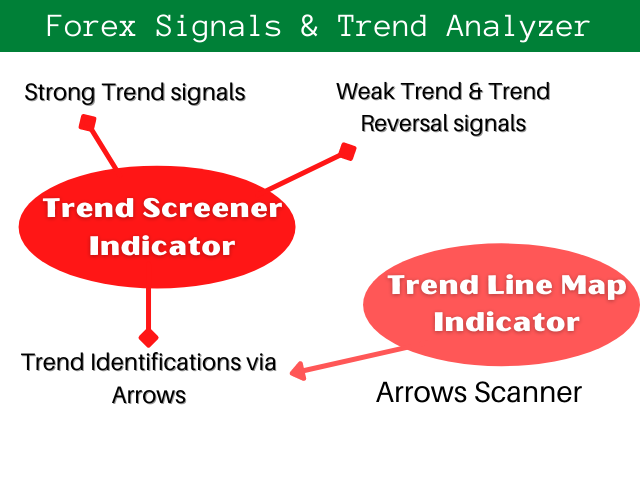
我们的趋势系统由 2 个指标组成:

   - 趋势筛选指标:显示趋势仪表板、图表中的趋势线、入场点和所有主要功能。

   - 趋势线图指示器:将买入和卖出显示为仪表板,生成多货币警报并显示活跃信号盈利/亏损...等。

          下载趋势线图指标

高级工具和功能

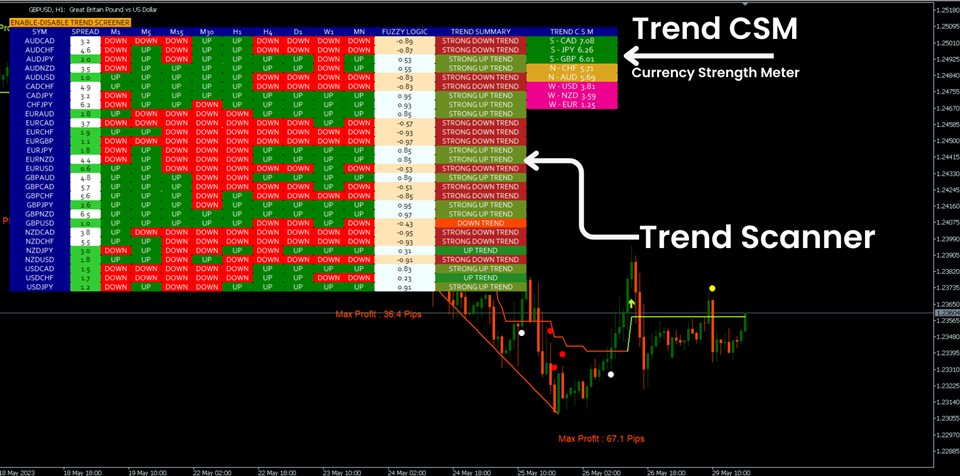
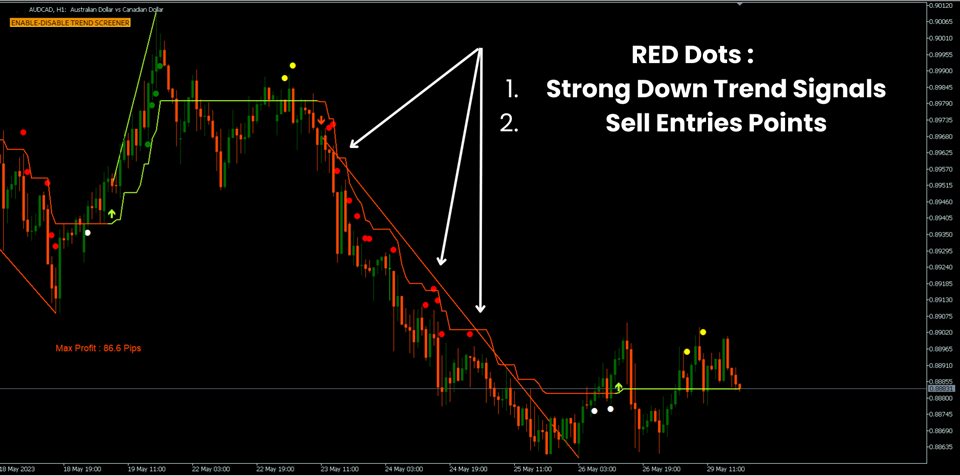
1.智能趋势线工具:根据当前市场情况动态调整。 它比静态趋势线更加复杂,可以用来更准确地识别潜在的趋势变化。 通过动态调整的趋势线可视化当前趋势。

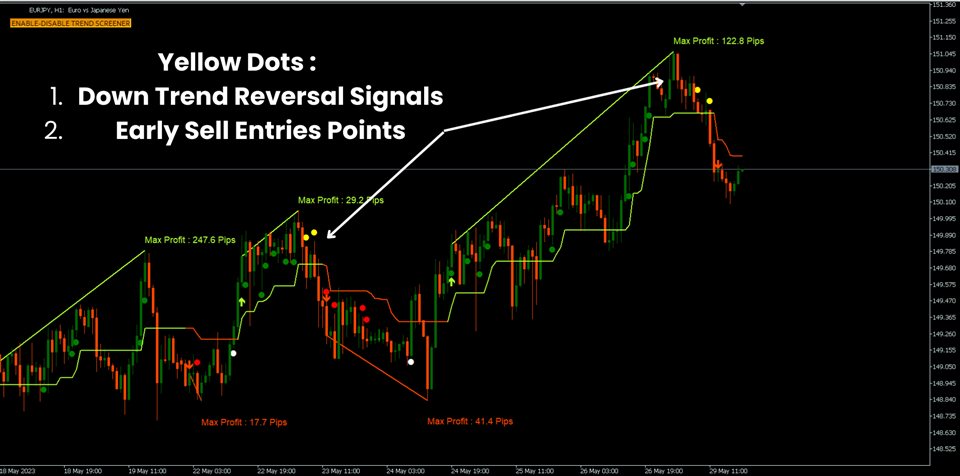
2. 使用反转点的趋势反转工具:帮助交易者识别潜在变化的工具。 反转点是一种使用小点来标记市场潜在转折点和弱势趋势时期的指标。

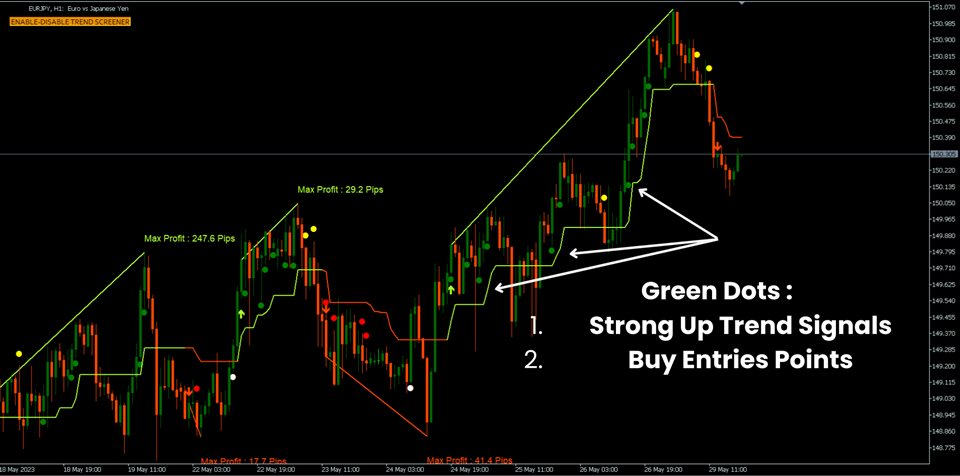
3. 使用强趋势点的趋势动量工具:帮助交易者识别和确认市场强趋势的工具。 它的工作原理是识别价格剧烈波动的时期,并在价格图表上用点标记它们。

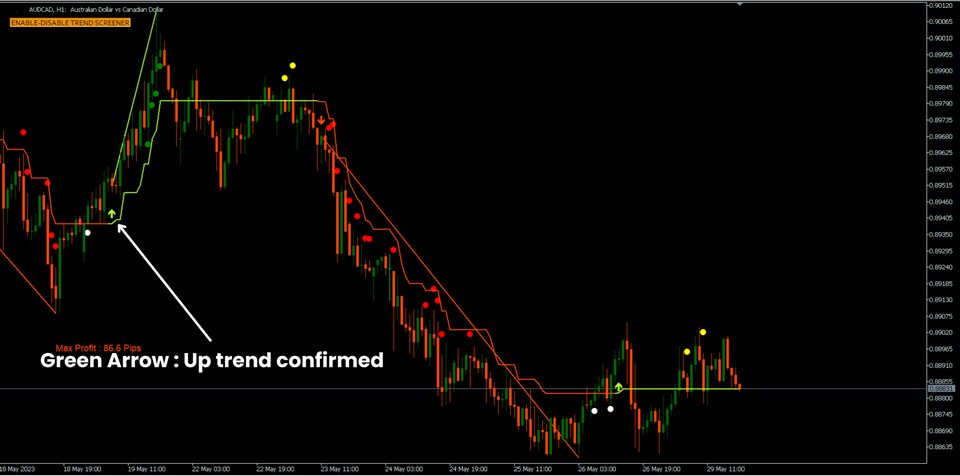
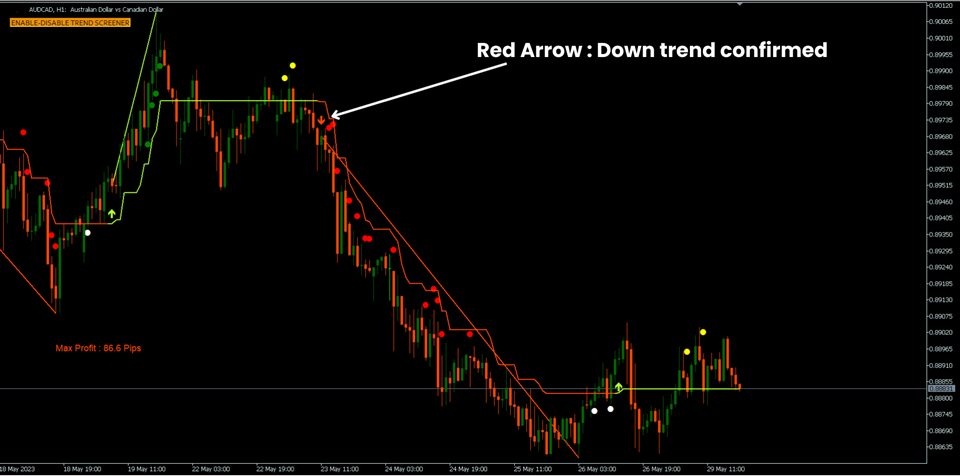
4. 使用箭头的趋势确认工具:帮助交易者识别并确认现有趋势延续的工具。 它的工作原理是在价格图表上生成箭头来表示潜在的趋势延续点。

5. 基于趋势的货币强弱工具:衡量货币随时间的相对强弱程度的工具。 它通过分析价格变动和识别货币对的趋势来实现这一点。 然后,该指标根据每种货币在这些趋势中的表现为其分配强度值。

6. Trend CSM 的测距对查找器:一种将测距对的识别与 Trend CSM 工具的应用相结合的技术。 这种方法可能会帮助交易者识别处于盘整阶段的区间货币对。

7. Trending CSM 的趋势对查找器:一种将大多数趋势对的识别与 Trend CSM 工具的应用相结合的技术。 这种方法可能会帮助交易者识别大多数趋势货币对。

8. 多时间范围趋势扫描工具:识别多个时间范围趋势的工具。 这对于想要识别可能长期持续的趋势的交易者来说可能很有帮助。

9. 多货币趋势扫描工具:帮助交易者同时识别多种货币趋势的工具。 它可用于识别货币对、主要货币和交叉货币对的趋势。

10. 基于模糊逻辑 趋势总结:模糊逻辑是一种处理不精确和不确定信息的非传统逻辑。 它基于这样的理念:真理有不同程度,而不仅仅是真与假。 这使得它非常适合分析金融市场的趋势,而金融市场的特点往往是不确定性和噪音。

11. 图表更换工具:使用扫描仪中的按钮在对之间切换的工具。

12. 多货币价差扫描仪工具:通过指标扫描仪监控所有货币对价差的工具。

13. 使用智能趋势线进行动态支撑和阻力检测:一种帮助交易者根据价格行为和图表中的趋势线识别短期支撑和阻力的技术。

14. 基于自定义 TP 的剥头皮模拟器:一种根据之前的价格走势模拟自定义止盈 (TP) 水平并确定剥头皮的最佳 TP 的工具。

15. 支持所有市场:外汇、指数、金属、加密货币...等。


文档

所有趋势筛选器文档(说明)和策略详细信息均可在我们的 MQL5 博客的这篇文章中找到:点击此处


YouTube 视频教程

通过查看我们的 MQL5 博客,您会发现许多 YouTube 视频教程,其中我们解释了如何使用趋势筛选指标以及如何使用趋势筛选指标进行交易。 单击此处查找所有视频。


趋势筛选器MT4版本

MT4 版本可在此处获取,请点击此处。


接触

如果您有任何疑问或需要帮助,请通过私人消息与我联系。


作者

SAYADI ACHREF,金融科技软件工程师和 Finansya 创始人。

评论 20
1805059
25
1805059 2024.06.04 18:46 
 

Bought this product last week, so far extremely satisfied. I'm still looking for my ideal strategy. I use the weak signals for the trend reversal, and the green/red dots in combination with the RSI/stoch. these give me very useful signals. thanks again

Zim
112
Zim 2024.06.04 00:29 
 

Using this indicator made me feel more comfortable evaluating the market trend situation for trading. I also needed help with a question and Achraf was friendly and punctual in helping me.

cocolo0307
62
cocolo0307 2024.05.15 17:56 
 

I have purchased this indicator 2 days ago. It's a wonderful!! This indicator make me trade easy, simple and extremely helpful to gain profit! I can say this indicator and Sayadi revolutionized my trading method. Just one question here. Is it possible to show popup alert of all pairs and timeframe in one window? For example, I want popup alert about all timeframe of JPYUSD to appear into EURUSD's window.

推荐产品
Trading Utility for Forex Currency Pairs Only not for Gold  Functions Auto Lot Calculation based on Risk Auto stoploss  Auto TakeProfit Breakeven Auto Close Half % Close in percentage with respect to the PIPs Pending Orders BuyLimit Sell Limit with distances BuyStop Sell Stop    with distances Trading Informations Risk in percentage For Multiple trades Combine Takeprofit and Combine Stoplosses
The best time to trade Using this Indicator is when the time reach exactly hour,half,45 minutes,15 minutes and sometimes 5 minutes.. This indicators is helpful to those who trade boom and crash indecies.How to read this indicator first you'll see Blue allow and Red allow all these allows used to indicate or to detect the spike which will happen so the allow happens soon before the spike happen.This indicator works properly only in boom and crash trading thing which you have to consider when
Noize Absorption Index
Ekaterina Saltykova
Noize Absorption Index - is the manual trading system that measures the difference of pressure between bears forces and bulls forces. Green line - is a noize free index that showing curent situation. Zero value of index shows totally choppy/flat market.Values above zero level shows how powerfull bullish wave is and values below zero measures bearish forces.Up arrow appears on bearish market when it's ready to reverse, dn arrow appears on weak bullish market, as a result of reverse expectation.
其中一个数字序列称为“森林火灾序列”。它被公认为最美丽的新序列之一。它的主要特点是该序列避免了线性趋势,即使是最短的趋势。正是这一属性构成了该指标的基础。 在分析金融时间序列时,该指标试图拒绝所有可能的趋势选项。只有当他失败时,他才会认识到趋势的存在并给出适当的信号。这种方法可以让人们正确地确定新趋势开始的时刻。然而,误报也是可能的。为了减少它们的数量,该指标添加了一个额外的过滤器。当新柱打开时会生成信号。在任何情况下都不会发生重绘。 指标参数: Applied Price   - 应用价格常数; Period Main   - 指标的主要周期,其有效值在 5 - 60 之间; Period Additional   - 附加周期,此参数的有效值为 5 - 40; Signal Filter   - 附加信号滤波器,有效值 0 - 99; Alerts   - 启用后,指示器会在出现新信号时提醒您; Send Mail   - 允许指标向电子邮件发送消息; Push   - 允许您发送 Push 消息。
Owl Smart Levels MT5
Sergey Ermolov
4.38 (37)
MT4版本  |   FAQ Owl Smart Levels Indicator 是一個完整的交易系統,包含 Bill Williams 的高級分形、構建正確的市場波浪結構的 Valable ZigZag 以及標記準確入場水平的斐波那契水平等流行的市場分析工具 進入市場和地方獲利。 策略的详细说明 指示灯使用说明 顾问-贸易猫头鹰助手助理 私人用户聊天 ->购买后写信给我,我会将您添加到私人聊天中,您可以在那里下载所有奖金 力量在於簡單! Owl Smart Levels 交易系統非常易於使用,因此適合專業人士和剛開始研究市場並為自己選擇交易策略的人。 策略和指標中沒有隱藏的秘密公式和計算方法,所有策略指標都是公開的。 Owl Smart Levels 允許您快速查看進入交易的信號,突出顯示下訂單的水平並向您發送有關已出現信號的通知。 優點很明顯: 清楚地顯示主要和更高時間框架的趨勢方向。 指示儀器信號的出現。 標記開單、止損設置和固定利潤的水平。 沒有多餘的,只有必要的結構! ZigZag 表示全球趨勢的方向,因此也表示貿易方向。 市場反轉點的短線清楚地表明在什麼水平上構建斐波
Trend Line Map Pro MT5
STE S.S.COMPANY
4.67 (9)
趋势线图指标是趋势筛选器指标的插件。它用作趋势筛选器(趋势线信号)生成的所有信号的扫描仪。 它是基于趋势筛选器指标的趋势线扫描仪。如果您没有 Trend Screener Pro Indicator,Trend Line Map Pro 将无法使用。 It's a Trend Line Scanner based on Trend Screener Indicator. If you don't have Trend Screener Pro Indicator,     the Trend Line Map Pro will not work . 通过访问我们的 MQL5 博客,您可以下载趋势线图指标的免费版本。购买前试用,不受 Metatrader Tester 限制。 :  点击这里 1. 容易获得的优势 根据货币和时间范围显示买入和卖出信号。 评估自图表中出现箭头以来价格上涨或下跌的点数。 (趋势筛选指标箭头) 显示信号的时序。 获取多时间范围和多货币警报以购买和出售警报。 2. 如何使用趋势线图 如何显示买卖信号仪表板? 如果您有任何问题或需
Magic Finger 能帮助你清晰的发现趋势及交易机会。此系统根据经典策略加上个人交易经验制作。您也可以根据此指标加上您的交易风格去编写EA。 手指指向为开仓信号,变色线为趋势确认。如果您是日内交易者,可以选择在交易活跃的时间段内交易,参考变色线作为下单方向依据,手指信号作为过滤器。 如果你是趋势交易者,可以选择在H1以上的周期,在关键价格区域等待手指信号的出现,并入市交易,然后以变色线作为趋势的确认。 止损可以止损圆点作为依据。 输入参数如下: RISK 5 MONEY RISK 2.0 AlertOption ********************************* Local Alert true TimesOfAlerts 2 E-Mail Alert false App PUSH Notification  false ***ADR Option**  *********************************  Display ADR  true  ATR Period  18  Normal Col
Laguerre SuperTrend Clouds   adds an Adaptive Laguerre averaging algorithm and alerts to the widely popular SuperTrend indicator. As the name suggests,   Laguerre SuperTrend Clouds (LSC)   is a trending indicator which works best in trendy (not choppy) markets. The SuperTrend is an extremely popular indicator for intraday and daily trading, and can be used on any timeframe. Incorporating Laguerre's equation to this can facilitate more robust trend detection and smoother filters. The LSC uses the
Master OBV
Thalles Nascimento De Carvalho
The MasterOBV indicator is a powerful technical analysis tool that utilizes volume, positive correlation, and a Moving Average (MA) to enhance trend identification in financial markets. By incorporating assets with positive correlation through the indicator menu, MasterOBV provides a refined approach to assessing the strength and direction of trends. The inclusion of the Moving Average adds additional smoothing to price movements, aiding in a more accurate tracking of the underlying trend over
An indicator of pattern #31 ("Long Island") from Encyclopedia of Chart Patterns by Thomas N. Bulkowski. The second gap is in the opposite direction. Parameters: Alerts - show alert when an arrow appears   Push - send a push notification when an arrow appears (requires configuration in the terminal) GapSize - minimum gap size in points ArrowType - a symbol from 1 to 17 ArrowVShift - vertical shift of arrows in points   ShowLevels - show levels ColUp - color of an upward line ColDn - color of a
首先,值得强调的是,这个交易工具是非重绘、非重画和非滞后的指标,非常适合专业交易。 在线课程,用户手册和演示。 智能价格行动概念指标是一个非常强大的工具,既适用于新手,也适用于经验丰富的交易者。它将超过20个有用的指标合并到一个指标中,结合了高级交易思想,如内圈交易员分析和智能资金概念交易策略。该指标侧重于智能资金概念,提供有关大型机构交易方式的见解,帮助预测它们的动向。 它在流动性分析方面尤其擅长,有助于理解机构的交易方式。它擅长预测市场趋势,并仔细分析价格波动。通过将您的交易与机构策略对齐,您可以更准确地预测市场走向。该指标多才多艺,擅长分析市场结构,识别重要的订单区块,并识别各种模式。 它擅长识别BOS和CHoCH等模式,理解动量的转变,并突出显示供需强劲的关键区域。它还擅长发现强大的不平衡,并分析价格创造更高高点或更低低点的模式。如果您使用斐波那契回撤工具,该指标可以满足您的需求。它还可以识别相等的高点和低点,分析不同的时间框架,并通过仪表板显示数据。 对于使用更高级策略的交易者,该指标提供了工具,如公平价值差指标和优惠和折扣区域的识别。它特别关注高时间框架订单
Volality Index Scalper
Lesedi Oliver Seilane
5 (1)
Volality Index scalper indicator  Meant for Volality pairs such as Volality 10, 25, 50, 75 and 100 The indicator works on all timeframes from the 1 minute to the monthly timeframe the indicator is non repaint the indicator has 3 entry settings 1 color change on zero cross 2 color change on slope change 3 color change on signal line cross Orange line is your sell signal Blue line is your buy signal.
To download MT4 version please click here . - This is the exact conversion from TradingView: " PA-Adaptive Hull Parabolic " By "Loxx". - This is a non-repaint and light processing load indicator - You can message in private chat for further changes you need. - All input options are available. - Buffers are available for processing within EAs. - Highlight option is omitted as does not show good in Metatrader. 
Trend Reader Indicator MT5
Lachezar Krastev
5 (2)
SUPER SALE! --> BUY Trend Reader Indicator with -$180 OFF and GET a BONUS EA: News Scope EA PRO with AMAZING results! NOTE: Trend Reader Indicator PROMO price: $117 (The next price $297) - The offer ends soon! Click here to check News Scope EA PRO results and learn more about the promotion! Trend Reader Indicator is a revolutionary trading indicator designed to empower forex traders with the tools they need to make informed trading decisions. This cutting-edge indicator utilizes complex mathema
Your Trend Friend
Luigi Nunes Labigalini
5 (1)
The trend is your friend! Look at the color of the indicator and trade on that direction. It does not  repaint. After each candle is closed, that's the color of the trend. You can focus on shorter faster trends or major trends, just test what's most suitable for the symbol and timeframe you trade. Simply change the "Length" parameter and the indicator will automatically adapt. You can also change the color, thickness and style of the lines. Download and give it a try! There are big movements
Candle Pattern Finder MT5
Pavel Zamoshnikov
4.33 (6)
This indicator searches for candlestick patterns. Its operation principle is based on Candlestick Charting Explained: Timeless Techniques for Trading Stocks and Futures by Gregory L. Morris. If a pattern is detected, the indicator displays a message at a bar closure. If you trade using the MetaTrader 4 terminal, then you can download the full analogue of the " Candle Pattern Finder for MT4 " indicator It recognizes the following patterns: Bullish/Bearish (possible settings in brackets) : Hamme
该指标将向您显示您已经为图表上的每个订单设置的 TP 和 SL 值(以该货币表示)(接近交易/订单行),这将帮助您估算每个订单的利润和损失。它还会向您显示 PIP 值。显示的格式是“我们的损益/PIP 值的货币值”。 TP 值将以绿色显示,SL 值将以红色显示。 如有任何问题或了解更多信息,请随时通过 fxlife.asia@hotmail.com 或 fxlife.asia@yahoo.com 与卖家联系 (而指标中即将加入的下一个功能是“自动或半自动TP和SL设置”,我们的客户将免费获得更新版本。谢谢...^_^) (或者如果您认为在指示中应该增加一些功能,请随时告诉我们) ========================================================
Key level wedge MT5
Presley Annais Tatenda Meck
The   Key level wedge MT5   indicator automatically draws rising wedge pattern and falling wedge pattern for you on the chart. This pattern is really good when used as a confirmation entry at key support & resistance, supply & demand and reversal zones. Advantages  The   Key level wedge MT5   block DOES NOT RE-PAINT, giving you confidence when a signal appears and also helps when looking back.  The   Key level wedge MT5   includes an on/off button on the chart to easily keep the charts cle
Be notified of every color change of Heiken Ashi (HA) candles. The indicator will trigger past and new signals every time that HA candles change their colors. ( Note : this tool is based on the code of Heiken Ashi indicator developed by MetaQuotes Software Corp.) Features The signals are triggered at closing of last bar/opening of a new bar; Any kind of alerts can be enabled: Dialog Box, Email message, SMS notifications for smartphones and tablets, and Sound alerts; By default, up arrows are p
To get access to MT4 version please click here . - This is the exact conversion from TradingView: "Stochastic Momentum Index" By "UCSgears". - This is a popular version of stochastic oscillator on tradingview. - This is a light-load processing and non-repaint indicator. - Buffers are available for the lines on chart. - You can message in private chat for further changes you need. Thanks for downloading
HMA Trend Professional MT5
Pavel Zamoshnikov
4.5 (6)
Improved version of the free HMA Trend indicator (for MetaTrader 4) with statistical analysis. HMA Trend is a trend indicator based on the Hull Moving Average (HMA) with two periods. HMA with a slow period identifies the trend, while HMA with a fast period determines the short-term movements and signals in the trend direction. The main differences from the free version: Ability to predict the probability of a trend reversal using analysis of history data. Plotting statistical charts for analyz
Blahtech Market Profile MT5
Blahtech Limited
5 (8)
Was: $249  Now: $99   Market Profile defines a number of day types that can help the trader to determine market behaviour. A key feature is the Value Area, representing the range of price action where 70% of trading took place. Understanding the Value Area can give traders valuable insight into market direction and establish the higher odds trade. It is an excellent addition to any system you may be using. Inspired by Jim Dalton’s book “Mind Over Markets”, this indicator is designed to suit the
Incinerat8
Paulos Ngwenya
This algorithm uses real time data to generate signals with an accuracy rate of 80%. It shows entries and where you should place both the stoploss and the take profit for each trade. It determines trend! It can even help you to become a signal provider! And it can generate up to 8 signals a day! You get access to a free forex trading community  Operates on any broker compatible to synthetic indices and forex   if you need any assistance whatsapp +2774 35 35 744 or telegram link @pipsempire01
Highly configurable Adx indicator. Features: Highly customizable alert functions (at levels, crosses, direction changes via email, push, sound, popup) Multi timeframe ability Color customization (at levels, crosses, direction changes) Linear interpolation and histogram mode options Works on strategy tester in multi timeframe mode (at weekend without ticks also) Adjustable Levels Parameters: ADX   Timeframe:  You can set the lower/higher timeframes for Adx. ADX   Bar Shift:   you can set the
FREE
>>> BIG SALE PROMOTION: 50% OFF + GIFT EA!  - Promo price: $64 / Regular price $129 <<< - The promotion will end soon! The Forex Trend Tracker is an advanced tool designed to enhance the trading capabilities of forex traders. This sophisticated indicator uses complex mathematical formulas alongside the Average True Range (ATR) to detect the beginnings of new upward and downward trends in the forex market. It offers visual cues and real-time alerts to give traders a competitive advantage in th
[ MT4 Version ] Supply and Demand Multitimeframe Supply and Demand Multitimeframe is the first indicator in the market that combines multiple aspects like trading volume, price structure and momentum to identify Supply and Demand zones for every asset. The Supply and Demand indicator analyzes simultaneously up to 4 different TFs and represents their information in the current graph. Its interactive UI highlights everytime the price enters a Supply or Demand zone even if the zones are not visible
PZ Trend Trading MT5
PZ TRADING SLU
3.67 (3)
许多盈利交易者不仅知道如何识别市场趋势,而且也能把握趋势建立后的交易机会。 Pz 趋势交易 指标设计用来在趋势行情中尽可能的赚取利润。 已建立的趋势提供了一揽子交易机会,但大多数趋势交易指标完全忽视了它们,让交易者在趋势行情时完全不知道该如何做!一般趋势指标只通知有关的趋势变化,但根本不足以得到卓越的回报. Pz 趋势交易 指标比一般趋势指标显示多达 20 倍的交易 , 因为它注重所谓的市场时机。它不仅显示当前的市场趋势,也有回调,内柱线的突破和调整。它令您在趋势回调之后介入,安全的柱线内突破金字塔加仓,以及发现潜在的反转,和已知的调整。 趋势改变 一个趋势改变在市场方向变化时发生。趋势变化在图表上用带数字的彩色圆圈显示。蓝色 (1) 信号为上涨开始, 而红色 (1) 信号为下跌开始。趋势变化并非评估当前价格动作的结果, 它意味着交易设置是不定时地。如果您正确使用本指标, 在趋势变化时, 您将将已经入场 (参看下面的调整)。 回调 但凡趋势在运动中,行情上下抖动,盈利者收割利润,且其它参与者入场。趋势回调代表好的买入机会,通常是由主力获利离场导致。如果行情在回调后回归上行, 指
FFx Watcher Pro MT5
Eric Venturi-Bloxs
3.67 (3)
The FFx Watcher PRO is a dashboard displaying on a single chart the current direction of up to 15 standard indicators and up to 21 timeframes. It has 2 different modes: Watcher mode: Multi Indicators User is able to select up to 15 indicators to be displayed User is able to select up to 21 timeframes to be displayed Watcher mode: Multi Pairs User is able to select any number of pairs/symbols User is able to select up to 21 timeframes to be displayed This mode uses one of the standard indicators
PipFinite Exit EDGE MT5
Karlo Wilson Vendiola
4.89 (36)
Did You Have A Profitable Trade But Suddenly Reversed? In a solid strategy, exiting a trade is equally important as entering. Exit EDGE helps maximize your current trade profit and avoid turning winning trades to losers. Never Miss An Exit Signal Again Monitor all pairs and timeframes in just 1 chart www.mql5.com/en/blogs/post/726558 How To Trade You can close your open trades as soon as you receive a signal Close your Buy orders if you receive an Exit Buy Signal. Close your Sell orde
该产品的买家也购买
Atomic Analyst MT5
Issam Kassas
5 (14)
首先值得强调的是,该交易指标是非重绘、非延迟的指标,这使其成为手动和机器人交易的理想选择。 用户手册:设置、输入和策略。 Atomic Analyst是一种PA价格行动指标,利用价格的力量和动量来寻找市场上更好的机会。配备了高级过滤器,可帮助去除噪音和假信号,并提高交易潜力。使用多层复杂的指标,Atomic Analyst扫描图表,并将复杂的数学计算转化为任何初学者都能理解并用来做出一致交易决策的简单信号和颜色。 “Atomic Analyst”是专为新手和经验丰富的交易者量身定制的综合交易解决方案。它将高级指标和一流功能融合为一体的交易策略,使其成为所有类型交易者的多功能选择。 日内交易和剥头皮策略:专为快速准确的日内交易和短期交易而设计。 日内和摆动交易策略:可用作追求价格大幅波动的日内和摆动交易者的可靠工具。 多货币和市场:凭借其可靠的精度,在不同的工具和市场上运作。 多个时间框架:可在多个时间框架上使用,性能良好。 稳定性:所有指标均不重绘、不重绘和不滞后,确保可靠的信号。 信号清晰度:提供箭头信号,用于清晰的入场和出场点。 实时警报:通过交易入场、SL和TP警报通知交
TPSpro RFI Levels MT5
Roman Podpora
5 (8)
Reversal First Impulse levels (RFI)      INSTRUCTIONS        RUS       -       ENG              R ecommended to use with an indicator   -   TREND PRO -  Version MT4                 A key element in trading is zones or levels from which decisions to buy or sell a trading instrument are made. Despite attempts by major players to conceal their presence in the market, they inevitably leave traces. Our task was to learn how to identify these traces and interpret them correctly. Main functions:: Di
XQ Indicator MetaTrader 5
Marzena Maria Szmit
5 (1)
Step into the realm of Forex trading with confidence and precision using XQ, a cutting-edge Forex indicator designed to elevate your trading game to unprecedented heights. Whether you're a seasoned trader or just stepping into the world of currency exchange, XQ Forex Indicator empowers you with the insights and signals needed to make informed trading decisions. The signal conditions are a combination of three indicators, and XQ Forex Indicator only display  medium and long-term trends . The ind
TrendMaestro5
Stefano Frisetti
note: this indicator is for METATRADER4, if you want the version for METATRADER5 this is the link:  https://www.mql5.com/it/market/product/108106 TRENDMAESTRO ver 2.4 TRENDMAESTRO recognizes a new TREND in the bud, he never makes mistakes. The certainty of identifying a new TREND is priceless. DESCRIPTION TRENDMAESTRO identifies a new TREND in the bud, this indicator examines the volatility, volumes and momentum to identify the moment in which there is an explosion of one or more of these data a
Golden Gate Algo MT5
James David Lane
4 (6)
40% 圣诞优惠!价格将于1月1日涨至$250! 推出GoldenGate Entries:前沿交易解决方案! 发现与GoldenGate Entries(GGE)一同进行交易的革命性方法,这是一款设计用于提升您交易体验的先进指标。GGE提供了一套全面的功能,以赋予用户在交易决策中的精准和信心。 交易对:任意(外汇 - 商品 - 股票 - 股票 - 加密货币) 时间框架:15分钟至H1 主要特点: 买入和卖出箭头指示:接收伴随弹出警报的买入和卖出箭头指示,确保您随时保持了解。 GoldenGate_Algo:通过GoldenGate_Algo深入了解市场状况,这是一款强大的工具,用于评估市场是否处于“超卖”或“超买”状态。 当前趋势分析:通过访问您正在查看的时间框架上的当前趋势,保持领先地位,使您能够将交易与市场当前方向对齐。 内置枢轴点:使用内置的枢轴点轻松识别关键市场点,提供有价值的支撑和阻力水平。 蜡烛扫描器:分析蜡烛形态和图案,找到最佳的入场点并过滤掉低概率的入场。 完全定制:通过完整的定制选项,完全掌控您的交易体验,允许您个性化从
TPA True Price Action indicator reveals the true price action of the market makers through 100% non-repainting signals strictly at the close of a candle! TPA shows entries and re-entries, every time the bulls are definitely stronger than the bears and vice versa. Not to confuse with red/green candles. The shift of power gets confirmed at the earliest stage and is ONE exit strategy of several. There are available now two free parts of the TPA User Guide for our customers. The first "The Basics"
Volume by Price MT5
Brian Collard
5 (4)
The Volume by Price Indicator for MetaTrader 5 features Volume Profile and Market Profile TPO (Time Price Opportunity). Volume and TPO histogram bar and line charts. Volume Footprint charts. TPO letter and block marker collapsed and split structure charts. Session filtering and grouping. Static, dynamic and flexible range segmentation and compositing methods with relative and absolute visualizations. Graphical layering, positioning and styling options to suit the user's analytic and aesthetic n
FxaccurateLS
Shiv Raj Kumawat
WHY IS OUR FXACCCURATE LS MT5 THE PROFITABLE ? PROTECT YOUR CAPITAL WITH RISK MANAGEMENT Gives entry, stop and target levels from time to time. It finds Trading opportunities by analyzing what the price is doing during established trends. POWERFUL INDICATOR FOR A RELIABLE STRATEGIES We have made these indicators with a lot of years of hard work. It is made at a very advanced level. Established trends provide dozens of trading opportunities, but most trend indicators completely ignore them!
PZ Divergence Trading MT5
PZ TRADING SLU
3.75 (4)
棘手的发现和频率稀缺是最可靠的交易方案之一。该指标使用您喜欢的振荡器自动查找并扫描常规和隐藏的发散。 [ 安装指南 | 更新指南 | 故障排除 | 常见问题 | 所有产品 ] 容易交易 发现常规和隐藏的分歧 支持许多知名的振荡器 根据突破实现交易信号 显示适当的止损和获利水平 可配置的振荡器参数 可自定义的颜色和尺寸 按条形过滤大小差异 实现绩效统计 它实现了电子邮件/声音/视觉警报 为了提供广阔的市场前景,可以使用不同的振荡器在同一张图表中多次加载该指标,而不会产生干扰。该指标支持以下振荡器: RSI CCI MACD OSMA 随机 动量 很棒的振荡器 加速器振荡器 威廉姆斯百分比范围 相对活力指数 由于差异可能会扩大很多,尤其是在外汇市场中,因此该指标产生了转折:它在等待交易突破之前等待donchian突破确认差异。最终结果是带有非常可靠的交易信号的重新粉刷指示器。 输入参数 幅度:用于寻找差异的之字形周期 振荡器-选择要加载到图表的振荡器。 突破期-交易信号的突破期,以柱为单位。 发散类型-启用或禁用发散类型:隐藏,常规或两者。 最小散度单位为条形-最
IVISTscalp5
Vadym Zhukovskyi
5 (5)
我们向您介绍iVISTscalp5指标,它不仅独特,而且在交易操作中也非常有效。该指标基于时间数据,是多年金融市场经验和深入分析的结果。iVISTscalp5指标是手动交易的优秀工具。便利性、简单性和可视化 - 所有的复杂性都隐藏在内部。我们将iVISTscalp5指标的设置和使用简化到了最大程度。该指标适用于MT5终端中您所拥有的所有金融工具。 操作时间为UTC+3的早上4点到晚上8点。 iVISTscalp5指标菜单(见截图1): History - 计算行情的周数 dT_min - 选择时间间隔的时间(分钟) TFline - 绘制水平成交量(时间帧) BARSline - 绘制水平成交量(条数) TFtrend1 - 绘制日线通道(时间帧) BARStrend1 - 绘制日线通道(条数) TFtrend2 - 绘制周线通道(时间帧) BARStrend2 - 绘制周线通道(条数) ALERT_TIMER - 设置闹钟 ALERT - 开启/关闭闹钟 Save - 开启/关闭将时间记录到文本文件。 图表上的红色和蓝色旗帜表示时间(VIST智能剃须系统的信号)。卖出信号为红旗,买入
Introducing the South African Sniper indicator created by a small group of traders with a few years trading trading the financial market profitably . This is a plug and play indicator that provides you with  BUY and SELL (SNIPER ENTRY) signals with TARGET and trail stops. The indicator Works with all MT5 trading instruments. The indicator uses previous  chart data as receipt to speculate on future market moves.  "The South African Sniper indicator community are very happy with the indicator an
"Piranha" - an autonomous trading system that determines overbought and oversold levels on the chart. Red and blue zones represent overbought and oversold levels respectively. Entry points are marked with arrows: a downward arrow in the red zone for "sell" and an upward arrow in the blue zone for "buy". The Take profit level is indicated by the green moving average. Key features: Adjusting the Take profit level as the green moving average changes position. Averaging ability when a new market e
PZ Swing Trading MT5
PZ TRADING SLU
5 (4)
Swing Trading 是第一个旨在检测趋势方向的波动和可能的反转波动的指标。它使用在交易文献中广泛描述的基准摆动交易方法。该指标研究多个价格和时间向量,以追踪总体趋势方向,并检测市场超卖或超买并准备好进行修正的情况。 [ 安装指南 | 更新指南 | 故障排除 | 常见问题 | 所有产品 ] 市场波动的利润不会被窃取 指示器始终显示趋势方向 彩色价格带代表机会基准 彩色虚线表示可能的反转波动 该指标分析其自身的质量和性能 它实现了一个多时间仪表板 可定制的趋势和波动周期 它实现了电子邮件/声音/推送警报 指示器为非重涂或重涂 什么是摇摆交易 摇摆交易是一种尝试在一天到一周内从证券中获得收益的交易方式,尽管某些交易最终可以保持更长的寿命。摇摆交易者使用技术分析来买入弱点和卖出力量,并有耐心等待这些机会的发生,因为在发生一波抛售浪潮之后购买证券而不是陷入抛售更有意义。 机会基准 关于历史数据的大量研究证明,适合于波动交易的市场倾向于在基线价格带上下交易,基线价格带由图表显示,使用平均真实区间计算得出。波动交易者使用基线,该策略是购买常态和卖出躁狂,或做空常态并掩盖沮丧。
Introducing the Power Trade Plus indicator designed by a small group of traders with a few years of experience trading the market profitably.  The Power Trade Plus is derived from the Power Trade indicator,  the indicator strive in powerful sniper entries and take profit levels,  with an algorithm that's can determine the markets volatility and Provides entries based on the current market volatility. This indicator is much more effective in stock ,currencies and indices.
PZ Day Trading MT5
PZ TRADING SLU
2.83 (6)
该指标仅使用价格行为分析和donchian渠道以锯齿形检测价格反转。它是专门为短期交易而设计的,根本不需要重新粉刷或补漆。对于精明的交易者来说,这是一个绝佳的工具,旨在增加他们的运作时间。 [ 安装指南 | 更新指南 | 故障排除 | 常见问题 | 所有产品 ] 极易交易 它在每个时间段都提供价值 实施自我分析统计 它实现了电子邮件/声音/视觉警报 基于可变长度的突破和拥挤区域,该指标仅使用价格行为来选择交易并对市场快速做出反应。 显示过去信号的潜在利润 该指标分析其自身的质量和性能 突围的损失突出显示并解决 该指标是不可重涂和不可重涂的 该指标将帮助盘中交易者不要错过单个价格反转。但是,并非所有价格反转都是一样的,也不是具有相同的可行质量。决定要突破哪些突破而忽略哪些取决于交易者的良好判断。 如何解释统计数据 该指标研究其自身信号的质量,并在图表上绘制相关信息。将分析每笔交易,并在图表的左上角显示总体历史结果,这使您可以针对任何给定的工具和时间范围自行优化指标参数。每个乐器和时间表都有其自己的最佳设置,您可以自己找到它们。 最大优惠交易:对于任何给定的交易,MFE都是
Dragon Multi Indicator MT5
Mansour Babasafary
5 (4)
3 Indicators in 1 indicator Strategy based on price action Made specifically for the best forex currency pairs Can be used in the best time frame of the market at a very reasonable price This indicator is basically 3 different indicatos . But we have combined these 3 indicators in 1 indicator so that you can use 3 indicators at the lowest price. All three strategies are based on price action. But based on different trends. Long term, medium term and short term Attributes : No repaintin
SMCpro
Arief
5 (1)
Currently Price  20% OFF  ( for unlimited use ) Indicator   USER MANUAL , trade setups, solving issues, etc :  Direct Download Here     (  for users only  ) Hello World! Introducing.. SMCpro tool and Indicator for  MetaTrader 5 , a cutting-edge feature designed to revolutionize your trading experience. With innovative ICT Smart Money Concept, you gain unparalleled insight into market dynamics, empowering you to make informed trading decisions like never before. SMC Indicator built on th
Professional Scalping Tool on Deriv Attention! The indicator will be sold in limited quantities!!! The previous 5 copies were sold for $250 The remaining 4 copies will be sold for $350 The next price is $500 Description: This trading indicator is designed for professional traders focused on scalping. Designed with the market in mind, it provides highly accurate spike trading signals. It works on the M1 timeframe and supports the following symbols: Boom 300 Index, Boom 500 Index, Boom 1000 I
PZ Harmonacci Patterns MT5
PZ TRADING SLU
3.25 (4)
可以说,这是您可以为MetaTrader平台找到的最完整的谐波价格形成自动识别指标。它检测19种不同的模式,像您一样认真对待斐波那契投影,显示潜在的反转区域(PRZ),并找到合适的止损和获利水平。 [ 安装指南 | 更新指南 | 故障排除 | 常见问题 | 所有产品 ] 它检测19种不同的谐波价格形态 它绘制了主要,衍生和互补的斐波那契投影(PRZ) 它评估过去的价格走势并显示每个过去的形态 该指标分析其自身的质量和性能 它显示合适的止损和获利水平 它使用突破来表明合适的交易 它在图表上绘制所有样式比率 它实现了电子邮件/声音/视觉警报 受斯科特·M·卡尼(Scott M. Carney)的书的启发,该指标旨在满足最纯粹和最熟练的交易者的需求。但是,它采取了一种使交易更容易的方式:在向交易发出信号之前,它会等待Donchian朝正确方向突破,从而使交易信号非常可靠。 斐波那契投影与向量无关 它实现了电子邮件/声音/推送警报 它绘制了ABCD投影 重要提示: 为了符合 Scott M. Carney先生 的商标申诉,某些图案名称已重命名为不言自明的替代方式, Scot
MetaForecast M5
Vahidreza Heidar Gholami
5 (2)
MetaForecast能够根据价格数据中的谐波来预测和可视化任何市场的未来走势。虽然市场不总是可预测的,但如果价格中存在模式,MetaForecast可以尽可能准确地预测未来。与其他类似产品相比,MetaForecast通过分析市场趋势可以生成更精确的结果。 输入参数 Past size (过去的尺寸) 指定MetaForecast用于创建生成未来预测模型的柱数量。该模型以一条黄色线绘制在所选柱上。 Future size (未来的尺寸) 指定应预测的未来柱数量。预测的未来以粉色线表示,并在其上绘制了蓝色回归线。 Degree (程度) 此输入确定了MetaForecast将在市场上进行的分析级别。 Degree 描述  0 对于程度0,建议使用较大的值来设置“过去的尺寸”输入,以覆盖价格中的所有高峰、低谷和细节。  1 (建议的) 对于程度1,MetaForecast可以理解趋势,并通过较小的“过去的尺寸”生成更好的结果。  2 对于程度2,除了趋势,MetaForecast还可以识别反转点。对于大于1的程度,必须使用较高的“细节”和“噪音减少”输入值。  大于2 不建议使用大
ON Trade Gann Squares MT5
Abdullah Alrai
5 (1)
Gann 方块指标是一种强大的市场分析工具,基于 W.D. Gann 在其“市场预测数学公式”一文中介绍的数学概念。该指标融合了与平方数(如 144、90 和 52)有关的 Gann 技术,以及平方 9。此外,它还融入了  关于如何将平方 9 与通道和星形图案结合使用的方法。 用户手册和使用方式: 在使用该指标之前,我们建议您阅读用户手册,并与我们联系以获得任何澄清。您可以在我们的网站上找到完整的用户手册。 该指标提供了 MT5 的完整版本供购买,也提供了 MT4 的免费版本供测试。提供了两个版本的链接供您方便使用。 主要特点和功能: Gann 方块指标为您的交易环境提供了全套工具,使您能够基于几何图案和 Gann 的概念做出明智的决策。以下是主要特点: 平方 9 分析:   该指标可以绘制与平方 9 有关的各种元素,包括水平线、星形图案、网格、Gann 扇形等。这在您的图表上提供了 Gann 的几何概念的视觉表示。 Gann 方块:   该指标绘制了 Gann 方块 52、90 和 144,使您能够可视化和分析它们与价格走势的关系。 自由 Gann 星形图案:   该指标使您能够直接
The Volume Spread Analysis indicator is based on the original Volume Spread Analysis method. It was designed for quick and easy recognition of VSA patterns. Even though this indicator looks very simple, it is the most sophisticated tool we've ever made. It is a really powerful analytical tool that generates very reliable trading signals. Because it is very user-friendly and understandable, it is suitable for every type of trader, regardless of his experience. What is VSA? VSA - Volume Spread
VTrende Pro
Andrii Diachenko
5 (1)
VTrende Pro - MTF indicator for trend trading with a display panel for MT5 *** Videos can be translated into any language using subtitles (video language - Russian) Although the signals of the VTrende Pro indicator can be used as signals of a full-fledged trading system, it is recommended to use them in conjunction with the Bill Williams TS. VTrende Pro is an extended version of the VTrende indicator. Difference between Pro version and VTrende: - Time zones - Signal V - signal 1-2 waves
Introduction to Fractal Pattern Scanner Fractal Indicator refers to the technical indicator that makes use of the fractal geometry found in the financial market. Fractal Pattern Scanner is the advanced Fractal Indicator that brings the latest trading technology after the extensive research and development work in the fractal geometry in the financial market. The most important feature in Fractal Pattern Scanner is the ability to measure the turning point probability as well as the trend probabil
Introduction to X3 Chart Pattern Scanner X3 Cherart Pattern Scanner is the non-repainting and non-lagging indicator detecting X3 chart patterns including Harmonic pattern, Elliott Wave pattern, X3 patterns, and Japanese Candlestick patterns. Historical patterns match with signal patterns. Hence, you can readily develop the solid trading strategy in your chart. More importantly, this superb pattern scanner can detect the optimal pattern of its kind. In addition, you can switch on and off individu
本指标是实践实战交易完善的波浪自动分析的指标   ! 黄金实战 案例... 注:波浪分级用西方叫法不习惯,因 受到缠论(缠中说禅)命名方式习惯的影响,我是将基础波浪命名为 笔 , 将二级波段命名为 段 , 同时具有趋势方向的段命名为 主趋段 (以后笔记中都是这种命名方式,先告知大家),但是算法上和缠论关系不大切勿混淆.反映的是本人分析盘面总结的 千变万化纷繁复杂的运行规律 . 对波段进行了标准化定义,不再是不同人不同的浪 ,  对人为干扰的画法进行了排除 ,  在严格分析进场起到了关键的作用 . 指标内容 1.   基础波浪(笔): 首先我们找出了价格波动过程中的基础波动拐点,当然他的有序性还不算太强,为下一步的计算提供基础 . 2.   二级波段(段) :在基础波浪的基础上,通过算法分析得到层级更明显的二级波段,二级波段为波浪提供了分析基础 3.   波浪(浪): 有着更清晰的趋势,更清晰直观的方向.分析一个波浪是否延续,需要看二级波段的形态,分析二级的构成,可以得出波浪后续的预测. 4.   通道: 通道计算采用了线性回归的方式进行计算. 5.   回撤: 波浪中的两个重要回撤
Eng Gold
Ely Alkrar Xshkaky
ENG-GOLD Scalper It is an auxiliary indicator that identifies potential targets and determines the place of entry with a stop loss that works on Heiken Ashi candles  The green lines are usually the targets, the red lines are the stop loss, and the yellow lines are the entry location.  This file is recognized on small and medium frames, usually less than the watch frame I highly recommend using XAUUSD US100 US30 USOIL 
Good day! I present to you a trading technical indicator for Deriv broker synthetic indices. This indicator ONLY works with the following indices: Boom 300 Index Boom 500 Index Boom 1000 Index Crash 300 Index Crash 500 Index Crash 1000 Index The indicator was created to give signals to open medium-term trades in the direction of Spikes. But you can open trades in the opposite direction to Spikes, at your own risk. Trade only on M1. Other TFs do not guarantee the correct operation of the indic
RAD Real Acummulation and Distribution
Jose Alejandro Jacome Jimenez
RAD CRITICAL LEVES RAD indicator tracks “Relevant Volume” in real time, identifying accumulation and distribution processes, projecting them in the chart as SUPPORT or RESISTANCE zones. Natural   support   and resistance levels are generated by Volume Accumulation and Distribution processes. As these processes evolve, levels at which the relevant volume in the market place is positioned, become difficult areas to cross upwards or downwards. By using this information, traders can identify very s
Weis Wave with Alert MT5
Trade The Volume Waves Single Member P.C.
4.93 (15)
Rental/Lifetime Package Options and Privileges  * For optimum results the yearly or lifetime package is suggested due to live training ! Rent Monthly Six Months   Yearly/Lifetime Weis Wave with Speed with Alert+Speed Index x x x Manual  x x x Quick Set up Video x x x Blog x x x Lifetime Updates x x x Setup and Training Material x x Free Rectangle Break Alert Tool      x Discord Access Channel "The SI traders" x 2-hour live methodology training x How to trade with it:    http://
作者的更多信息
Trend Screener
STE S.S.COMPANY
4.83 (88)
趋势指标,趋势交易和过滤的突破性独特解决方案,所有重要趋势功能都内置在一个工具中! 它是 100% 非重绘多时间框架和多货币指标,可用于所有符号/工具:外汇、商品、加密货币、指数、股票。 趋势筛选器是有效的指标趋势跟踪指标,它在图表中提供带有点的箭头趋势信号。 趋势分析器指标中可用的功能: 1.趋势扫描仪。 2. 具有最大利润分析的趋势线。 3.趋势货币强度计。 4. 带有警报的趋势反转点。 5. 带有警报的强趋势点。 6. 趋势箭头 每日分析示例,每日信号表现...等与我们的趋势筛选指标,可以在这里找到: 点击这里 限时优惠:Trend Screener Indicator 仅售 50 美元且终身可用。原价 125$) 通过访问我们的 MQL5 博客,您可以找到我们所有的高级指标以及分析示例、每日信号表现...等。 : 点击这里 我们的趋势系统由 2 个指标组成: 1. Trend Screener Indicator:显示趋势仪表盘、图表中的趋势线、入场点...等。 2. Trend Line Map Indicator:显示买卖作为仪表板,活动信号盈利/亏损
PR Support And Resistance for MT4
STE S.S.COMPANY
4.57 (102)
当市场的价格走势逆转并改变方向时,我们的支撑位或阻力位就形成了,在市场上留下了一个高峰或低谷(摆动点)。支撑位和阻力位可以划出交易区间。该指标根据指标集中定义的 X 根柱线数 (Period) 识别摆动高点和摆动低点。 注意:如果您喜欢我们的价格行为指标,请尝试我们的多合一趋势指标(趋势筛选器、趋势线、强趋势和趋势反转信号等)。 要获取它, 请单击此处 主要特点 技术分析的一个关键概念是,当阻力位或支撑位被突破时,它的作用就会逆转。如果价格跌破支撑位,该位将成为阻力位。如果价格升至阻力位以上,则通常会成为支撑位。 水平支撑和阻力水平是这些水平中最基本的类型。它们只是由一条水平线标识: 图表中的绿色水平,是阻力水平。 图表中的红色水平,是支撑水平。 我们的支撑位和阻力位用于确定价格趋势更有可能停止并可能改变方向的关键水平。它可以是特定的价格或价格区域。对水平重要性程度的解释取决于交易者的时间框架。 文件(说明) 所有 PR 支撑和阻力指标、文档(说明)均可在我们 MQL5 博客的这篇文章中找到: 单击此处。 优势 处理所有货币对(外汇、加密货币、指数和商
FREE
Trend Line Map Pro MT5
STE S.S.COMPANY
4.67 (9)
趋势线图指标是趋势筛选器指标的插件。它用作趋势筛选器(趋势线信号)生成的所有信号的扫描仪。 它是基于趋势筛选器指标的趋势线扫描仪。如果您没有 Trend Screener Pro Indicator,Trend Line Map Pro 将无法使用。 It's a Trend Line Scanner based on Trend Screener Indicator. If you don't have Trend Screener Pro Indicator,     the Trend Line Map Pro will not work . 通过访问我们的 MQL5 博客,您可以下载趋势线图指标的免费版本。购买前试用,不受 Metatrader Tester 限制。 :  点击这里 1. 容易获得的优势 根据货币和时间范围显示买入和卖出信号。 评估自图表中出现箭头以来价格上涨或下跌的点数。 (趋势筛选指标箭头) 显示信号的时序。 获取多时间范围和多货币警报以购买和出售警报。 2. 如何使用趋势线图 如何显示买卖信号仪表板? 如果您有任何问题或需
Trend Line Map Pro
STE S.S.COMPANY
4.73 (15)
趋势线图指标是趋势筛选器指标的插件。它用作趋势筛选器(趋势线信号)生成的所有信号的扫描仪。 它是基于趋势筛选器指标的趋势线扫描仪。如果您没有 Trend Screener Pro Indicator ,Trend Line Map Pro 将无法使用。 通过访问我们的 MQL5 博客,您可以下载趋势线图指标的免费版本。购买前试用,不受 Metatrader Tester 限制。 :    点击这里 1. 容易获得的优势 根据货币和时间范围显示买入和卖出信号。 评估自图表中出现箭头以来价格上涨或下跌的点数。 (趋势筛选指标箭头) 显示信号的时序。 获取多时间范围和多货币警报以购买和出售警报。 2. 如何使用趋势线图 如何显示买卖信号仪表板? 如果您有任何问题或需要帮助,请通过私信联系我。 作者 SAYADI ACHREF,金融科技软件工程师,Finansya 创始人。
Trend Currency Strength
STE S.S.COMPANY
5 (2)
货币强度计,为您提供当前哪些货币强,哪些货币弱的快速视觉指南。 该仪表测量所有外汇交叉货币对的强度,并对它们进行计算以确定每种货币的整体强度。 我们根据 28 对的趋势计算货币的强度。 .货币强度计是指标的通用名称,用于显示您是在处理强货币还是弱货币。这种基于算法的指标依赖于各种货币对的汇率来提供每种货币的强弱程度。 通过访问我们的 MQL5 博客,您可以下载该指标的免费版本。 购买前试用,不受 Metatrader Tester 限制: 单击此处 1. 文档 所有趋势货币强度文档(说明)和策略详细信息均可在我们 MQL5 博客的这篇文章中找到: 单击此处。 2. 联系方式 如果您有任何问题或需要帮助,请通过私信联系我。 3. 作者 SAYADI ACHREF,金融科技软件工程师,Finansya 创始人。
Todo comerciante sabe que él o ella nunca deben arriesgar más del 5% (o 7%) por operación. Esta es una ley de administración de dinero y se debe calcular un tamaño de lote utilizable cada vez porque un comerciante debe usar un valor StopLoss diferente para diferentes niveles de negociación. Este indicador calculará un tamaño de lote apropiado para el momento en que lo colocará en el gráfico y cada vez arrastrará la "Línea de stop loss" en cualquier dirección. OFERTA POR TIEMPO LIMITADO: Todos
我们的指标将提供一个价差筛选器来同时监控多对的价差,并且蜡烛计时器倒计时显示当前柱关闭和新柱形成之前的剩余时间。 限时优惠:我们所有的溢价指标仅售 50 美元,通过访问我们的 MQL5 博客,您将找到我们溢价指标的所有详细信息。   点击这里。 主要特征 我们的指标将提供一个价差筛选器来同时监控多对的价差,并且蜡烛计时器倒计时显示当前柱关闭和新柱形成之前的剩余时间。 监控多对同时传播。 跟踪服务器时间,而不是本地时间。 可配置的文本颜色和字体大小 优化以减少 CPU 使用率 个性化的配对列表。 接触 如果您有任何问题或需要帮助,请通过私信联系我。 警告 警告 我们所有的指标和工具只能通过官方 Metatrader 商店 (MQL5 市场) 获得。 作者 SAYADI ACHREF,金融科技软件工程师和 Finansya 创始人
FREE
支撑和阻力筛选器是 MetaTrader 的一个级别指标,它在一个指标内提供多种工具。 可用的工具有: 1. 市场结构筛选器。 2. 看涨回调区。 3. 看跌回调区。 4.每日枢轴点 5.每周枢轴点 6. 每月枢轴点 7. 基于谐波形态和成交量的强大支撑和阻力。 8. 银行级区域。 限时优惠:HV 支撑和阻力指示器仅售 50 美元且终生可用。 (原价 125$) 通过访问我们的 MQL5 博客,您可以找到我们所有带有分析示例的高级指标: 单击此处 主要特点 基于谐波和音量算法的强大支撑和阻力区域。 基于谐波和成交量算法的看涨和看跌回调区域。 市场结构筛选器 每日、每周和每月的枢轴点。 文档 所有支持和阻力筛选器文档(说明)和策略详细信息均可在我们 MQL5 博客的这篇文章中找到: 单击此处。 接触 如果您有任何问题或需要帮助,请通过私信联系我。 作者 SAYADI ACHREF,金融科技软件工程师,Finansya 创始人。
Trend Monitor for MT4
STE S.S.COMPANY
4.51 (65)
自定义 MT5 (Metatrader 5) 指标,用于分析趋势和波动率分析器指标。此外,它确定了适用于大多数货币对和时间框架的趋势的开始和结束。 总之,我们根据超级趋势公式对其进行了编码,以通过添加波动率分析器来更加准确。 您是否正在寻找良好且可靠的支撑和阻力指标,请尝试我们的多合一水平指标(回调区、强支撑/阻力区、市场结构筛选器等。要获得 , 点击这里。 主要特点 确定趋势的开始和结束。 轻松识别趋势的强度(最大增加和最大减少) 确定市场修正。 ( 弱趋势 ) 在 Potentiel 趋势开始时获得警报。 优势 使用所有货币对(外汇、加密货币、指数和商品) 处理所有时间范围。 (推荐时间范围:H1 和 H4 时间范围) 警报生成器。 (弹出警报,推送通知警报...等) 文件(说明) 所有趋势监视器指标、文档(说明)均可在我们 MQL5 博客的这篇文章中找到: 单击此处。 警告 我们所有的指标都只能通过官方 Metatrader 商店(MQL5 市场)获得。 通过访问我们的 MQL5 配置文件,您将找到我们所有的指标和 EA(免费和付费)。 要访问我们
FREE
Support Resistance screnner
STE S.S.COMPANY
4.86 (36)
支撑和阻力筛选器是 MetaTrader 的一个级别指标,它在一个指标内提供多种工具。 可用的工具有: 1. 市场结构筛选器。 2. 看涨回调区。 3. 看跌回调区。 4.每日枢轴点 5.每周枢轴点 6. 每月枢轴点 7. 基于谐波形态和成交量的强大支撑和阻力。 8. 银行级区域。 限时优惠:HV 支撑和阻力指示器仅售 50 美元且终生可用。 (原价 125$) 您想尝试不受 Metatrader Backtester 限制的指标吗? 单击此处下载演示版本。 主要特点 基于谐波和音量算法的强大支撑和阻力区域。 基于谐波和成交量算法的看涨和看跌回调区域。 市场结构筛选器 每日、每周和每月的枢轴点。 文档 所有支持和阻力筛选器文档(说明)和策略详细信息均可在我们 MQL5 博客的这篇文章中找到: 单击此处。 接触 如果您有任何问题或需要帮助,请通过私信联系我。 作者 SAYADI ACHREF,金融科技软件工程师,Finansya 创始人。
Pin Bar Detector 是一种在图表上发现 Pin Bar 价格行为模式的指标。 Pin Bars 是“Pinocchio Bars”的快捷方式,它是一种经典的条形图案,可替代具有高上或下影线以及非常小的实体(如 Dragon Fly Doji、Grave Stone Doji、Hammer、Inverted-Hammer、Hanging Man 和 Shooting Star)的日本烛台. 限时优惠:该指标仅适用于 50 美元和终身。 (原价 125 美元) 主要特征 看涨 Pin Bar 检测器。 看跌 Pin Bar 检测器。 100% 免费指标。 使用所有时间范围。 与所有对一起工作。 接触 如果您有任何问题或需要帮助,请通过私信与我联系。 警告 我们所有的指标和工具都只能通过官方 Metatrader 商店 (MQL5 市场) 获得。 溢价指标 通过访问我们的 MQL5 配置文件,您可以找到我们所有的免费和高级指标。要访问我们的个人资料, 请单击此处。 作者 SAYADI ACHREF,金融科技软件工程师,Finansya Lab
FREE
货币强度计,为您提供当前哪些货币强,哪些货币弱的快速视觉指南。 该仪表测量所有外汇交叉货币对的强度,并对它们进行计算以确定每种货币的整体强度。 我们根据 28 对的趋势计算货币的强度。 .货币强度计是指标的通用名称,用于显示您是在处理强货币还是弱货币。这种基于算法的指标依赖于各种货币对的汇率来提供每种货币的强弱程度。 通过访问我们的 MQL5 博客,您可以下载该指标的免费版本。 购买前试用,不受 Metatrader Tester 限制: 单击此处 1. 文档 所有趋势货币强度文档(说明)和策略详细信息均可在我们 MQL5 博客的这篇文章中找到: 单击此处。 2. 联系方式 如果您有任何问题或需要帮助,请通过私信联系我。 3. 作者 SAYADI ACHREF,金融科技软件工程师,Finansya 创始人。
Pin Bar Detector 是一种在图表上发现 Pin Bar 价格行为模式的指标。 Pin Bars 是“Pinocchio Bars”的快捷方式,它是一种经典的条形图案,可替代具有高上或下影线以及非常小的实体(如 Dragon Fly Doji、Grave Stone Doji、Hammer、Inverted-Hammer、Hanging Man 和 Shooting Star)的日本烛台. 限时优惠:该指标仅适用于 50 美元和终身。 (原价 125 美元) 主要特征 看涨 Pin Bar 检测器。 看跌 Pin Bar 检测器。 100% 免费指标。 使用所有时间范围。 与所有对一起工作。 接触 如果您有任何问题或需要帮助,请通过私信与我联系。 警告 我们所有的指标和工具都只能通过官方 Metatrader 商店 (MQL5 市场) 获得。 溢价指标 通过访问我们的 MQL5 配置文件,您可以找到我们所有的免费和高级指标。要访问我们的个人资料, 请单击此处。 作者 SAYADI ACHREF,金融科技软件工程师,Finansya Lab
FREE
我们的指标将提供一个价差筛选器来同时监控多对的价差,并且蜡烛计时器倒计时显示当前柱关闭和新柱形成之前的剩余时间。 限时优惠:我们所有的溢价指标仅售 50 美元,通过访问我们的 MQL5 博客,您将找到我们溢价指标的所有详细信息。 点击这里。 主要特征 我们的指标将提供一个价差筛选器来同时监控多对的价差,并且蜡烛计时器倒计时显示当前柱关闭和新柱形成之前的剩余时间。 监控多对同时传播。 跟踪服务器时间,而不是本地时间。 可配置的文本颜色和字体大小 优化以减少 CPU 使用率 个性化的配对列表。 接触 如果您有任何问题或需要帮助,请通过私信联系我。 警告 警告 我们所有的指标和工具只能通过官方 Metatrader 商店 (MQL5 市场) 获得。 作者 SAYADI ACHREF,金融科技软件工程师和 Finansya 创始人
FREE
Boom and Crash Spike Detector 指标是根据主要用于检测价格中的 Boom 和 Crash 的高级策略进行编码的。 植入了复杂的算法来检测价格中高概率的繁荣和崩溃。 它会在潜在的繁荣或崩溃阶段发出警报: 繁荣阶段:当价格上涨过快时。 崩溃阶段:当价格下跌过快时。 限时优惠:该指标仅适用于 30美元和终身。 主要特征 向手机发送推送通知 在计算机或笔记本电脑上弹出并发出警报 显示非重绘箭头(向上箭头表示潜在繁荣,向下箭头表示潜在崩溃) 与所有对一起工作。 推荐 时间范围:H1 和 H4 推荐货币对:处于趋势阶段的货币对。 接触 如果您有任何问题或需要帮助,请通过私信联系我。 作者 SAYADI ACHREF,金融科技软件工程师和 Finansya 创始人。
波动率分析仪是一种动量指标,它利用价格在狭窄交易区间盘整后强劲突破的趋势。该指标还使用动量振荡器来显示挤压触发时的预期移动方向。该直方图在零线附近震荡,零线上方的动量增加表明有机会买入多头,而动量低于零线则表明有做空机会。 限时优惠:该指标仅适用于 50 美元和终身。 (原价 125 美元) 主要特征 横向趋势检测器。 低挥发性检测器。 看涨高位和看跌高波动率检测器。 使用所有时间框架和所有货币对。 提供弹出警报和推送通知警报。 接触 如果您有任何问题或需要帮助,请通过私信与我联系。 警告 我们所有的指标和工具都只能通过官方 Metatrader 商店 (MQL5 市场) 获得。 溢价指标 通过访问我们的 MQL5 配置文件,您可以找到我们所有的免费和高级指标。要访问我们的个人资料, 请单击此处。 作者 SAYADI ACHREF,金融科技软件工程师,Finansya Lab 创始人。
Todo comerciante sabe que él o ella nunca deben arriesgar más del 5% (o 7%) por operación. Esta es una ley de administración de dinero y se debe calcular un tamaño de lote utilizable cada vez porque un comerciante debe usar un valor StopLoss diferente para diferentes niveles de negociación. Este indicador calculará un tamaño de lote apropiado para el momento en que lo colocará en el gráfico y cada vez arrastrará la "Línea de stop loss" en cualquier dirección. OFERTA POR TIEMPO LIMITADO: Todos
平均每日范围显示了在一定时期内测量的外汇对的平均点范围。 交易者可以使用 ADR 来可视化平均每日变动之外的潜在价格行为。 当 ADR 高于平均水平时,意味着每日波动率高于平时,这意味着货币对可能超出其正常范围。 我们的 ADR 分析仪由 5 个主要功能组成: Range (ADR) Screener:一种多币种 ADR 分析。 ADR 区域:显示 ADR 区域外价格上涨的日内预期市场范围。 X bar Zone : 显示用户指定的 X 根柱线的突破。 每日高点和低点区:识别前一天高点或低点的突破。 每周高点和低点区:确定一周的突破日高位或低位。 限时优惠:范围分析仪指示器仅适用于 50 美元和终身。 (原价 125 美元) 主要特征 多币种筛选器。 ADR 区域突破 所有类型的警报(弹出、推送通知等) 支持所有货币。 文件资料 所有带有警报文档(说明)和策略详细信息的范围分析器都可以在我们的 MQL5 博客的这篇文章中找到: 点击这里。 接触 如果您有任何问题或需要帮助,请通过私信联系我。 警告 我们所有的指标都只能通过官方 Metatrader
Boom and Crash Spike Detector 指标是根据主要用于检测价格中的 Boom 和 Crash 的高级策略进行编码的。 植入了复杂的算法来检测价格中高概率的繁荣和崩溃。 它会在潜在的繁荣或崩溃阶段发出警报: 繁荣阶段:当价格上涨过快时。 崩溃阶段:当价格下跌过快时。 限时优惠:该指标仅适用于 30 美元和终身。 主要特征 向手机发送推送通知 在计算机或笔记本电脑上弹出并发出警报 显示非重绘箭头(向上箭头表示潜在繁荣,向下箭头表示潜在崩溃) 与所有对一起工作。 推荐 时间范围:H1 和 H4 推荐货币对:处于趋势阶段的货币对。 接触 如果您有任何问题或需要帮助,请通过私信联系我。 作者 SAYADI ACHREF,金融科技软件工程师和 Finansya 创始人。
平均每日范围显示了在一定时期内测量的外汇对的平均点范围。 交易者可以使用 ADR 来可视化平均每日变动之外的潜在价格行为。 当 ADR 高于平均水平时,意味着每日波动率高于平时,这意味着货币对可能超出其正常范围。 我们的 ADR 分析仪由 5 个主要功能组成: Range (ADR) Screener:一种多币种 ADR 分析。 ADR 区域:显示 ADR 区域外价格上涨的日内预期市场范围。 X bar Zone : 显示用户指定的 X 根柱线的突破。 每日高点和低点区:识别前一天高点或低点的突破。 每周高点和低点区:确定一周的突破日高位或低位。 限时优惠:范围分析仪指示器仅适用于 50 美元和终身。 (原价 125 美元) 主要特征 多币种筛选器。 ADR 区域突破 所有类型的警报(弹出、推送通知等) 支持所有货币。 文件资料 所有带有警报文档(说明)和策略详细信息的范围分析器都可以在我们的 MQL5 博客的这篇文章中找到: 点击这里。 接触 如果您有任何问题或需要帮助,请通过私信联系我。 警告 我们所有的指标都只能通过官方 Metatrader
波动率分析仪是一种动量指标,它利用价格在狭窄交易区间盘整后强劲突破的趋势。该指标还使用动量振荡器来显示挤压触发时的预期移动方向。该直方图在零线附近震荡,零线上方的动量增加表明有机会买入多头,而动量低于零线则表明有做空机会。 限时优惠:该指标仅适用于 50 美元和终身。 (原价 125 美元) 主要特征 横向趋势检测器。 低挥发性检测器。 看涨高位和看跌高波动率检测器。 使用所有时间框架和所有货币对。 提供弹出警报和推送通知警报。 接触 如果您有任何问题或需要帮助,请通过私信与我联系。 警告 我们所有的指标和工具都只能通过官方 Metatrader 商店 (MQL5 市场) 获得。 溢价指标 通过访问我们的 MQL5 配置文件,您可以找到我们所有的免费和高级指标。要访问我们的个人资料, 请单击此处。 作者 SAYADI ACHREF,金融科技软件工程师,Finansya Lab 创始人。
筛选:
1805059
25
1805059 2024.06.04 18:46 
 

Bought this product last week, so far extremely satisfied. I'm still looking for my ideal strategy. I use the weak signals for the trend reversal, and the green/red dots in combination with the RSI/stoch. these give me very useful signals. thanks again

Zim
112
Zim 2024.06.04 00:29 
 

Using this indicator made me feel more comfortable evaluating the market trend situation for trading. I also needed help with a question and Achraf was friendly and punctual in helping me.

cocolo0307
62
cocolo0307 2024.05.15 17:56 
 

I have purchased this indicator 2 days ago. It's a wonderful!! This indicator make me trade easy, simple and extremely helpful to gain profit! I can say this indicator and Sayadi revolutionized my trading method. Just one question here. Is it possible to show popup alert of all pairs and timeframe in one window? For example, I want popup alert about all timeframe of JPYUSD to appear into EURUSD's window.

mdonofrio
26
mdonofrio 2024.05.01 12:15 
 

How to activate the TREND SCANNER? I can see only 1 line at time... on the top of the graph for the Forex pair.

STE S.S.COMPANY
286391
来自开发人员的回复 Sayadi Achraf 2024.05.01 13:04
Dear sir, Thank you for taking tome to write your review. I'm sending you now a private message to explain to you how to activate all the pairs from the trend scanner. +++++++++++++ Update: Can you check your private message sir ? I send a screen-shot how to enable all pairs in the scanner.
svalley
20
svalley 2024.04.19 07:47 
 

Thank you for this wonderful indicator. Excellent support from Sayadi and the best indicator in the market.

STE S.S.COMPANY
286391
来自开发人员的回复 Sayadi Achraf 2024.04.19 17:55
Thank you for taking the time to write your review, sir. We are so happy to know that you're satisfied with our trend indicator, our customer satisfaction is our top priority. We have a major update coming soon for Trend Screener to make it a multi-screeners indicator with more features! We have been engaged since 2020 to keep improving our indicator by offering the best support for our customers. Please if you have any comments or suggestions to improve our indicator, feel free to contact us anytime. I invite you to check all the list of all our free and premium indicators here : https://www.mql5.com/en/users/sayadi_lancer/seller
slacktrader
50
slacktrader 2024.04.15 02:04 
 

Satisfied with my first purchase... Its helping me to monitor all pairs trend from one chart.

STE S.S.COMPANY
286391
来自开发人员的回复 Sayadi Achraf 2024.04.15 02:31
Thank you for taking time to write your review. I'm happy to know that you find our indicator a useful indicator for you. Since 4 years, we are doing our best to keep improving and giving the best trend indicator for our customers. Please if you have any suggestions or comments about our indicator, feel free to contact us. I invite you to check all the list of all our free and premium indicators here : https://www.mql5.com/en/users/sayadi_lancer/seller
mm0079
127
mm0079 2024.04.12 12:14 
 

I did not find any edge with the screener that I, once again, was hoping for so in the end not worth it unfortunately. Furthermore it is very slow somehow. But not that bad as the screener add-on which is way slower.

STE S.S.COMPANY
286391
来自开发人员的回复 Sayadi Achraf 2024.04.12 13:44
Hi sir, Thank you for taking time to write your review. Please don’t worry about the indicator speed. I’m contacting you asap to check this issue with you and i will assist via zoom meeting to ensure that the indicator is working smoothly in your MetaTrader. I’m here to offer you all the necessary support. Best regards. Sayadi Ashref.
AMZreact
201
AMZreact 2024.04.09 11:33 
 

The indicator offers clear signals and a user-friendly interface, making it very effective for identifying trend exits and take-profit levels across most timeframes and symbols via its highly useful panel.

STE S.S.COMPANY
286391
来自开发人员的回复 Sayadi Achraf 2024.04.12 00:50
Thank you for taking the time to write your review sir. My customers satisfaction is always my top priority. Since 2020, we are trying to offer the best trend analytics tools for our customers. Please have a good and safe trades. The main purpose behind our trend indicator is to offer an all-In-One trend analytics indicator.
boga1
201
boga1 2024.03.29 17:38 
 

Whether you are a day trader or swing trader, this is the only indicator you need. It has it all to become a good trader.

STE S.S.COMPANY
286391
来自开发人员的回复 Sayadi Achraf 2024.03.30 14:11
Thank you for taking the time to write your review, sir. We are doing our best to keep improving our indicator and with the best support to ensure that our customers are satisfied at 100% with their purchase. We have many new features for the trend screener coming soon!
1001035938
54
1001035938 2024.03.20 16:47 
 

Muito Bom indicador !Estou usando a 5 meses muito bom resultado !

STE S.S.COMPANY
286391
来自开发人员的回复 Sayadi Achraf 2024.03.30 14:12
Thank you for taking the time to write your review, sir. We are so happy to know that, our customer satisfaction is our top priority. Most important please have a good and safe trading. Any questions, feel free to contact us. We are here to offer you all the necessary support.
Kiran satya
404
Kiran satya 2024.03.19 12:27 
 

Had a wonderful conversation and understood the strengths of the Indicator. Its really a nice tool IF USED CORRECTLY. one should back test it thoroughly before hitting the market. Sayadi also offered me another indicator. Thank You very much for your time.

STE S.S.COMPANY
286391
来自开发人员的回复 Sayadi Achraf 2024.03.20 10:37
Thank you for taking the time to write your review MR. Kiran. My customers satisfaction is always my top priority. Since 2020, we are try to offer the best trend analytics tools for our customers with assisting them via zoom meeting and one-to-one meeting with the best way to use our indicator and answer all their questions. Please have a good and safe trading.
sayt90
19
sayt90 2024.02.06 12:49 
 

I have purchased this wonderful indicator and I fully agree with the reviews. The indicator is amazing. The precision , accuracy is exceptional and it has many features to analyze the trend, i like a lot the idea of the csm with the scanner. Thank you for the great product!

STE S.S.COMPANY
286391
来自开发人员的回复 Sayadi Achraf 2024.02.06 14:29
Thank you so much sir , for your honest review and your kind words!
You dont know how happy i am really you made my day! I wish you more success in your trading!
The Trend Screener is the best All-In-One Trend Indicator ! I am really glad that i help and that I could bring some positivity in you trading in general!
thank you so much again brother!
$heik @hmed
156
$heik @hmed 2023.12.28 20:17 
 

So far pretty used for beginners. Looking forward for more in the future.

STE S.S.COMPANY
286391
来自开发人员的回复 Sayadi Achraf 2023.12.29 16:43
Thank you for taking the time to write your review. I'm pleased to hear that you appreciated our indicator and found it beneficial for analyzing market trends. We designed this indicator to cater to both beginners and professional traders, aiming to provide accurate trend analysis.
Dang Minh Tien
557
Dang Minh Tien 2023.11.25 02:04 
 

Updated: Immediately responded to my request and gave me the option I needed (hiding unused timeframes). I've started using it again; it works wonderfully. We need a better UI design and the option to move the indicator panel around freely and this will be perfect.

It's nice, but the design needs improvement. We also need a lot more flexibility in configuration, such as removing those columns that users are not using based on their needs. I don't need to see Spreads, M1-M5-M15, or Fuzzy logic... keeping them there makes no sense to me, and it only blocks my view of the chart. I stopped using it, but this indicator would be much better with just that little change.

STE S.S.COMPANY
286391
来自开发人员的回复 Sayadi Achraf 2023.11.25 14:33
Thank you for taking the time to write your review Mr. Tien and I'm happy to know that you find our indicator a nice indicator. In relation to the requested change to the layout of the Scanner, can you please upgrade to version 20. We have added all the suggestions you provided us. By upgrading to version 20, you will find options to remove Spread columns, timeframes, and more. Our customers satisfaction is always our top priority. Please have a good and safe trading, sir.
51337036
90
51337036 2023.11.01 19:58 
 

Excellent indicator to help with my trading strategy. And great customer service. Keep up the great work! Thank you

STE S.S.COMPANY
286391
来自开发人员的回复 Sayadi Achraf 2023.11.02 09:32
Thank you for the honest words and for the sense on integrity and openness and sharing your personal review means a lot to all of us and any trader who is aiming for better trading results! I am happy that i helped and I always say I am committed to help all the time and make more enhancements and share knowledge for free! thank you again!
HOGJoerch63
284
HOGJoerch63 2023.10.12 19:26 
 

It is a great tool with many opportunities without getting trapped. I bought it yesterday and still testing it. But so far it is great. Many Thanks Thumbs up

[删除] 2023.09.19 11:44 
 

用户没有留下任何评级信息

energybitcoin
89
energybitcoin 2023.09.12 14:44 
 

This indicator is very good, perhaps the best purchase I've ever made here at mql5, but it would be much better as a robot. It would be a success in my opinion. If the price wasn't exaggerated, I would think about buying it.

Krzysztof Piotr Gawronski
443
Krzysztof Piotr Gawronski 2023.09.09 15:58 
 

This is one of the best indicators I have seen in my life! Multitimeframe trend analysis for selected currency pairs, with a clear trend summary information; currency strength information, plus a trend simulator so you can verify and set your expectations right in terms of TP that is proven by historical signals and success rate statistics, etc. I am using both MT5 and MT4 versions of the indicator as the main signal source for all my trades with a very high success rate for a few weeks now. From one single chart I have clear visibility to the current market conditions. On the top of this Sayadi is very helpful any time you have questions on how best to use the indicator. I strongly recommend this product!

Jocolpro
70
Jocolpro 2023.09.06 12:35 
 

A wonderful indicator, once you understand how it works. Very responsive and professionnel customer service specialy Mr. Sayadi Akhraf. I greatly appreciate it.

回复评论
版本 21.10 2024.06.03
1. Improve arrow signals.
2. Add Trend line period.
版本 20.20 2024.01.22
1. Updating the indicator to work with the last indicator version.
版本 20.10 2023.11.29
1. Improve Scanner load spead.
版本 20.0 2023.11.25
1. Change the Trend Scanner Layout by giving more flexibility in configuration to hide and display every column.
2. Add inputs to change timeframes for every column.
3. Optimize Trend breakout alerts and trend reversal alerts.
4. Add a period for the scanner to be adjusted for faster or slower trend calculation.
5. Change trend lines layout.
6. Optimize indicator setting.
版本 19.21 2023.05.29
1. Fixing spelling mistakes.
版本 19.20 2023.05.26
1. Optimize indicator speed.
2. Improve Trend C.S.M Algorithm.
3. Improve Strong Dots Algorithm.
4. Improve Reversal Dots Algorithm.
版本 19.10 2022.03.17
1. Shifting Stoploss and Takeprofit Label.
版本 19.0 2021.08.30
1. Add new alert types.
版本 18.0 2021.08.27
1. Add Strong Trend Signals.
2. Add Reversal Trend Signals.
3. Optimizing Trend Algorithm.
4. Add Scalper TP simulator.
版本 17.0 2021.07.08
1. Optimizing indicator speed.
版本 16.30 2021.06.07
Updates :
1. Improving Trend Dashboard algorithm.
2. Improving Speed of Trend Dashboard loading.
3. Remove the button of the Success Rate Simulator and change it to be hidden and displayed via input setting.

Fixed :

1. Fixing the issue of disconnection from broker or internet and automatically restart calculation.
2. Increase the size of the Sym columns to display bigger pairs.
3. Fixing refresh screener data without the need to change the chart.
4. Forcing Screener to delete and reload the default template after removing the screener.
5. Fixing the issue Trend line breaks and draws a vertical line with the last MT5 version.

版本 16.10 2021.05.09
1. Increase indicator speed.
2. Fixing prefix/suffix issue.
3. fixing ZigZag Issue.
版本 16.0 2020.10.07
1. Fixing alert issue with the last MT5 version.
2. Add backtesting feature/demo testing in the market.
3. Optimizing the speed of Success rate simulator,Stoploss calculation and ATR takes profit calculator.
版本 15.51 2020.08.22
1. Setting optimization.
版本 13.10 2020.06.29
1. Adjusting the default setting.
版本 13.0 2020.06.15
1. Optimizing indicator performance to use lower computer performance.
2. Add Buffers to support iCustom
版本 12.0 2020.06.07
Updates :

1. Add new Alert time ( GMT Or BROKER SERVER TIME or Local Computer time ).
2. Add Parameter to define Frequency of the Screener updating. ( Seconds )
3. Add Pairs manager: Display Screener based on Current Chart OR Display Screener based on Custom pairs List.
4. Hide - display button for the Success Rate Simulator.

Fixed issue :
1. Correcting button names.
版本 9.91 2020.04.27
1. Changing the default setting.
版本 9.90 2020.04.27
1. Add a Spread feature.
2. Optimization Speed calculation.
3. Adjusting indicator structure to work faster.