Multi Time Frame Multi Currency Signals Dashboard
- 指标
- Shiffolika Kapila
- 版本: 1.0
- 激活: 10
Multi-Time-Frame-Multi Currency Signals Dashboard Indicator
It is an Advanced multi-utility dashboard which works with full customization of signal settings and graphical interface.
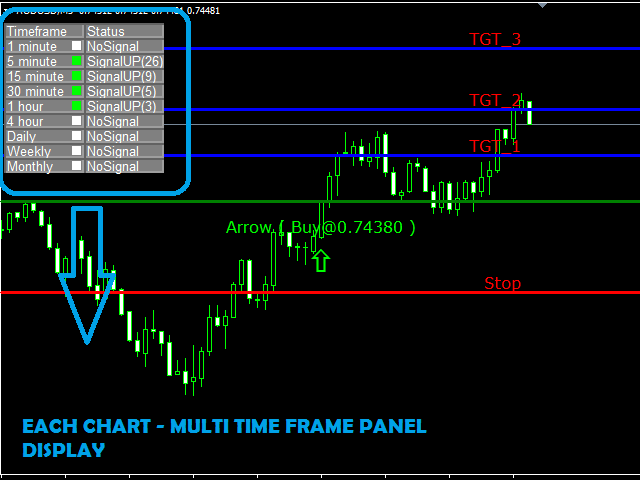
It works with Multi Symbols and Multi-Time frames from 1 SINGLE CHART TEMPLATE.
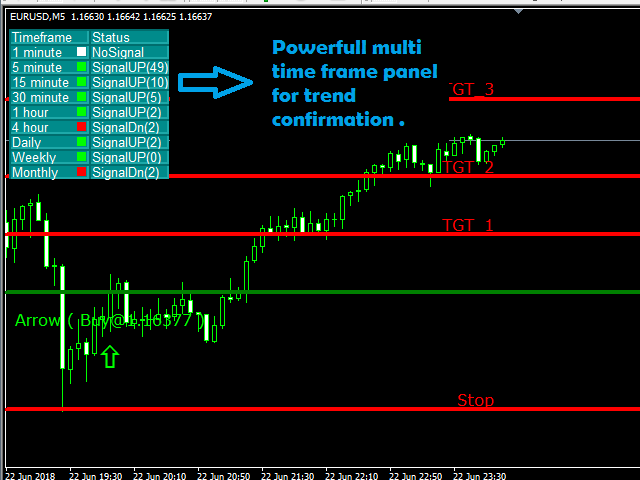
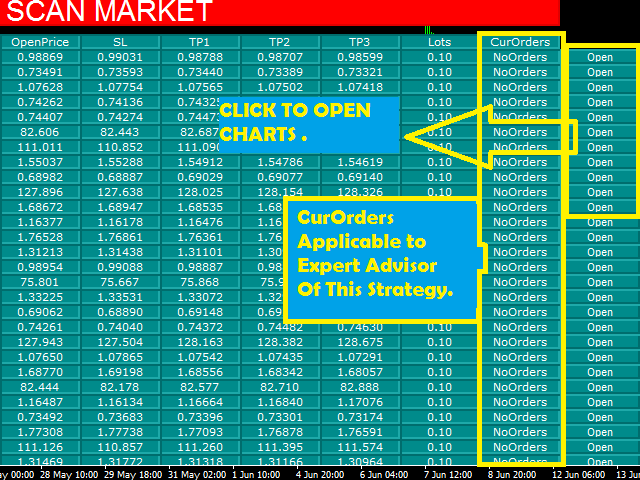
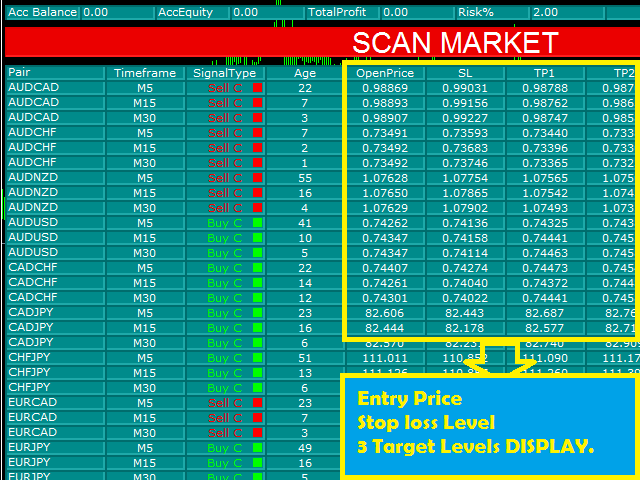
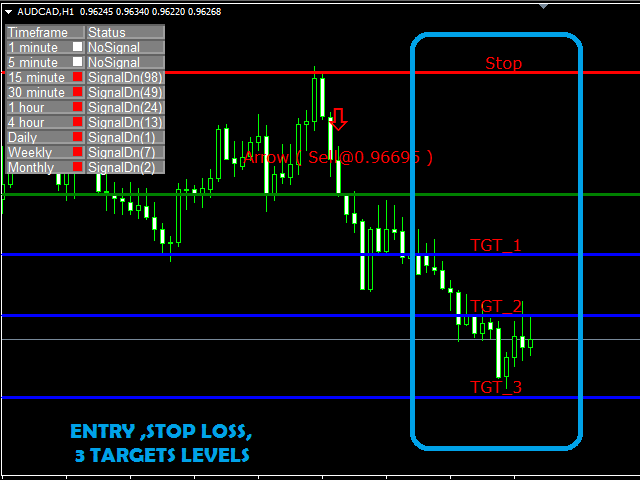
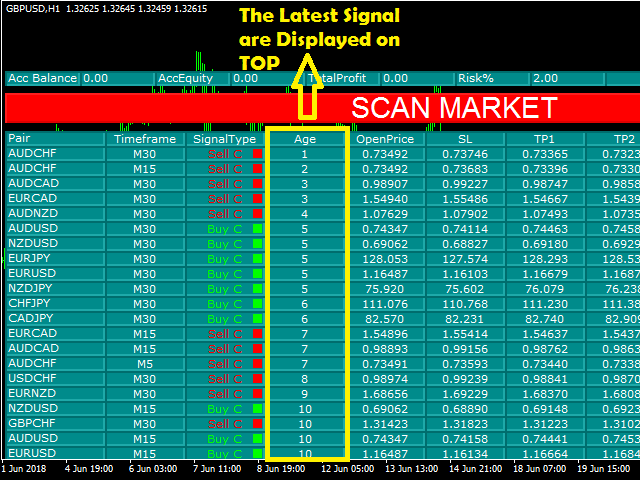
It will automatically open the charts where the latest signals had formed- showing the important levels (Entry, Targets, Stop Loss)
Many types of sorting methods for the scanner.
A robust ENTRY based on TREND OF MULTI-TIME FRAMES ( Complex Signals Algorithm)
Take the trades as per the trend, all levels provided - Entry, 3 targets, stop loss (all customizable).
High risk to reward ratio settings.
Note:
The dashboard column "CurOrders" will show "NoOrders" as it will work using the EA.
The EA for trading with this dashboard is also available.
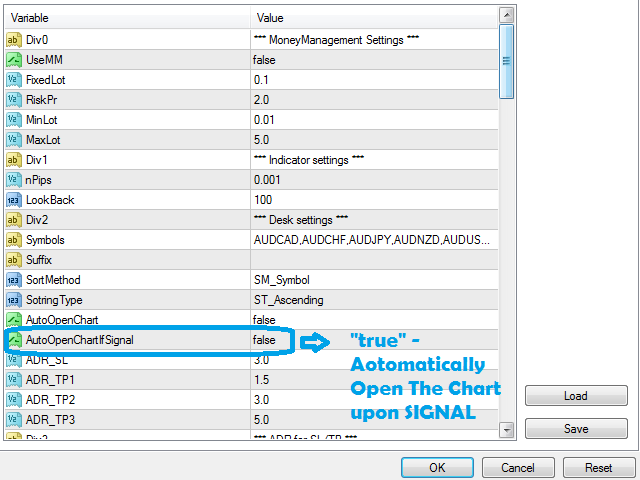
Inputs
These apply to the EA of this strategy
UseMM = false;
FixedLot = 0.1;
RiskPr = 2;
MinLot = 0.01;
MaxLot = 5;
Indicator settings
nPips = 0.008 - adjust sensitivity (lower values provide more signals and higher values provide less signals)
LookBack = 100 - number of bars, on which indicator parameter will work
Desk settings (input symbols comma separated for applying the indicator to any symbol)
Symbols -
"AUDCAD,AUDCHF,AUDJPY,AUDNZD,AUDUSD,CADCHF,CADJPY,CHFJPY,EURAUD,EURCAD,USDJPY,NZDUSD,EURCHF,EURGBP,EURJPY,EURNZD,EURUSD,GBPAUD,GBPCAD,GBPCHF,GBPJPY,GBPUSD,USDCHF,NZDJPY,USDCAD,CJN6,SILVER";
Suffix - apply on suffix appended symbols.
SortMethod - Sorting methods of the scanner output display.
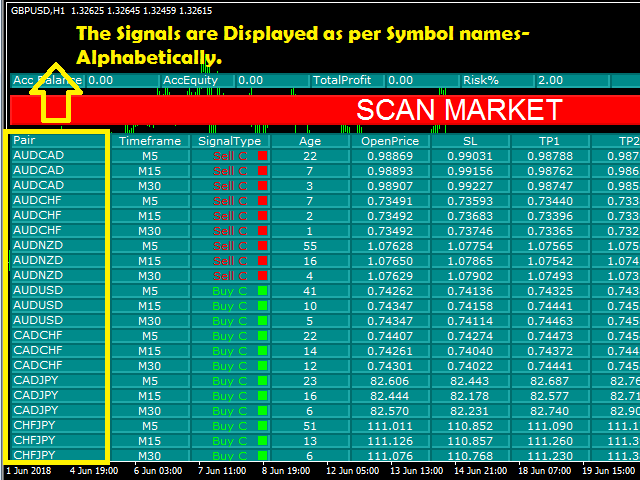
SM_Symbol - sort by symbol names.
SM_Age - Sorting most recent signal on top.
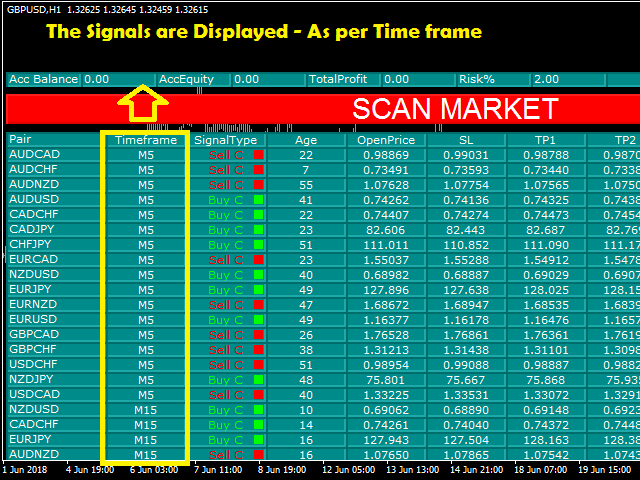
SM_Timeframe - sort as per the smallest time frame on top.
SotringType
ST_Ascending - sorting in alphabetical order/smallest TF to largest.
ST_Descending - opposite to above.
AutoOpenChart = false - applies to the EA of this strategy.
AutoOpenChartIfSignal = false - AUTO opens chart with arrow signal.
ADR_SL = 3 - stop loss.
ADR_TP1 = 1.5 - Target 1.
ADR_TP2 = 3 - Target 2.
ADR_TP3 = 5 - Target 3.
ADR for SL/TP - ADR for calculating SL/TP
ADRTimeFrame = current - default.
ADRPeriod = 50 - bars for range. (M1 TO 1 MTH )
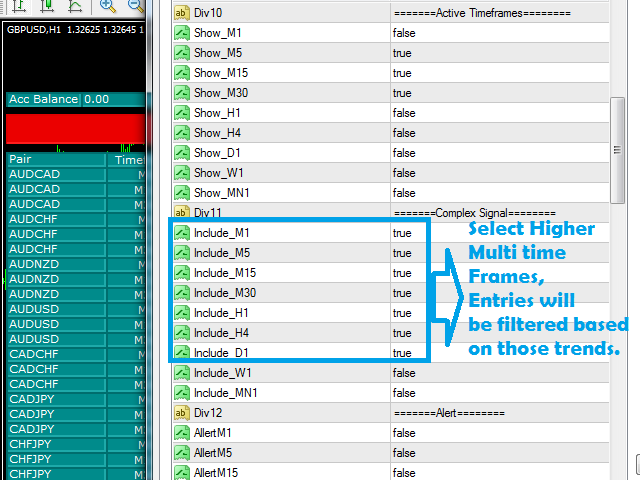
Active Timeframes (display on the dashboard)
Show_M1 to M30 = true;
Show_H1 to Mn1 = false;
Complex Signal (Entry Confirmation)- M1 TO 1 MONTH
Alert (pop up alerts)
AllertM1 to H1 = false;
AllertH4 to Mn1 = true;
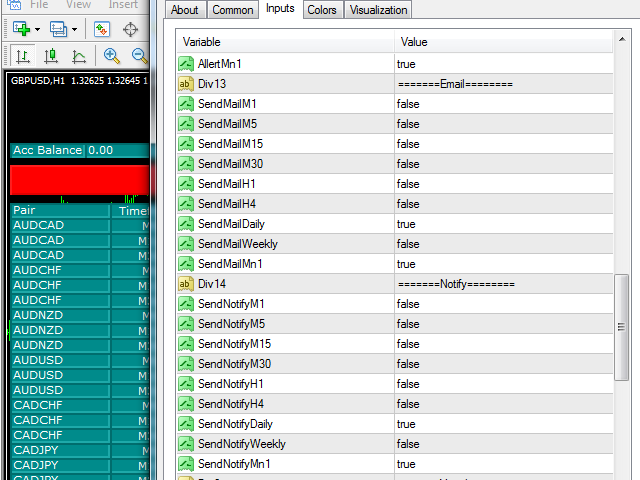
Email (email sending)
SendMailM1 to H4 = false;
SendMailDaily = true;
SendMailWeekly = false;
SendMailMn1 = true;
Email (notifications settings)
SendNotifyM1 to H4 = false;
SendNotifyDaily = true;
SendNotifyWeekly = false;
SendNotifyMn1 = true;
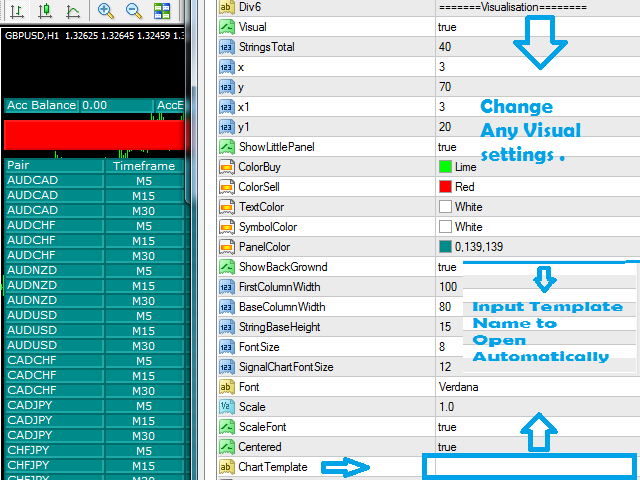
Visualization
Visual = true - Enable dashboard display.
StringsTotal = 40 - rows of the dashboard.
x = 3;
y = 70;
x1 = 3;
y1 = 20;
ShowLittlePanel = true - chart display of TREND panel.
ColorBuy = Lime - text color.
ColorSell = Red - text color.
TextColor = White - text color.
SymbolColor = White - color of symbol names text.
PanelColor = 0,139,139- dashboard main color.
ShowBackGrownd = true;
FirstColumnWidth = 100 - width of column.
BaseColumnWidth = 80 - width of other columns.
StringBaseHeight = 15 - height of all rows.
FontSize = 8 - font size of dashboard text.
SignalChartFontSize = 12 - font of Signal Text(buy/sell).
Font = "Verdana" - font of dashboard text.
Scale = 1;
ScaleFont = true;
Centered= true - rows and column alignments.
ChartTemplate - this template will load automatically.
Line color of Levels - Entry/Targets/Stop Loss
OpenPriceLineColor = Green;
SLLineColor = Red;
TP1LineColor = Red;
TP2LineColor = Red;
TP3LineColor = Red;
LinesStyle = Dot (default);
Solid
Dash
Dot
Dashdot
Dashdotdot
LinesWidth = 4- set line thicknes.
ArrowColorBuy = Green - signal color.
ArrowColorSell = Red - signal color.
NoSignalColor = White;
ShowArrowOnNewChart = true - to display the arrow signal on chart open.
NewArrowSize = 4 - size of arrow.
ScanMarketButtonClr = Red - scan button color.
ScanMarketButtonFont = 22 - font size.
ScanMarketButtonFontClr = White - color.
MagicNumber = 123456 - for the EA of this strategy.
FileName="File1"- This is a log file for recording all the TRADES generated ( Location Mql4==>Files)

One of the best dashboards I have ever bought.