ZigZagProbability
- 指标
- Stanislav Korotky
- 版本: 1.2
- 更新: 23 十一月 2021
- 激活: 5
This indicator predicts next ZigZag move based on historical ZigZag edges probabilities. It processes available history for calculating density distribution of ZigZag edges and conditional probability of their consecutive pairs. Then it uses the probabilities for estimating levels where future extremums (reversal points) may appear.
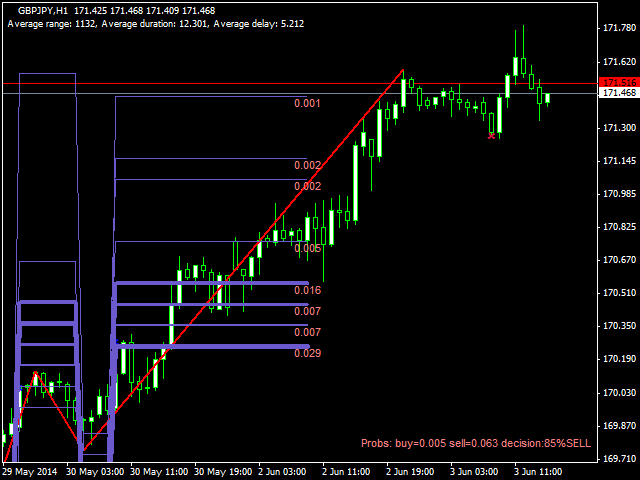
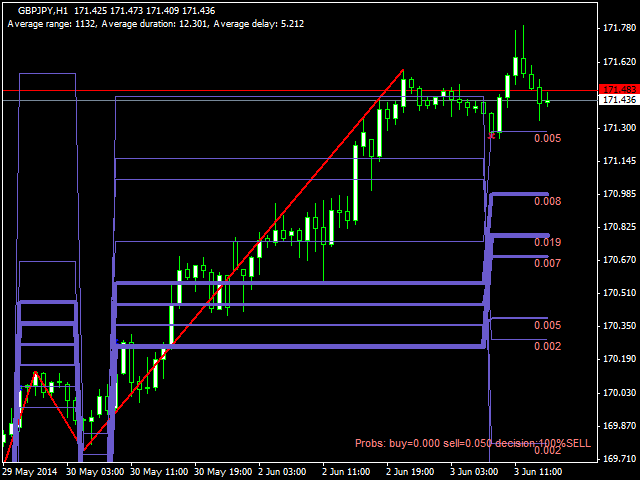
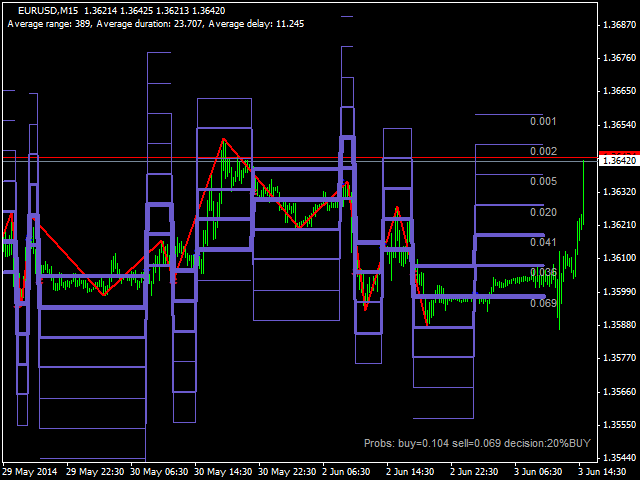
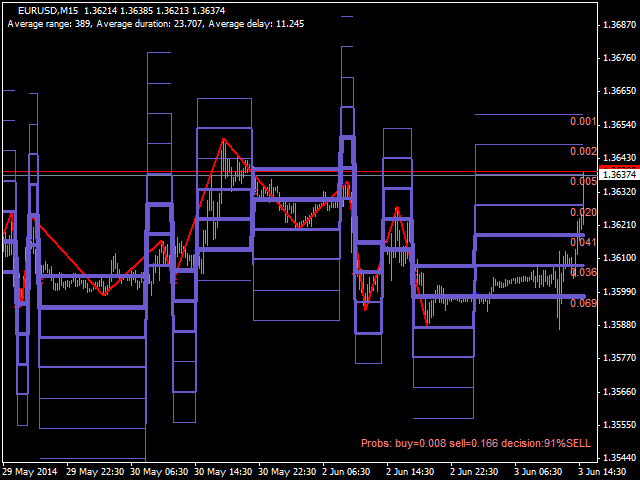
The indicator displays up to 8 horizontal lines on price levels where future ZigZag extremum will most probably occur. Please notice that the lines transitions happen on bars where ZigZag algorithm changes its direction, which normally occur long before the moment when a new segment is completed. The levels are shown using different width: the wider the level - the higher its probability. For the last bar the indicator does also show labels with exact probability values for every level. In addition, the indicator displays on the chart (in a specified corner) an overall decision about buy or sell condition, which is calculated as a ratio of all probabilities in the levels above and below current price. When the probability estimation is over 50%, the label is shown in blue (for buy) or red (for sell) colors. Otherwise the label is gray.
You may either trade by market orders using the decision provided, or place pending limit orders on the levels.
Parameters:
- HistoryDepth - number of bars to use to gather statistics; default value - 5 000;
- ZigZagRange - zigzag range (in points) parameter passed to the HZZM indicator; default value - 0 (autodetect daily range on the fly);
- RangeStep - step in points for calculating statistics; default value - 100 (5-digits); should be at least 10 times less than ZigZagRange;
- Corner - a corner used to display the label with decision; default value - 3 (bottom right); other possible values: 0 - upper left corner; 1 - upper right corner; 2 - bottom left corner;
- Offset - number of bars to shift processing to the left; this allows analyzing indicator performance on the history; default value - 0 - shows prediction on the latest bar;
- Color - color for the levels;
- Original - parameter passed "as is" to the HZZM indicator; it switches zigzag mode from standard HZZ to modified HZZM algorithm; please, consult with HZZM description for details; default value - false;
The screenshots below demonstrate examples of how the indicator works in progress on GBPJPY H1 and EURUSD M15. ZigZag edges are shown for reference only - this is HZZM indicator. On the 1st image of GBPJPY, Offset is 40, that is 40th bar is treated as last known bar (it is the bar where levels end up). On the 2nd image, Offset is 30 and, as the price crossed more levels up, the probability for sell enlarged from 5% (on the 1st image) to 85%. On the 3rd image, Offset is 0, where zigzag has already changed its direction from moving up to moving down and all levels have been transferred to new positions - below current price, which is why sell probability is 100%. You may consider placing buy limit orders on one or more levels or just sell.
On the next two EURUSD screenshots, probability changes from 20% buy, when price was low (below levels), to 91% sell after price climbed up during the same zigzag segment.
