True SSRC nrp
- 指标
- Sergey Efimenko
- 版本: 1.1
- 更新: 24 十月 2020
- 激活: 10
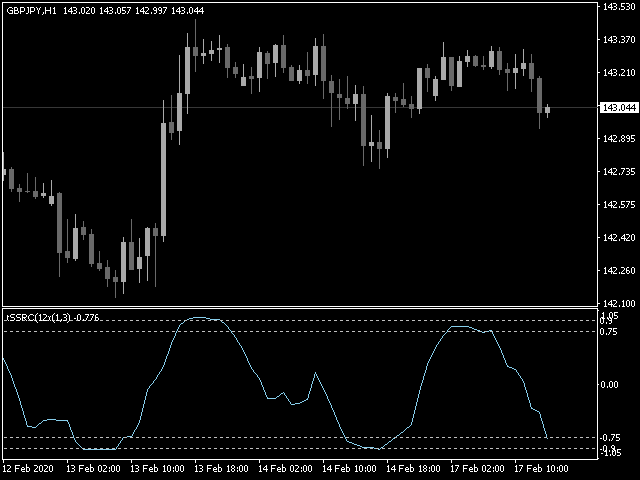
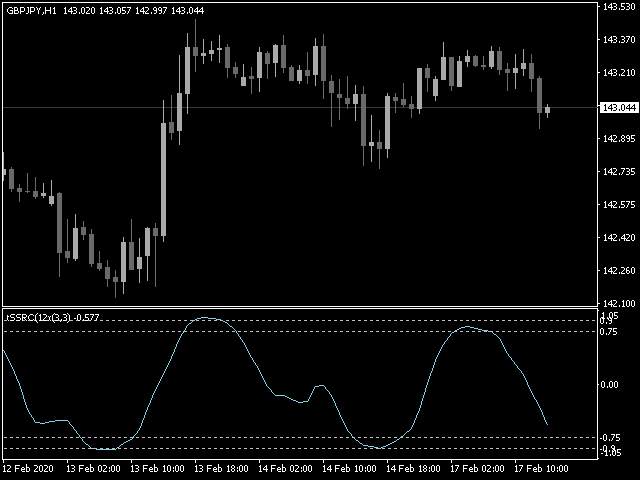
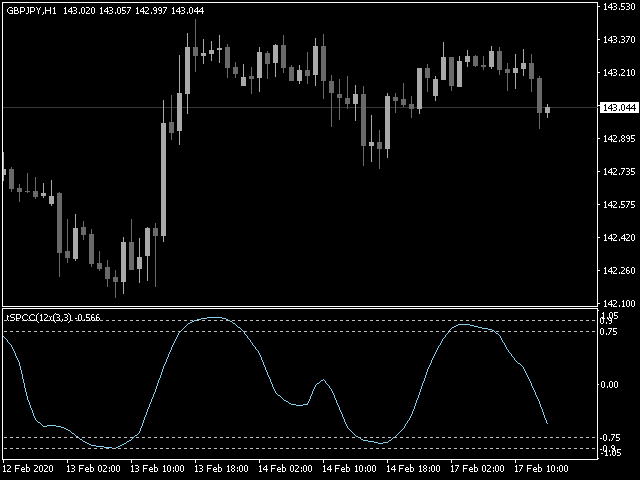
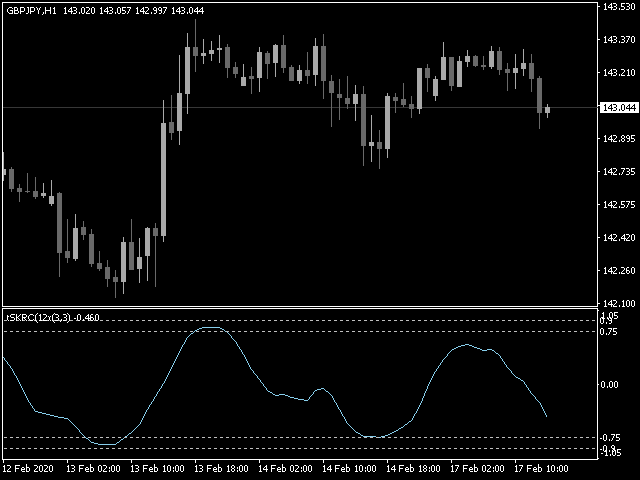
指标(振荡器)显示(可选):Spearman的秩相关系数,Pearson的线性相关系数,Kendall的秩相关系数和Fechner的符号相关系数。 当价格超出超买和超卖水平时,该振荡器显示了可能的市场反转点。
有四种方法可以对获得的值进行额外的滤波:简单的、指数的、平滑的、线性加权的。
酒吧关闭后,值是固定的,而不是重新绘制的历史。
使用 Spearman 计算时,我们得到已知的 SSRC,但在该指标中计算的是真实系数,并对计算结果应用平滑,从而避免重新绘制值。
参数:
- Calculation mode/period/price - 模式/期间/用于计算相关系数的价格
- Smoothing period/method - 周期/平滑结果值的方法


Just bought 5 stars another amazing product from Author, am interested to buy your mt5 also but Author can you please see comment page and add the arrow on chart so that easier to see, once you added please let me know so can purchase your mt5 also, Thank you.