ForexSession
- 指标
- Jia Jia Chen
- 版本: 1.5
- 更新: 30 十一月 2022
- 激活: 10
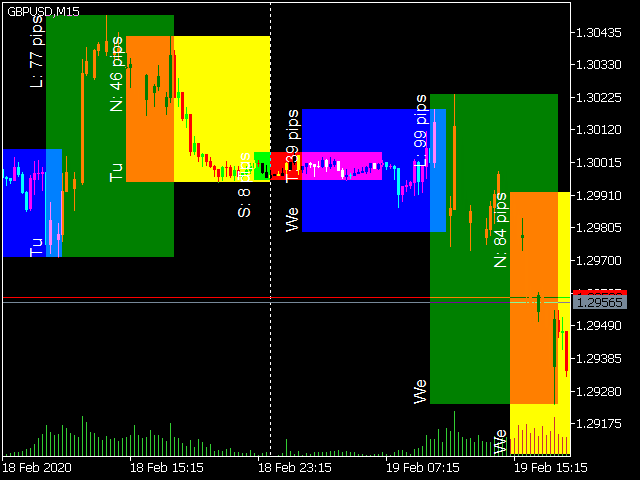
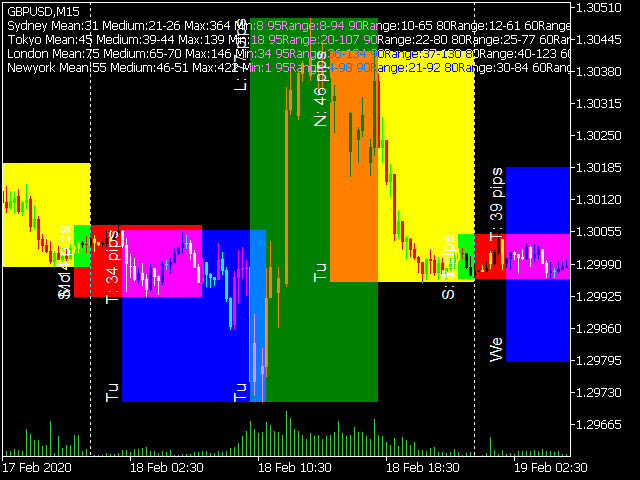
外汇市场时间指标,包含 悉尼,东京,伦敦,纽约 4个市场时间 考虑了服务器夏令时切换,以及各市场的夏令时切换
- input ENUM_DST_ZONE InpServerDSTChangeRule = DST_ZONE_US; //服务器端夏令时切换规则 按照纽约还是欧洲
- input int InpBackDays=100; // 最多绘制天数,出于性能考虑
- input bool InpShowTextLabel=true; // 显示文本标签 哪个市场,当前波动点数
- input color InpTextColor=clrWhite; // 标签文本颜色
- input int InpTextFontSize=8; //标签文本字号
- input bool InpFillBack=false; //方框背景色是否填充
- input bool InpShowStat=false; // 显示各市场时间波动统计信息
- input ENUM_LINE_STYLE InpLineStyle=STYLE_DOT; // 方框线样式
- input bool InpShowWeekday=true; //市场时间是星期几
- input bool InpShowSydneySession=true; //显示悉尼市场时间
- input bool InpShowTokyoSession=true; //显示东京市场时间
- input bool InpShowLondonSession=true; // 显示伦敦市场时间
- input bool InpShowNewyorkSesion=true; // 显示纽约市场时间
- input int InpSydneyOpen=8; //悉尼市场本地开始时间
- input int InpSydneyClose=16; //悉尼市场本地结束时间
- input int InpTokyoOpen=9;//东京市场本地开始时间
- input int InpTokyoClose=18;//东京市场本地结束时间
- input int InpLondonOpen=8;//伦敦市场本地开始时间
- input int InpLondonClose=16;//伦敦市场本地结束时间
- input int InpNewyorkOpen=8;//纽约市场本地开始时间
- input int InpNewyorkClose=17;//纽约市场本地结束时间
- input string InpMagicStr="forex_session"; //绘制对象前缀