Dynamoc SR Trend Channel
- 指标
- JEREMIAH AREKHANDIA
- 版本: 1.0
- 激活: 20
DYNAMIC
SR TREND CHANNEL
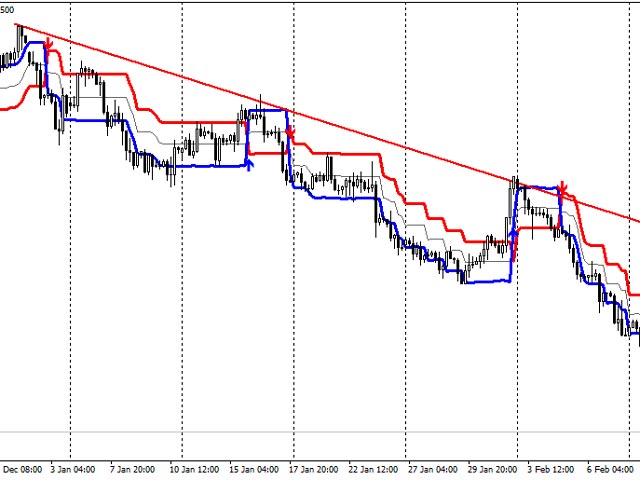
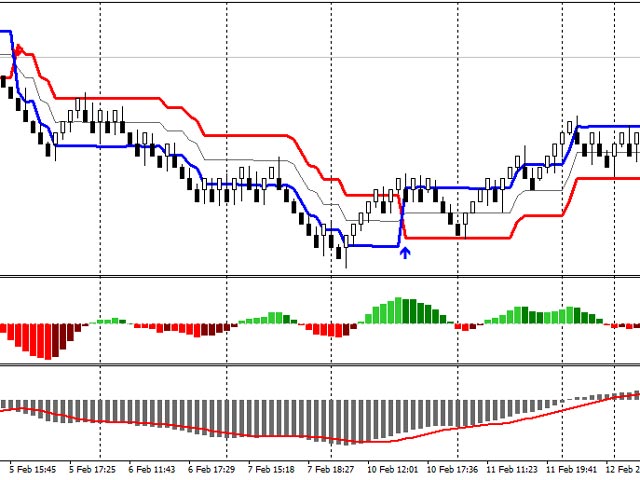
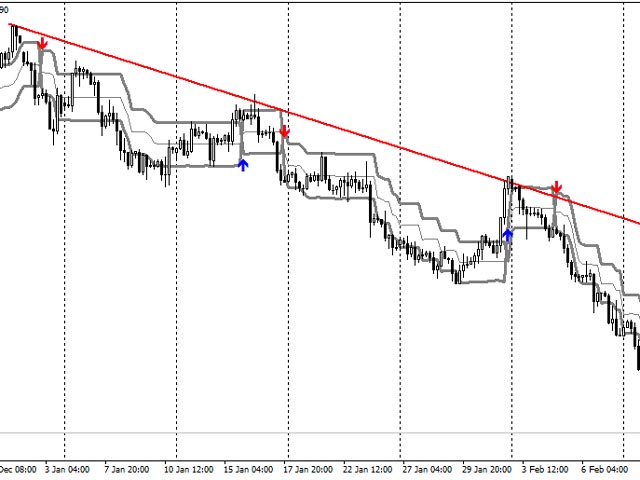
Dynamic SR Trend Channel is a simple indicator for trend detection as well as resistance/support levels on the current timeframe. It shows you areas where to expect possible change in trend direction and trend continuation. It works with any trading system (both price action and other trading system that use indicators) and is also very good for renko charting system as well.
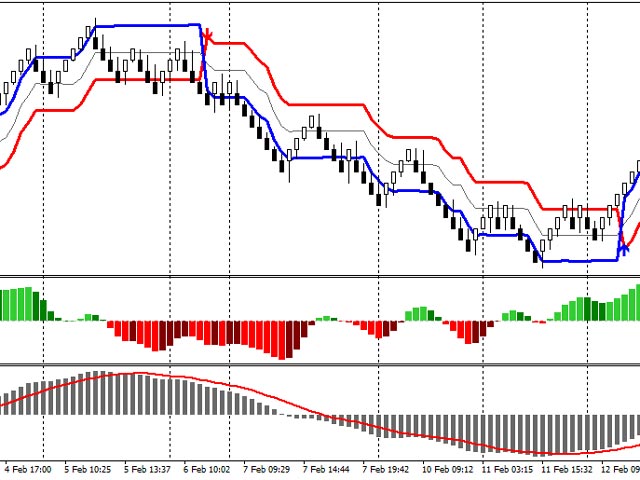
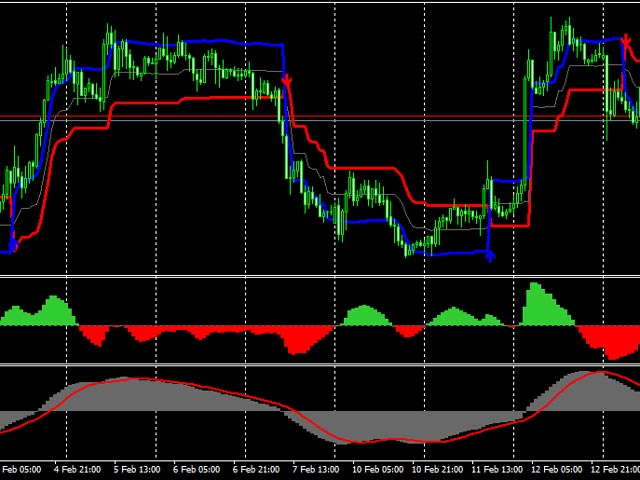
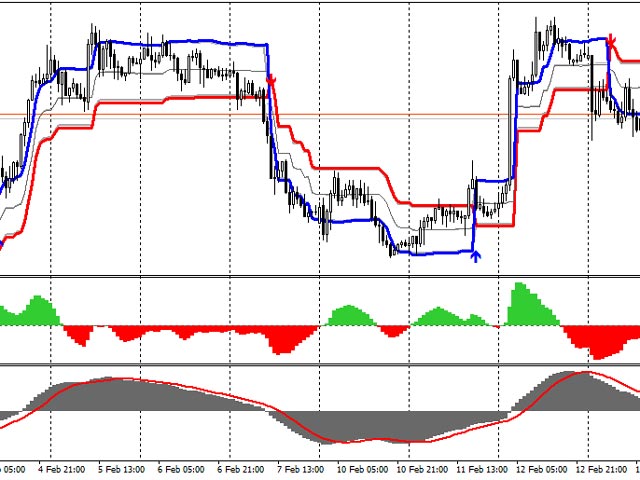
In an uptrend, the red line (main line) serves as the support and the blue line serves as the resistance while for down trend red line (main line) serves as resistance and the blue line serves as the support.
If candles continuously close above or around the blue line in the uptrend it shows that the uptrend is strong while if candles continuously close below or around the blue line in a down trend it also shows a strong down trend.
The arrows alert for change in trend direction and if the trend looks very strong, buy immediately otherwise wait for a retracement to the middle line (thin gray line) or the main line (red line).
The indicator works on all currency pairs and instruments and on all timeframes as well.
Parameters:
- Look back – for adjusting the main(red) line
- Deviation – for adjusting the distance of the middle and outer (blue) line from the main line
- Single Color – to use the same color for all three lines
- Single Channel color – to select the single color for all three lines
- Audible Alerts - to enable/ disable audible mt4 notifications
- Enable email – to enable/ disable email alerts
- Push notifications – to enable/ disable push notification to the mt4 mobile terminal
- Bars to calculate – to set the number of bars to draw the indicator. Note that if the number of bars are less than this number, the indicator won’t draw. Also note that very high values slow down your terminal.