Mini Charts MT5
- 指标
- Sergey Efimenko
- 版本: 1.4
- 更新: 19 一月 2024
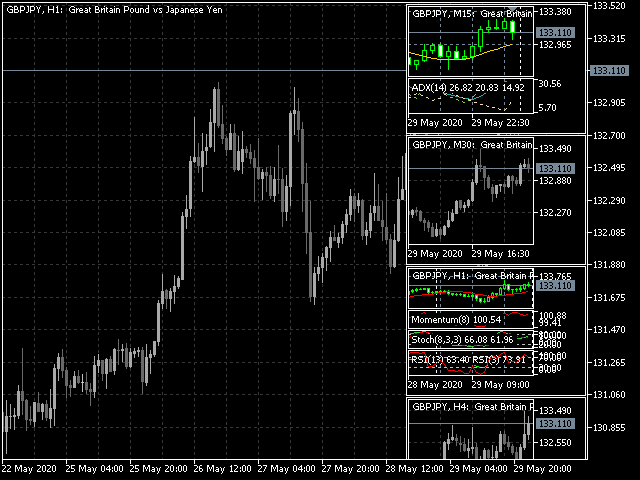
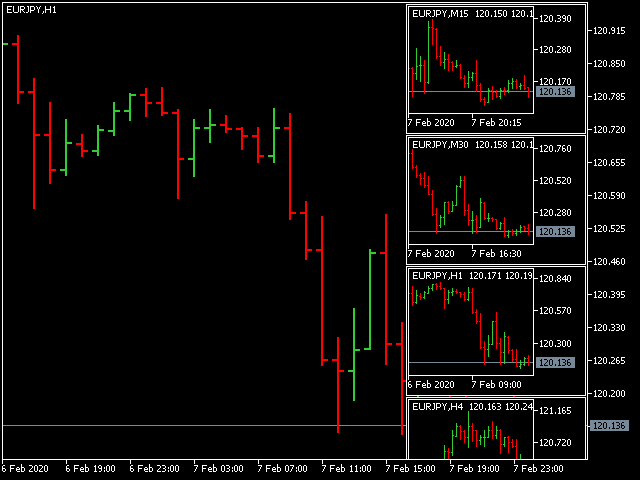
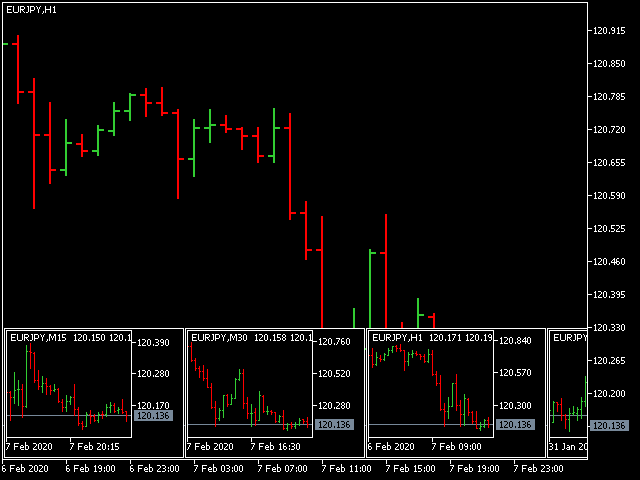
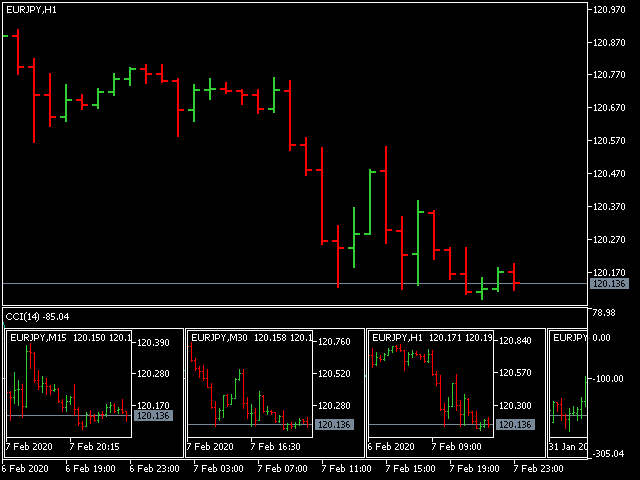
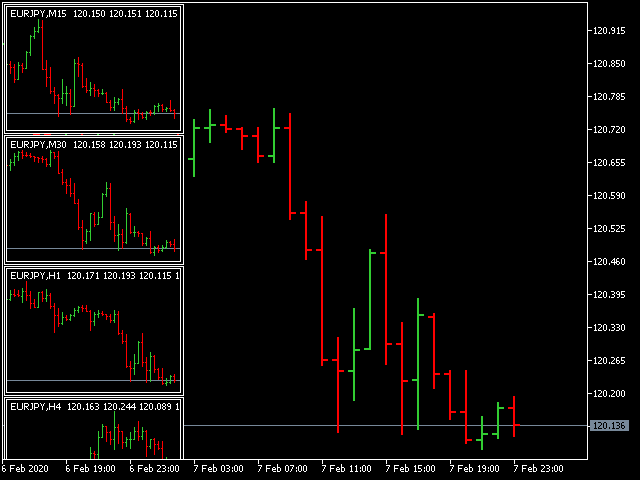
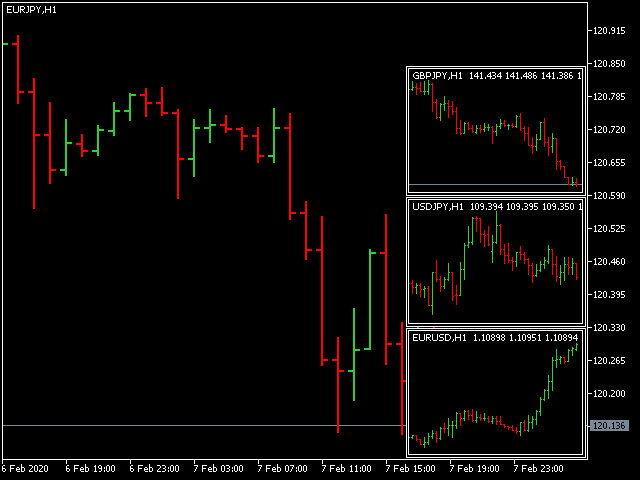
该指标显示任何时间范围内任何品种的最小化图表。显示的最大图表数为 28。图表可以位于主窗口和底部窗口中。两种显示模式:蜡烛图和条形图。显示的数据量(条形图和蜡烛图)和图表大小是可调的。
要使用迷你聊天,您必须首先将所需的指标放在常规图表上,然后将其保存为模板并通过适当的参数为迷你图表应用模板,例如,对于第一个图表,参数称为“模板名称 1”。
- Charts base corner - 基角
- Charts subwindow number - 子窗口编号
- Charts X/Y shift - 起始 X/Y 偏移
- Charts width/height - 窗口宽度/高度
- Space X/Y between charts - 图表之间的 X/Y 距离
- Charts scale - 比例
- Show date/price scale - 显示时间/价格比例
- Charts in background mode - 后台模式
- Columns count - 列数


Amazing!!!