• 概述
  • 评论 (12)
  • 评论 (9)
  • 新特性

RSImaxmin

4.5

The indicator shows when there are overprice and divergences on the RSI.

In addition, it has configurable alerts, dynamic overprice levels and a special “RSI cleaner” function.

The indicator that automatically calculates the premium rates!

RSImaxmin is an indicator based on the Relative Strength Index (RSI) oscillator that effectively identifies changes in price trends as it reflects the relative strength of bullish movements compared to bearish movements. It is widely used by traders to measure the strength of a trend and identify end-of-trend signals.

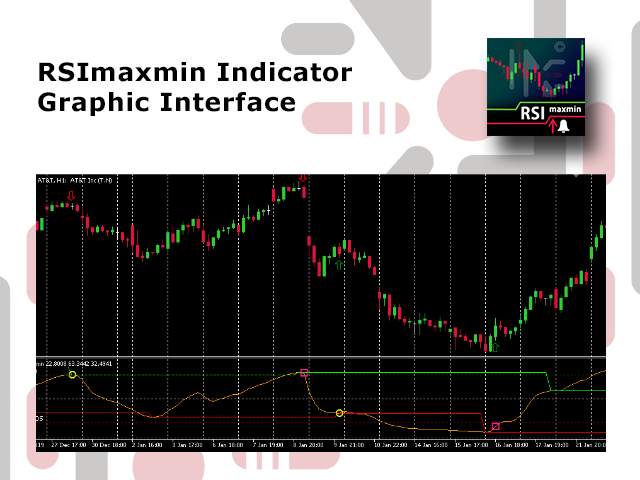
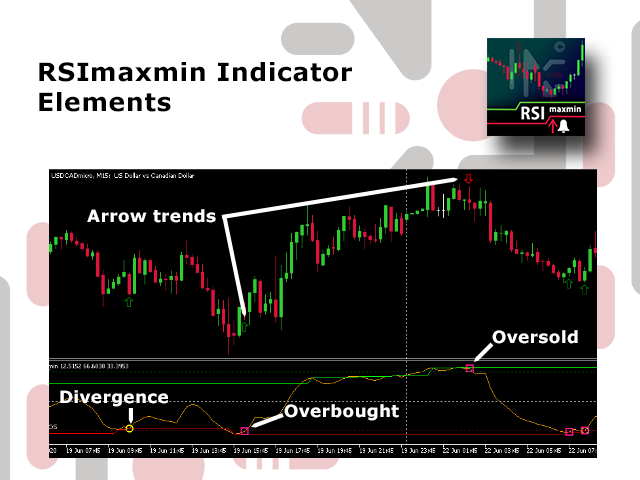
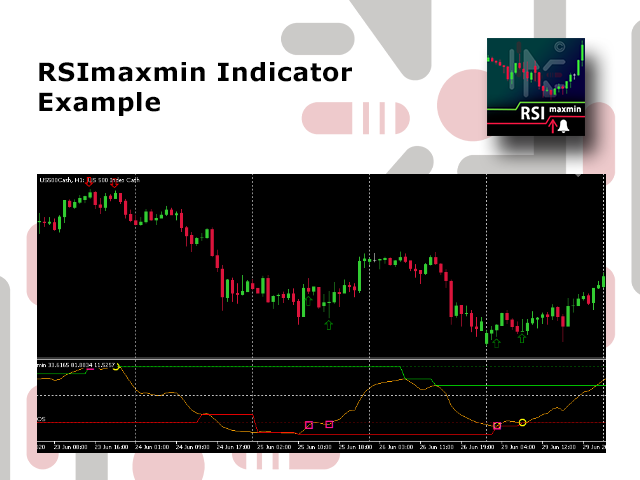
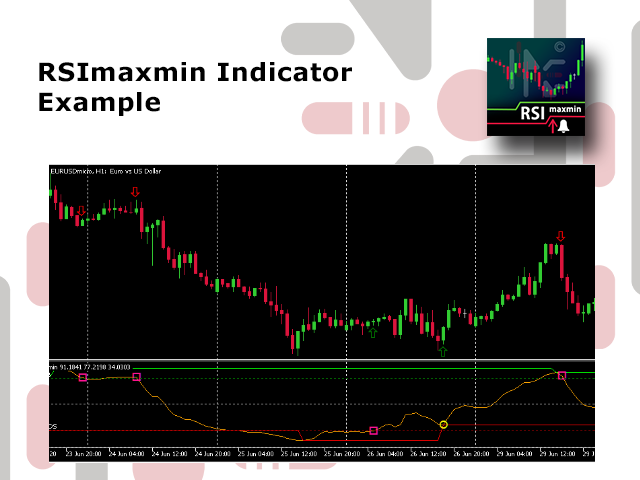
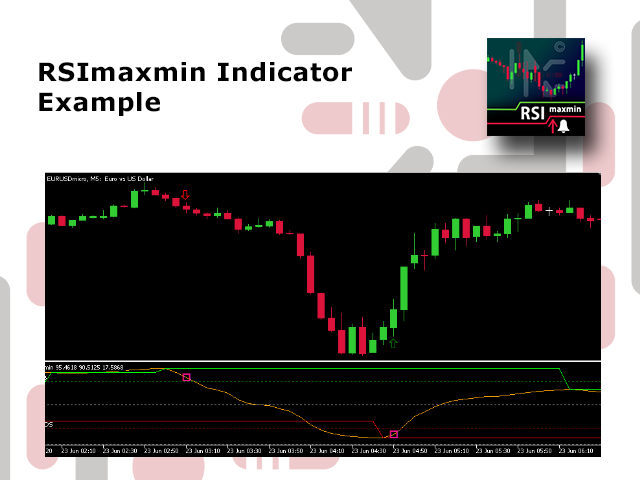
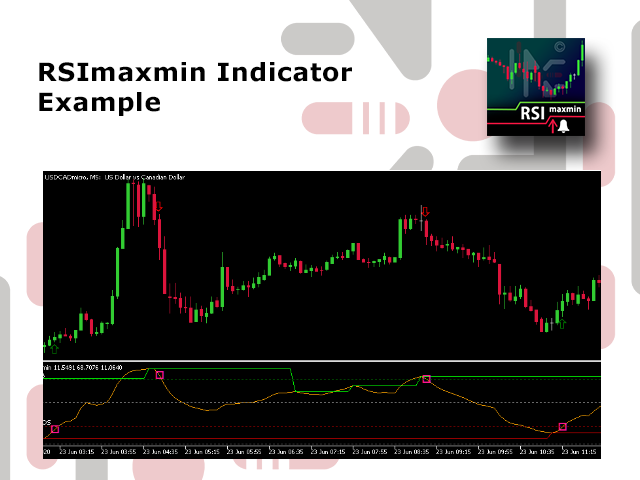
The RSImaxmin indicator provides valuable market information and signals of overbought, oversold, bullish divergence and bearish divergence that it detects automatically. These signals are represented in the oscillator as circles for divergence points and squares for overbougnt points. Immediately, you can receive configurable alerts of these signals.

In addition, this indicator has two unique characteristics; you can chart dynamic support and resistance levels that it automatically calculates according to the market to which it has been applied and the input parameters conveniently set by the trader. Overbought and oversold levels are also automatically calculated for each chart optimizing results.

The second unique feature of RSImaxmin is its “ cleaner RSI ” filter developed to reduce signal noise, this filter can be very useful to improve the effectiveness of a strategy.

Features

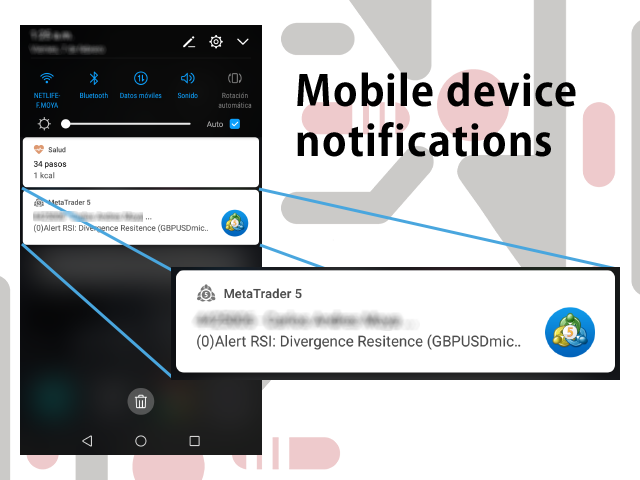
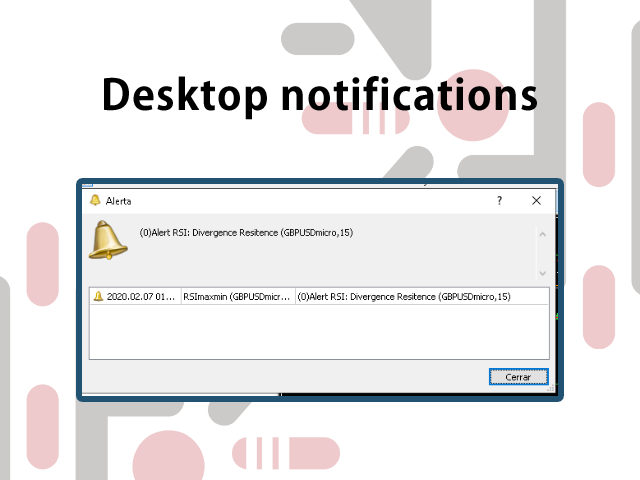
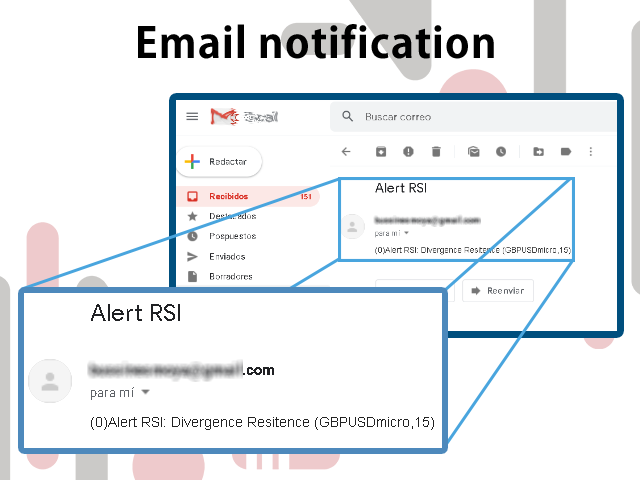
  • The indicator allows to generate alerts in different configurations (mobile application - Push, email, desktop application) when divergences and overpricing are detected
  • Alerts can be repeated for the same event to guarantee or to recognize the RSImaxmin
  • The RSImaxmin simplifies the parameters as much as possible, so that the trader can avoid complex settings
  • The RSImaxmin is valid for any asset and any time horizon
  • It can be used in strategies based solely on this indicator or it can be combined with other indicators
  • You can set the color of the indicator trend lines
  • Optimized and tested algorithm to ensure that it is always in service

contains:

  • Oscillatory line RSImaxmin
  • Two lines of dynamic levels of supports and resistances in the oscillator signal
  • Three fixed level lines, “resist OB", 50 and " support OS" (although you can add or remove lines at any level that the trader deems necessary in the setup)

Parameters

  • RSI Period is thecandlestick period used to calculate the value of the RSI oscillator
  • Tolerance to take as a max is the value used as a condition for accepting a peak as a new maximum
  • Tolerance to take as a min is the value used as a condition to accept a peak as a new minimum
  • Price and RSI calculation Kind the algorithm can use all forms of price calculation including HL/2, HLC/3 and HLCC/4  
  • Activate the cleaner RSI this is true if you want to use the filter on the oscillator to reduce signal noise
  • View divergence (circle) is true if you want to display circles in the oscillator at the points where divergence occurred
  • View overprice (square) is true if you want to display square in the oscillator at points where overpricing is detected
  • View trend in chart (arrow) is true if you want to see an arrow on the candlestick chart indicating the possible trend according to RSImaxmin oscillator.
  • View support and resist levels is true if you want to see support and resistance calculated automatically
  • Alert Settings This parameter allows you to choose the alerts you want to receive regarding the indicator. These can be:
    • alerts_ off 
    • maxmin_ Divergences 
    • max_ Divergences 
    • min_ Divergences 
    • overbought 
    • oversold 
    • overbought_ sold 
    • all_ alerts 
  • Alert Kind are the options that the program allows to notify you of an event (mobile application, email, desktop application). These can be:
    • Mobile (you must have this option activated on your MT5 platform)
    • Email (you must configure your MT5 platform to receive emails)
    • Desktop 
    • Alls choose 
  • Alert repetition per event these are the times you can repeat an alert for the same event. You can repeat an alarm 1, 3, 5 and 10 times as you think necessary

If you have any questions or suggestions, you can contact me via the following link.

评论 12
José Fábio RP
125
José Fábio RP 2023.10.26 16:23 
 

I have to say this indicator is wonderful. Thanks for working on it.

odymt5
175
odymt5 2021.10.05 13:54 
 

Thank you for an excellent indicator, easy to use.

Paul Bell
148
Paul Bell 2021.04.05 10:41 
 

very useful product

推荐产品
Sync In Many Ways MT5
Sa No Tsuyoshi Kokorozashi
Description This is a Utility tool for MT5 which will make our chart analysis task quite more efficient and save large amount of time. As for chart analysis, some are watching out several symbol simultaneously with single timeframe and others are trading only one single pair with   multi timeframe analysis. For both, a common troublesome issue is “scroll chart to look back” or “draw chart objects” in multi charts at the same time.  Especially for those who are trading with multi timeframe soluti
One Direction Pro is a combination of hedging, Grid averaging, pyramiding, lot martingale - anti martingale strategies, which aims to enter and exit the market as quickly as possible so as not to be trapped by unexpected market changes. Bot Explanation & Setfile |  MT4 version   Expert parameters: 1. Manage Open Positions Trade Buy: allow buy Trade Sell: allow sell Select Entry Method Period in bars for indicators : Average period Distance from High & Low Bands & Envelopes(in pips) : Distan
ADAM for FTMO 5
Vyacheslav Izvarin
5 (1)
ADAM EA Special Version for FTMO Please find new Version here  https://www.mql5.com/en/market/product/113326 Our 1st EA created using ChatGPT technology Trade only GOOD and checked PROP FIRMS  Default parameters for Challenge $100,000 Tested on EURUSD and GBPUSD only  Use 15MIN Time Frame Close all deals and Auto-trading  before Weekend at 12:00 GMT+3  Friday For Prop Firms MUST use special Protector  https://www.mql5.com/en/market/product/94362 ------------------------------------------------
Meditation Seed: Meditation is a practice in which an individual uses a technique – such as mindfulness, or focusing the mind on a particular object, thought, or activity – to train attention and awareness, and achieve a mentally clear and emotionally calm and stable state.[1][2][3][4][web 1][web 2] Meditation is practiced in numerous religious traditions. The earliest records of meditation (dhyana) are found in the Upanishads, and meditation plays a salient role in the contemplative repertoire
FREE
Bukele UP
Jhon Michael Antony Florez Roa
---> Schedule of the broker that I use for Back Testing <---- Broker schedule used in Back Testing: UTC/GTM +2 hours. --->   Minimum capital for its correct operation  <---- 1000 USD ----> Strategy <---- It is a range strategy, in which if it breaks the maximum a purchase is made or if it breaks the minimum a sale is made. This range is created every day and open trades and orders are closed before the market closes. The Buy has the Stop Loss at the bottom of the range and the Sell has
Trump Up
Jhon Michael Antony Florez Roa
----> Schedule of the broker that I use for Back Testing <---- Broker schedule used in Back Testing: UTC/GTM +2 hours. ---> Minimum capital for its correct operation <---- 1000 USD ----> Strategy <---- This has two strategies in one Expert Advisor: 1) Trend Scalpin in US-30 and 2) Grid in EURGBP 1) Trend Scalpin in US-30: First analyze the general trend in H1 by crossing Emas and Parabolic Sar, then analyze a Pull Back in M5 with the help of the RSI. This is done on
Zelenskyy Up
Jhon Michael Antony Florez Roa
----> Schedule of the broker that I use for Back Testing <---- Broker schedule used in Back Testing: UTC/GTM +2 hours. ---> Minimum capital for its correct operation <---- 1000 USD ----> Strategy <---- This expert advisor is a Bot that analyzes, through EMA, AMA and ADX in longer periods of time, whether the market is in a range or not. After detecting the range, he enters smaller time frames looking for small pull backs with the RSI to carry out operations. If the operation g
UPDATE MAR/20 OBS: Please after purchase contact US via CHAT to suport. This Product is a Market Scanner based on Didi Index Indicator. He can scan all time frames of Symbols in Market Watch, client can customize according the demand, its can scan a single symbol or more than 100. Manual: Link Driver Link do Manual Video:   LINK The Scanner informs 4 kind of signals, all alerts are providing from Didi Index Indicator: 1 - Didi Index - Alert of Buy : Cross up of "Curta" short moving averag
About indicator > The indicator is a function based on one value (open/high prices up to now) and then it is a mathematical representation of the whole function that is totally independent from any else values. So, if you ask yourself will the future be as it is on the graph... I can tell you - as it was the same as the trading function up to the moment "now"... In conclusion, the point of the indicator is  to try to show the future of the trading function into eternity. The graphic is sometim
AO Trade
Ka Lok Louis Wong
AO Trade 系統是專門為趨勢交易而設計,利用競價時段或新聞時間作為參考點,與其他特定時間進行比較,以預測市場趨勢。 ** EA 中使用的所有時間參數均基於您的終端時間。不同的經紀人可能運作在不同的格林尼治標準時間區域,亦可能因夏令時調整而進一步變化。 請確保在實施之前對齊您終端的時間設置進行全面驗證。** 推薦設置: Use in   M1  timeframe HK50 / DE40 / ustec / UK100 在時間檢查期間,您將注意到價格檢查發生在特定檢查時間分鐘之後的1分鐘(1.2檢查時間分鐘)。這個設計是有意的,允許參考的柱子完成,從而確保開盤價、最高價、最低價和收盤價可以用於與訂單時間進行準確比較。 設置: -----------------1 Timers------------------- 1.1 Check time hour (HH)    --  用於記錄價格的時間戳。 1.2 Check time minute (MM) 1.3 Order time hour (HH)    -- 用於與檢查價格進行比較以開啟訂單的時間戳。 1.4 Or
Time Closer 可以幫助您在指定的時間“每天”關閉所有未平倉單。 主要適用於不想持單過夜, 不想持單在 不同交易時段 , 不想持單在 特定時間內 。 使用非常簡單 用法 1. 下載並拖動 Time Closer  在圖表上 (圖表符號應與您希望平倉的圖表符號相同) 2. 選中“允許自動交易”為“開” 3. 設定參數 輸入參數 Turnon  True - 啟動 Time Closer False - 關閉  Time Closer Close All Open Position Time (Server Time)  - 設定指定時間 (交易商平台伺服器時間) , 在 指定時間把 所有未平倉單平倉 Time Closer can help you closing all the open position at the specified time "Everyday". Mainly for Day trader that don't want to hold position overnight, or over different session
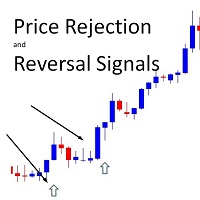
!! FLASH SALE !!   Over 80% off !!     For ONE week only. Now only $47 - normally $297! >>>      Ends on 30 June 2023 - Don't miss it! Buy and Sell Arrows On The Chart According To Price Action Sends Alerts On MT5 To Your Phone To You Email Does NOT repaint. Works on any pair, any timeframe.     10 Activations allowed so you are free from limitations. MT4 Version here . For spreads from a tiny 0.1 pips RAW/ECN Accounts,  click here . Check out my Waka Esque EA signal here: >>   High Ri
多货币前蜡烛或前柱扫描仪可帮助您扫描具有从指标设置中选择的任何自定义时间范围的多品种图表。 基于产品: https://www.mql5.com/en/market/product/78657 它可用于扫描前一天高低、前一周高低、上个月高低或任何自定义时间范围的多个交易品种,例如 前 4 小时图高低 当价格触及高线或低线时,它会过滤噪音并发出方向警报 策略很简单,当触及前一天、一周或一个月的高点和低点时,价格会在较小的时间范围(如 5 分钟)内被拒绝 它具有选择各种警报类型的选项 您可以选择并设置扫描频率(以毫秒为单位) 1000 表示每秒扫描市场观察中的所有交易品种 产品特点 1. 终端警报 2. 电子邮件提醒 3. 推送通知 多货币前蜡烛或前柱扫描仪可帮助您扫描具有从指标设置中选择的任何自定义时间范围的多品种图表。 基于产品: https://www.mql5.com/en/market/product/78657 它可用于扫描前一天高低、前一周高低、上个月高低或任何自定义时间范围的多个交易品种,例如
RSIScalperPro
PATRICK WENNING
介绍 RSIScalperPro - 这款基于 RSI 指标的革命性交易指标适用于 MetaTrader 5,专为一分钟图表的剖刺交易而设计。借助 RSIScalperPro,您将拥有一个强大的工具箱,用于精确的入场和出场信号,提升您的交易水平。 RSIScalperPro 使用两种不同的 RSI 指标,为超买和超卖区域提供清晰的信号。您可以根据自己的偏好自定义两个 RSI 的时间周期和限制值,以实现您的交易策略的最佳效果。图表上的明显箭头使您可以轻松识别何时进入或退出交易。 RSIScalperPro 的另一个亮点是三个可自定义的移动平均线,帮助您识别趋势方向并确认强大的交易信号。这使您可以早早发现趋势并参与到盈利交易中。 此外,您可以设置 RSIScalperPro 发出每个新交易信号的听觉警报。这样,即使您不经常坐在计算机屏幕前,也不会错过任何重要的交易机会。 RSIScalperPro 提供用户友好的界面,并且在 MetaTrader 5 中很容易插入和配置。您可以根据个人交易偏好自定义指标,并利用其多样化的功能,提高交易成果。 利用 RSIScalperPro 的优势,提高
KillZones ICT Series
Juan Pablo Castro Forero
Kill Zones ICT 是一个功能强大的指标,能让您从更好的角度看市场。该指标工具可在图表上显示交易中最重要的因素之一,即时间。通过其简易的界面,您可以轻松查看波动率较高的时段以及活跃度较低的时段的走势。 如何使用该指标交易 ICT/流动性概念?  如何使用 Kill Zones ICT? z 为什么使用 Kill Zones ICT? 当主要交易时段在市场开始时买入和卖出。通过此指标,您将看到交易的最佳时间,并轻松识别当天的交易方向。您将收到提醒,知道何时交易并在图表上做好准备。此指标不仅用于显示交易时间,还可以修改指标显示的时间和名称,从而允许您绘制著名的 Killzone’s或Macros时间 ,这是由于大型机构的快速和强劲市场移动,使交易成功的机会更高的时间。 该指标还显示前几天的交易时段,并具有仅绘制当前时段的选项,以适应每个交易者的偏好和使用。此外,它还显示前一天交易时段的移动点数。这将使您更好地了解当前时间的预期,并做出更明智的决定。 其他功能  会话开始和结束时间的垂直线。 时段开始时的警报。 中间区间图,查看价格何时超卖或超买。 此外,为
Tim Trend
Oleksii Ferbei
Due to the fact that at each separate period of time, trading and exchange platforms from different parts of the planet are connected to the trading process, the Forex market operates around the clock. Depending on which continent trading activity takes place during a certain period, the entire daily routine is divided into several trading sessions. There are 4 main trading sessions: Pacific. European. American Asian This indicator allows you to see the session on the price chart. You can als
News Clock
Victor Klenov
The professional browser of News and Trading Sessions is now available in MetaTrader 5. Now all the most important market information is collected on one dial! News located on the Time scale. Planning your working time has never been so easy and convenient ... The news scale can be switched a day, two, a week, a month forward or backward (see the details in the short video). All news updates in real time. Thanks to the built-in filters, you can configure the display of news by importance,
H1NqAAAB
Jose Arranz Becerril
Bot specifically tailored for the NASDAQ 100 , built to identify high-probability turning points in the market. This bot utilizes advanced logic to capture opportunities when prices revert to key levels, ensuring precision and adaptability. Long Entry Signal : Triggers when the daily low crosses above the closing price, combined with the Average True Range (ATR) shifting upwards, signaling potential bullish reversals. Short Entry Signal : Activates when the daily high crosses below the closing p
Statistics Boom and Crash
Marcelo Jose Patino Vargas
SYSTEM DESCRIPTION Our MT5 EA uses an advanced statistical system to determine the optimal time to open sell positions on the BOOM 1000, BOOM 500, and BOOM 300 assets. Based on rigorous market data analysis, the EA identifies the moment when there is a 90% probability of a bearish candle, allowing our users to enter a sell position with maximum confidence in success. This data-driven approach is the key to achieving profitable and consistent trades in BOOM 1000, and our EA is designed to aut
ClearArrows MT5
Pavel Krysanov
For any trader, the result of market analysis is the correct determination of entry and exit points from the market. The ClearArrows indicator does not display any unnecessary information that may distract or mislead the trader, but only the most important thing. The indicator is very easy to use, when a down arrow appears, you need to open a SELL deal, when an up arrow appears you need to open a BUY deal. The ClearArrows indicator, despite its outward simplicity, has a large analytical algor
Sinaleiro Trader
Renato Takahashi
O Sinaleiro Trader é o robô de daytrade que usa multiníveis de acordo com a abertura do dia. Assim, a cada rompimento dos níveis, o robô emite ordens de compra ou venda, de acordo com a tendência. Os stops podem ser fixos ou dinâmicos de acordo com os níveis. É possível configurar a distância do sinaleiro, bem como horários de trades e dias da semana. Alterar o parâmetro BR1 para BR.
FRB Candle Counter
Fernando Baratieri
Candle Counter This product counts the candles and shows the result according to the configuration defined by the user. Professional traders use it to emphasize a specific candlestick. Settings Position - Choose whether the numbers will be displayed above or below the candle Distance - The distance that the number will have from the candle, referring to the minimum or maximum Font Size - Font Size Color - Font Color
To get access to MT4 version please click   here . This is the exact conversion from TradingView: QQE MT4 Glaz-modified by JustUncleL This is a light-load processing and non-repaint indicator. All input options are available. This is not a multi time frame indicator. Buffers are available for processing in EAs. You can message in private chat for further changes you need.
!! FLASH SALE !!   Over 80% off !!     For ONE week only. Now only $47 - normally $297! >>>      Ends on 30 June 2023 - Don't miss it! Buy And Sell Signal Arrows On The Chart When The Price Is About To Reverse. Also Sends Alerts –On MT5 To Your Phone To Your Email. Does not repaint. Works on any pair, any timeframe.   (Just ajust the settings for your pair and timeframe.) 10 Activations allowed so you are free from limitations MT4 version here .   Spreads from 0.1pip RAW/ECN Acco
Utilities
Douglas Lucio De Araujo
Indicator with 3 features - Clock : Clock independent of the chart, counting continues even when the market is closed. - Template : After setting up a configuration in any graphic, be it color patterns, indicators, zoom ... The configuration will be copied to all active graphics. - TimeFrame : Set the TimeFrame on a chart, and with just one click all the active charts will be changed to the same TimeFrame.
Equity based Position Closure
POCKETSQUARE CONSULTING PRIVATE LIMITED
Our selling bot envisions a seamless and efficient selling experience for clients. We understand the importance of optimizing the selling process and maximizing sales potential. With our bot, clients can effortlessly list their products, services, or assets, and attract buyers through intelligent pricing strategies and targeted promotions. Our vision is to provide clients with a user-friendly interface where they can easily input all the necessary details for their listings. We aim to simplify t
MA Gold Sniper Entry
Samson Adekunle Okunola
利用我们的 MA Gold Sniper 入场 EA 最大化您的交易潜力 利用我们经验丰富的团队精心设计的 EA,改变您的交易体验,实现持续盈利和最佳性能。 安全的交易方法: 无风险策略: 避免使用高风险的网格或马丁格尔系统,确保交易更加安全稳定。 一致的方法: 采用经过验证的可靠交易策略,专注于长期成功和可持续性。 主要特点: 简单的 MA Sniper 入场策略: 精准的入场点: 利用改进的移动平均线 (MA) 交叉系统,高精度识别最佳入场点。 每日趋势分析: 分析 1 天 (D1) 时间范围,确定市场整体趋势方向,确保交易与当前趋势保持一致。 每小时精度: 在 1 小时 (H1) 时间范围内,当 5 移动平均线 (MA) 超过 10 移动平均线 (MA) 时执行交易,确保在最合适的时机进行交易。 高级资金管理: 智能头寸调整: 使用动态头寸调整算法,有效管理资本,最大限度降低风险,最大化增长潜力。 资本保全: 专注于保护您的投资,确保长期可持续性,减少亏损。 卓越的风险回报率: 利润最大化: 战略性设计,优化风险和回报的平衡,提高您的利润潜力,风险回报率为 1/3。 风险缓解:
Introduction This indicator detects volume spread patterns for buy and sell opportunity. The patterns include demand and supply patterns. You might use each pattern for trading. However, these patterns are best used to detect the demand zone (=accumulation area) and supply zone (=distribution area). Demand pattern indicates generally potential buying opportunity. Supply pattern indicates generally potential selling opportunity. These are the underlying patterns rather than direct price action. T
This Indicator adding power to traditional zigzag indicator. With High-Low numbers in vision it will be easier to estimate change of trend by knowing the depth of each wave. Information including points, pips, percentage%, and #bars can be displayed based on configuration. All information is real-time update. This indicator is especially useful in sideway market to buy low sell high.
Elliott Wave Helper
Siarhei Vashchylka
4.92 (13)
Elliott Wave Helper - a panel for making elliott wave and technical analysis. Includes all known wave patterns, support and resistance levels, trend lines and cluster zones. Manual (Be sure to read before purchasing) | Version for MT4 Advantages 1. Making wave analysis and technical analysis in a few clicks 2. All Elliott wave patterns available, including triangle and combinations 3. All nine wave display styles, including a special circle font 4. E lements of technical analysis : trend lines
该产品的买家也购买
TPSpro RFI Levels MT5
Roman Podpora
4.67 (15)
指示       俄罗斯 -        英语   建议 与指示器一起使用     -       TPSpro 趋势专业版 -   MT4版本       交易中的一个关键要素是做出买卖交易工具决定的区域或水平。尽管主要参与者试图隐藏他们在市场中的存在,但他们不可避免地会留下痕迹。我们的任务是学习如何识别这些痕迹并正确解释它们。 主要功能: 向卖家和买家显示活跃区域! 该指标显示所有正确的初始买入和卖出脉冲水平/区域。激活这些水平/区域后,开始寻找切入点,水平会改变颜色并填充特定阴影。此外,还会显示箭头,以便更直观地了解情况。 显示更高时间范围内的级别/区域(MTF 模式) 添加了使用更高时间间隔显示级别/区域的功能。此外,该指标还具有自动趋势检测功能(   TPSproTREND PRO   )。 用于交易的单独专业的逐步算法。 该算法专为日内交易而设计,既可顺势交易,也可逆势交易。每个活动模板均提供详细说明。 适用于多种时间范围 。 TPSpro RFI 水平指标可用于图表上的任何时间范围,从一分钟(M1)开始一直到每月(MN)。 图形和声音警报。 该指标提供图形和声音指示
TPSproTREND PrO MT5
Roman Podpora
4.54 (13)
RelicusRoad Pro MT5
Relicus LLC
5 (17)
现在$ 147(更新后增加到$ 499) - 无限帐户(PC或Mac) RelicusRoad 用户手册 + 培训视频 + 访问 Private Discord Group + VIP 身份 一种看待市场的新方式 RelicusRoad 是世界上最强大的外汇、期货、加密货币、股票和指数交易指标,为交易者提供保持盈利所需的所有信息和工具。我们提供技术分析和交易计划,帮助每一位交易者取得成功,从初学者到高级。它是一个关键的交易指标,可以提供足够的信息来预测未来的市场。我们相信一个完整的解决方案,而不是图表上几个没有意义的不同指标。这是一个多合一指标,显示无与伦比且非常准确的信号、箭头 + 价格行为信息。 RelicusRoad 基于强大的人工智能,提供缺失的信息和工具来教育您并使您成为交易专家,成为成功的交易者。 几乎所有技术指标都滞后,这意味着它们只能报告已经发生的事情。因此,他们只确认您过去可以看到的价格已经在哪里。我们相信领先指标可以预测未来价格,而无需重新绘制,也不要过度依赖可能改变并导致重新绘制的滞后指标。如果您根据滞后指标进行交易并建立头寸,您就知道您已
Golden Trend Indicator MT5
Noha Mohamed Fathy Younes Badr
4.82 (11)
Golden Trend indicator  is The best indicator for predicting trend movement this indicator never lags and never repaints and never back paints    and give  arrow buy and sell    before the candle appear  and it will help you and  will make your trading decisions clearer its work on all currencies and  gold and crypto and all time frame This unique  indicator uses very secret algorithms to catch the  trends, so you can trade using this indicator and see the trend clear on charts  manual guide and
FX Volume MT5
Daniel Stein
4.93 (14)
利用外汇交易量在外汇交易中获得真正的优势:终极成交量指标 外汇交易量(FX Volume)是第一个也是唯一一个从内部人士的角度揭示真实市场情绪的交易量指标。通过对机构市场参与者和经纪商的定位提供独到的见解,FX Volume 使您能够以通常只为主要参与者保留的先见之明进行交易。告别 COT 报告的延迟,FX Volume 可以在您的图表上即时为您提供这些关键信息,使您能够做出更快、更明智的交易决策。 为什么外汇交易量对您的交易至关重要? 使用 FX Volume,您可以获得无与伦比的独特市场数据,为您提供一般交易量指标无法提供的洞察力。以下是您可以在图表上直接跟踪的数据: 仓位比率:查看各种货币的多空比率,清晰了解市场情绪。 比率变化:查看所选时间段内多头头寸的百分比变化。 总交易量:实时跟踪各货币的总交易量(多头和空头)。 详细的多头和空头交易量:准确了解每种货币的买卖量。 净多头交易量:查看多头和空头头寸之间的差额,以衡量净情绪。 净多头百分比变化:以百分比的形式了解净多头情绪的变化,以便快速比较。 成交量-价格相关性:跟踪成交量如何影响价格,找到潜在转折点。 如何访问
Quantum TrendPulse
Bogdan Ion Puscasu
5 (5)
介绍 Quantum TrendPulse   ,这是一款终极交易工具,它将 SuperTrend   、   RSI 和 Stochastic 的强大功能整合到一个综合指标中,以最大限度地发挥您的交易潜力。该指标专为追求精准和效率的交易者而设计,可帮助您自信地识别市场趋势、动量变化以及最佳进入和退出点。 主要特点: 超级趋势整合: 轻松跟随当前的市场趋势并乘上盈利浪潮。 RSI 精度: 检测超买和超卖水平,非常适合把握市场逆转时机,可用作 SuperTrend 的过滤器 随机精度: 利用随机振荡在波动的市场中寻找隐藏的机会, 用作超级趋势的过滤器 多时间范围分析: 从 M5 到 H1 或 H4,在不同时间范围内关注市场动态。 可定制的警报: 当您的自定义交易条件得到满足时收到通知,这样您就不会错过任何交易。 无论您是新手还是经验丰富的交易员,   Quantum TrendPulse 都能为您提供所需的优势,帮助您增强策略并自信地进行交易。借助这一强大的指标,将洞察力转化为利润 — 掌控您的交易! ***购买 Quantum TrendPulse,即可免费获得 Quantum T
FX Power MT5 NG
Daniel Stein
5 (7)
释放 FX Power NG 的全部威力:终极货币强度表 八年多来,FX Power 一直为全球交易者提供可靠、精确的货币强弱分析。 现在,FX Power NG 将这一值得信赖的工具提升到新的水平,提供先进的功能,为您的交易带来无与伦比的准确性、定制化和洞察力。 是什么让 FX Power NG 成为严肃交易者的必备工具? FX Power NG 以您喜爱的原版 FX Power 的所有功能为基础,进行了重要的添加和改进: 黄金强度分析 (XAU):现在,您可以在追踪货币对的同时追踪黄金的强弱,从而获得更广泛的市场洞察力。 精细计算:在每次分析中体验更精确、更可靠的结果。 自定义分析周期:调整分析周期以适应您的交易策略,从日内分析到长期洞察。 先进的多实例设置:运行多个实例以获得全面的视图,非常适合分析多个时间框架或策略。 无限图形定制:个性化每个图表的颜色和样式,以匹配您的交易环境。 增强的警报功能:设置自定义通知,让你不会错过重要的转变或机会。 现代设计和动态面板:享受专为最新操作系统设计的时尚、用户友好界面,以及流畅的交互式指标面板。 FX Power NG 的突出
Atomic Analyst MT5
Issam Kassas
4.32 (19)
首先值得强调的是,该交易指标是非重绘、非延迟的指标,这使其成为手动和机器人交易的理想选择。 用户手册:设置、输入和策略。 Atomic Analyst是一种PA价格行动指标,利用价格的力量和动量来寻找市场上更好的机会。配备了高级过滤器,可帮助去除噪音和假信号,并提高交易潜力。使用多层复杂的指标,Atomic Analyst扫描图表,并将复杂的数学计算转化为任何初学者都能理解并用来做出一致交易决策的简单信号和颜色。 “Atomic Analyst”是专为新手和经验丰富的交易者量身定制的综合交易解决方案。它将高级指标和一流功能融合为一体的交易策略,使其成为所有类型交易者的多功能选择。 日内交易和剥头皮策略:专为快速准确的日内交易和短期交易而设计。 日内和摆动交易策略:可用作追求价格大幅波动的日内和摆动交易者的可靠工具。 多货币和市场:凭借其可靠的精度,在不同的工具和市场上运作。 多个时间框架:可在多个时间框架上使用,性能良好。 稳定性:所有指标均不重绘、不重绘和不滞后,确保可靠的信号。 信号清晰度:提供箭头信号,用于清晰的入场和出场点。 实时警报:通过交易入场、SL和TP警报通知交
Gold Trend 5
Sergei Linskii
5 (1)
黄金趋势 - 这是一个很好的股票技术指标。该指标算法分析资产的价格走势,并反映波动性和潜在进入区。 最佳指标信号: - 卖出 = 红色柱状图 + 红色短指针 + 同方向黄色信号箭头。 - 买入 = 蓝色柱状图 + 蓝色多头指针 + 同方向水蓝色信号箭头。 该指标的优点 1. 该指标生成的信号准确度高。 2. 只有当趋势发生变化时,才能重新绘制已确认的箭头信号。 3. 您可以在任何经纪商的 MetaTrader 5 交易平台上进行交易。 4. 您可以交易任何资产(货币、金属、加密货币、股票、指数等)。 5. 最好在 H1 时间框架(中期交易)上进行交易。 6. 在指标设置中可更改个别参数(TF、颜色等),以便每位交易者都能轻松定制适合自己的指标。 7. 该指标既可作为交易系统的主要补充,也可作为独立的交易系统使用。   注意:交易的入市准确性和盈利能力仅取决于交易者的技能。任何指标都只是交易者的助手,而非行动指南。 MetaTrader 4 黄金趋势指标版本  祝大家交易好运,稳定盈利!
FX Dynamic - 您需要的唯一 ATR 指标 准备好用无与伦比的精确性和洞察力为您的交易策略增添动力了吗? FX Dynamic 是首个也是唯一的 ATR 指标,专为 货币分析 和 自动调整经纪商的 GMT 变动 而设计。告别过时的工具,拥抱掌握市场波动的终极解决方案。 为什么 FX Dynamic 能够改变游戏规则? 基于货币的 ATR 分析 - 摆脱传统工具的束缚。FX Dynamic 是首个超越外汇货币对和商品等符号的 ATR 指标,可 深入洞察 单个货币的 波动性 。 无与伦比的 GMT 时区 转换调整准确性 - 无需再手动修正时区。FX Dynamic 会 自动考虑经纪商的 GMT 时区转换 ,确保提供市场上最准确、最可靠的分析。 一体化多功能性 - 从短期剥头皮到长期投资,FX Dynamic 可通过自定义时间框架和精确设置适应您的交易风格。 交易者喜爱的功能 多资产分析: 分析货币、外汇货币对、黄金等。FX Dynamic 可让您发现 单个货币 对之外 的 true 动态 。 增强型风险管理: 利用为每种资产和货币量身定制的可靠 ATR 数据,自信地
Basic Harmonic Patterns Dashboard MT5
Mehran Sepah Mansoor
4.57 (7)
该仪表盘显示所选符号的最新可用谐波形态,因此您可以节省时间并提高效率 /  MT4 版本 。 免费指标:  Basic Harmonic Pattern 指标列 Symbol:   显示所选符号 Trend:     看涨或看跌 Pattern:    形态类型(Gartley、蝴蝶、蝙蝠、螃蟹、鲨鱼、Cypher 或 ABCD) Entry:     入口价格 SL: 止损价 TP1: 第一止盈价 TP2: 第二次获利价格 TP3: 第三次获利价格 Current price:    当前价格 Age (in bars):   最后绘制的模式的年龄 主要输入 Symbols :   从 "28 种主要货币对 "或 "选定符号 "中选择。 Selected Symbols :   希望监控的符号,用逗号分隔("EURUSD,GBPUSD,XAUUSD")。如果您的经纪商为货币对设置了后缀或前缀,您必须在以下两个参数中添加(货币对前缀或货币对后缀)。 Max Iteration:   调整模式的最大迭代次数(如果该值越小,则模式越少,性能越快;如果该值越大,则模式越多,性能
Blahtech Supply Demand MT5
Blahtech Limited
4.54 (13)
Was: $299  Now: $99   Supply Demand uses previous price action to identify potential imbalances between buyers and sellers. The key is to identify the better odds zones, not just the untouched ones. Blahtech Supply Demand indicator delivers functionality previously unavailable on any trading platform. This 4-in-1 indicator not only highlights the higher probability zones using a multi-criteria strength engine, but also combines it with multi-timeframe trend analysis, previously confirmed swings
Entry Points Pro for MT5
Yury Orlov
4.44 (125)
这款指标用于 MT5,可提供准确的入场交易信号,且无重绘。 它可应用在任何金融资产:外汇、加密货币、贵金属、股票、指数。 它将提供极其精准的评估,并告诉您何时开仓和平仓的最佳时机。 观看 视频 (6:22),其中包含一个仅处理单一信号的示例,该信号即可值回指标购价! 大多数交易者在 Entry Points Pro 指标的帮助下,在第一个交易周内即改善了他们的交易结果。 订阅我们的 Telegram 群 ! Entry Points Pro 指标的益处。 入场信号无重绘 如果信号出现,并得到确认,则它不会再消失;不像是重绘指标,它会导致重大的财产损失,因为它们可以在显示信号后再将其删除。 无差错开仓 指标算法可令您找到入场交易(买入或卖出资产)的理想时机,从而提高每位交易者的成功率。 Entry Points Pro 可操作任何资产 它允许您在 MT5 平台上交易任何经纪商的加密货币、股票、贵金属、指数、大宗商品和货币。 提供任何方向的信号 Entry Points Pro 指标提供针对任意价格走势的入场交易信号 - 上涨、下跌或横盘(横向)。
MetaForecast M5
Vahidreza Heidar Gholami
5 (2)
MetaForecast能够根据价格数据中的谐波来预测和可视化任何市场的未来走势。虽然市场不总是可预测的,但如果价格中存在模式,MetaForecast可以尽可能准确地预测未来。与其他类似产品相比,MetaForecast通过分析市场趋势可以生成更精确的结果。 输入参数 Past size (过去的尺寸) 指定MetaForecast用于创建生成未来预测模型的柱数量。该模型以一条黄色线绘制在所选柱上。 Future size (未来的尺寸) 指定应预测的未来柱数量。预测的未来以粉色线表示,并在其上绘制了蓝色回归线。 Degree (程度) 此输入确定了MetaForecast将在市场上进行的分析级别。 Degree 描述  0 对于程度0,建议使用较大的值来设置“过去的尺寸”输入,以覆盖价格中的所有高峰、低谷和细节。  1 (建议的) 对于程度1,MetaForecast可以理解趋势,并通过较小的“过去的尺寸”生成更好的结果。  2 对于程度2,除了趋势,MetaForecast还可以识别反转点。对于大于1的程度,必须使用较高的“细节”和“噪音减少”输入值。  大于2 不建议使用大
Enjoy a   50% OFF   Christmas holiday sale!   After your purchase, feel free to contact me for more details on how to receive a bonus indicator called VFI, which pairs perfectly with Easy Breakout for enhanced confluence!     Easy Breakout MT5   is a powerful price action trading system built on one of the most popular and widely trusted strategies among traders: the   Breakout strategy ! This indicator delivers crystal-clear Buy and Sell signals based on breakouts from key support and re
成為突破者,隨著價格反轉,市場結構會改變利潤。 訂單突破者指示器可以識別趨勢或價格走勢何時接近枯竭並準備好逆轉。它會提醒您市場結構的變化,通常會在發生逆轉或重大回調時發生。 該指標使用專有計算來確定突破和價格動能。每當在可能的耗盡點附近形成新的高點時,指標就會繪製最後一個生成該高點的順序塊。然後,它將隨價格移動隨價格跟隨定單。然後,當價格轉向相反方向並突破該訂單塊時,它會提醒您,從而創建新的市場結構並開始趨勢或重大回調的可能逆轉。 訂單塊是在創建高/低之前的最後一個相反的彩色蠟燭,並且當價格跌破這些關鍵區域以下時,這表明趨勢可能會發生短期或長期反轉。 特徵 提醒您關鍵耗盡點的市場結構變化 價格接近耗盡水平時自動提取訂單塊 在一個方向繼續移動時,在價格後面跟踪定單,以提醒您最佳的反轉輸入 將顏色更改為純色塊,以顯示何時發生市場結構中斷。 適用於所有交易品種和時間範圍 內置集成的彈出窗口和電子郵件警報 策略和如何與定單破壞者指標進行交易 當斷路器塊發生時,您有兩個選擇。 看左邊!我們正在尋求供應/需求或支撐/阻力位嗎?市場結構轉變(逆轉)通常發生在價格重新測試舊水平或
Quantum Trend Sniper
Bogdan Ion Puscasu
4.72 (50)
介绍   量子趋势狙击指标 ,突破性的 MQL5 指标,正在改变您识别和交易趋势反转的方式!由拥有超过13年交易经验的资深交易员团队开发,     量子趋势狙击指标   旨在通过其创新的方式以极高的准确度识别趋势反转,将您的交易之旅推向新的高度。 ***购买量子趋势狙击指标,即可免费获得量子突破指标!*** 当量子突破指标识别出趋势反转时,它会向您发出警报和信号箭头,并建议您三个止盈水平。 它既适合新手交易者,也适合专业交易者。 量子 EA 通道:       点击这里 MT4版本:       点击这里 建议: 时间范围: 所有时间范围。为了获得最佳结果,我们建议在 M15、M30 和 H1 时间范围内使用它。 货币对:欧元兑美元、英镑兑美元、澳元兑美元、欧元兑英镑、, EURAUD,  XAUUSD 账户类型:ECN、Raw 或 Razor,点差极低 经纪时间:任意 经纪商:IC Markets、Pepperstone with Raw 和 Razor 的点差最低 建议止损:50 点 建议止盈水平:20 点、50 点和
FX Levels MT5
Daniel Stein
探索外汇交易水平:您成功交易的终极支撑位和阻力位指标 FX Levels 不仅仅是一个支撑位和阻力位指标;对于那些希望在所有交易符号(无论是货币对、指数、股票还是商品)上获得精确性、可靠性和无缝功能的严肃交易者来说,它是一个改变游戏规则的工具。FX Levels基于成熟的灯塔(Lighthouse)方法,并增强了动态、实时的适应性,可将市场反转点直接显示在您的图表上,非常适合设定精确的盈利目标和优化您的交易条目。 为什么选择 FX Levels? Stein Investments 团队利用多年与经纪商及其不同数据源打交道的经验,使外汇交易水平在准确性和一致性方面脱颖而出。不同经纪商的水平几乎 100% 相同,FX Levels 为您提供无与伦比的可靠性,这是其他指标无法提供的。我们对细节的追求提升了 FX Levels 的水平,确保它不仅能满足您的期望,还能改变您进行支撑位和阻力位分析的方式。 FX Levels 的主要特点 两种分析方法:您可以选择经典的 "灯塔 "方法(适合静态、每日更新的水平),或者先进的动态方法(对蜡烛图形态做出实时反应,提供适应市场变化的可操作水
Berma Bands
Muhammad Elbermawi
5 (3)
The Berma Bands (BBs) indicator is a valuable tool for traders seeking to identify and capitalize on market trends. By analyzing the relationship between the price and the BBs, traders can discern whether a market is in a trending or ranging phase. Berma Bands are composed of three distinct lines: the Upper Berma Band, the Middle Berma Band, and the Lower Berma Band. These lines are plotted around the price, creating a visual representation of the price movement relative to the overall trend.
Matrix Arrow Indicator MT5
Juvenille Emperor Limited
5 (13)
矩阵箭头指标 MT5   是一种独特的 10 合 1 趋势,遵循   100% 非重绘多时间框架指标 ,可用于所有符号/工具: 外汇 、 商品 、 加密货币 、 指数 、 股票 。 Matrix Arrow Indicator MT5 将在其早期阶段确定当前趋势,从多达 10 个标准指标中收集信息和数据,它们是: 平均定向运动指数 (ADX) 商品渠道指数 (CCI) 经典 Heiken Ashi 蜡烛 移动平均线 移动平均收敛散度 (MACD) 相对活力指数 (RVI) 相对强弱指数 (RSI) 抛物线SAR 随机振荡器 威廉姆斯的百分比范围 当所有指标给出有效的买入或卖出信号时,相应的箭头将打印在图表上,在下一根蜡烛/柱线开盘时,指示强劲的上升趋势/下降趋势。用户可以选择使用哪些指标,并可以单独调整每个指标的参数。 Matrix Arrow Indicator MT5 仅从选定的指标中收集信息,并仅根据其数据打印箭头。   Matrix Arrow Indicator MT5   还可以为所有新信号发送终端、推送通知或电子邮件警报。无论您是黄牛、日内交易者还是波段交易者, Mat
TPA True Price Action indicator reveals the true price action of the market makers through 100% non-repainting signals strictly at the close of a candle! TPA shows entries and re-entries, every time the bulls are definitely stronger than the bears and vice versa. Not to confuse with red/green candles. The shift of power gets confirmed at the earliest stage and is ONE exit strategy of several. There are available now two free parts of the TPA User Guide for our customers. The first "The Basics"
TrendMaestro5
Stefano Frisetti
note: this indicator is for METATRADER4, if you want the version for METATRADER5 this is the link:  https://www.mql5.com/it/market/product/108106 TRENDMAESTRO ver 2.4 TRENDMAESTRO recognizes a new TREND in the bud, he never makes mistakes. The certainty of identifying a new TREND is priceless. DESCRIPTION TRENDMAESTRO identifies a new TREND in the bud, this indicator examines the volatility, volumes and momentum to identify the moment in which there is an explosion of one or more of these data a
MetaBands M5
Vahidreza Heidar Gholami
4.5 (2)
MetaBands使用强大且独特的算法绘制通道并检测趋势,以便为交易者提供进出交易的潜在点。它是一个通道指标和强大的趋势指标。它包括不同类型的通道,可以通过使用输入参数简单地合并以创建新通道。MetaBands使用所有类型的警报通知用户市场事件。 功能 支持大多数通道算法 强大的趋势检测算法 能够合并不同类型的通道 多时间帧和多货币(信号矩阵) 所有类型的警报功能(声音、屏幕闪烁、推送通知、电子邮件、弹出窗口、箭头) 它永远不会重绘 趋势检测 MetaBands使用在通道内振荡的蓝色线来检测趋势。当该线遇到通道的上界时,表明开始下跌趋势,当它遇到下界时,表明开始上涨趋势。如果蓝线接近中线,则市场处于整理期。 该指标使用独特的方法来检测趋势。一开始可能看起来有些复杂,但如果您观看视频教程,您就会意识到它是多么强大且易于使用。 入场和出场信号 当趋势变化或价格穿过上下通道时,MetaBands会立即通过不同的方法提醒交易者,这些方法可以在指标设置中启用。 信号矩阵 要监视来自不同时间框架的多个符号并在一个地方查看信号,请单击右上角按钮或按键盘上的M键以打开信号矩阵。该矩阵可以
首先,值得强调的是,这个交易系统是一个非重绘、非重画和非滞后的指标,这使得它非常适合手动和机器人交易。 在线课程,手册和下载预设。 “智能趋势交易系统 MT5”是专为新手和经验丰富的交易者量身定制的综合交易解决方案。它结合了超过 10 个优质指标,具有 7 多个强大的交易策略,使其成为适用于各种市场条件的多功能选择。 趋势跟随策略:提供精确的入场和止损管理,以有效地跟随趋势。 反转策略:识别潜在的趋势反转,使交易者能够利用区域市场的机会。 剃头策略:专为快速准确的日内交易和短期交易而设计。 稳定性:所有指标都不会重绘、不会重画和不会滞后,确保可靠的信号。 定制:支持自定义策略,以满足个人交易偏好。超过 7 种策略和组合可帮助您找到最佳策略。 信号清晰度:提供箭头信号,以指示清晰的入场和退出点。 实时警报:通过交易进出警报使交易者保持了解。 深入分析:提供更高时间框架的趋势分析和实时交易监控。 自适应颜色编码:利用蜡烛颜色编码来显示成交量、趋势和反转蜡烛信号。通过蜡烛颜色分析市场方向。 “智能趋势交易系统 MT5”赋予交易者必要的工具,以便在各种市场条件下做出明智和战略性的交易决策。无论
Advanced Supply Demand MT5
Bernhard Schweigert
4.5 (14)
任何新手或专业交易者的最佳解决方案! 该指标是一款独特、高质量、且价格合理的交易工具,因为我们已经整合了许多专有功能和新公式。 依据此更新,您将能够显示双重时间帧区域。 您不仅可以显示一个较高的时间帧,还可以同时显示图表时间帧,加上更高的时间帧:显示嵌套时区。 供需双方所有交易者都会喜欢它。 :) 重要信息披露 高级供需的最大潜力,请访问 https://www.mql5.com/zh/blogs/post/720245   想象您的交易如何得以改善,是因为您能够精准定位入场或目标位吗? 构建于新的底层算法,它可以更轻松地识别出买卖双方之间的潜在失衡。 这是因为它以图形方式展示供需最强劲区域,及其过去的表现(显示旧区域)。 这些功能旨在帮助您更轻松地发现最佳入场区域和价位。 现在您可以针对您的交易品种和时间帧来优化和编辑区域强度! 高级供需指标适用于所有产品和时间帧。 它是一个新的公式,非常新的功能是两个区域强度函数可由用户输入进行调整! 这在交易中是一大优势。 当您学习如何使用专有功能,例如带有价格游离最小 X 因子的区域强度时,您能够判断该区域强劲与否。 供需区域用作警报触发器
CBT Quantum Maverick 高效的二元期权交易系统 CBT Quantum Maverick 是一款精心设计的高性能二元期权交易系统,专为追求精准、简单和纪律的交易者打造。无需自定义,该系统经过优化,可直接使用并产生高效结果。只需遵循信号操作,稍加练习即可掌握。 主要特点: 信号精准度: 基于当前K线生成下根K线交易信号,无频繁重绘。 市场多样性: 专为二元期权交易设计,兼容多种经纪商和资产类别,适应不同交易偏好。 兼容性: Deriv Synthetic Charts :适用于任何时间框架。 OTC Charts :来自如 Quotex、PocketOption、Binomo、Stockity、IQOption、Exnova、OlympTrade、Deriv、Binolla 和 Homebroker 的经纪商,可导入 MT5(一周内提供免费导入支持,之后需支付服务费用)。 外汇、加密货币和商品市场 :扩展资产利用。 高收益二元资产 :建议使用90%以上的高回报率资产。 额外优势: 全面的交易计划: 提供系统化和纪律性交易的分步支持计划。 高效时间利用: 每天
PZ Trend Trading MT5
PZ TRADING SLU
4 (4)
许多盈利交易者不仅知道如何识别市场趋势,而且也能把握趋势建立后的交易机会。 Pz 趋势交易 指标设计用来在趋势行情中尽可能的赚取利润。 已建立的趋势提供了一揽子交易机会,但大多数趋势交易指标完全忽视了它们,让交易者在趋势行情时完全不知道该如何做!一般趋势指标只通知有关的趋势变化,但根本不足以得到卓越的回报. Pz 趋势交易 指标比一般趋势指标显示多达 20 倍的交易 , 因为它注重所谓的市场时机。它不仅显示当前的市场趋势,也有回调,内柱线的突破和调整。它令您在趋势回调之后介入,安全的柱线内突破金字塔加仓,以及发现潜在的反转,和已知的调整。 趋势改变 一个趋势改变在市场方向变化时发生。趋势变化在图表上用带数字的彩色圆圈显示。蓝色 (1) 信号为上涨开始, 而红色 (1) 信号为下跌开始。趋势变化并非评估当前价格动作的结果, 它意味着交易设置是不定时地。如果您正确使用本指标, 在趋势变化时, 您将将已经入场 (参看下面的调整)。 回调 但凡趋势在运动中,行情上下抖动,盈利者收割利润,且其它参与者入场。趋势回调代表好的买入机会,通常是由主力获利离场导致。如果行情在回调后回归上行, 指
Market Overview MT5
Mehran Sepah Mansoor
使用我们的市场强度和情绪指标优化您的交易决策,不再逆势交易! 我们的指标专为重视准确及时信息的严肃交易者精心设计,以非常简单的方式提供 28 种主要货币对的鸟瞰图。该工具可根据货币对的受欢迎程度、看涨或看跌趋势的强度以及买方和卖方的百分比 (MT4 版本) 对货币对进行排名。 功能特点 实时趋势强度: 准确评估每种货币对的趋势强度,为识别交易机会提供可靠指导。 买卖双方分析: 通过我们对每种货币对的买卖双方实力排名,即时洞察市场动态,让您预测重要走势。 交易者兴趣: 获取每种货币对的交易者兴趣和活动数据,帮助您更好地了解新兴趋势和潜在转折点。 直观且可定制的仪表盘: 我们的仪表板易于使用,您可以根据自己的喜好自定义显示,让您对相关信息一目了然。 实时更新: 实时更新让您随时了解市场变化,确保您不会错过任何有利可图的机会。 指标栏 Symbol:  点击此栏,符号将按字母顺序排序。 Popularity:  点击此栏,将按照交易者对该交易货币对的兴趣顺序进行排序。 Strength:  点击此栏,货币对将按照趋势排序(正数表示上升趋势,负数表示下降趋势)。 Bu
ON Trade Gann Squares MT5
Abdullah Alrai
5 (2)
Gann 方块指标是一种强大的市场分析工具,基于 W.D. Gann 在其“市场预测数学公式”一文中介绍的数学概念。该指标融合了与平方数(如 144、90 和 52)有关的 Gann 技术,以及平方 9。此外,它还融入了  关于如何将平方 9 与通道和星形图案结合使用的方法。 用户手册和使用方式: 在使用该指标之前,我们建议您阅读用户手册,并与我们联系以获得任何澄清。您可以在我们的网站上找到完整的用户手册。 该指标提供了 MT5 的完整版本供购买,也提供了 MT4 的免费版本供测试。提供了两个版本的链接供您方便使用。 主要特点和功能: Gann 方块指标为您的交易环境提供了全套工具,使您能够基于几何图案和 Gann 的概念做出明智的决策。以下是主要特点: 平方 9 分析:   该指标可以绘制与平方 9 有关的各种元素,包括水平线、星形图案、网格、Gann 扇形等。这在您的图表上提供了 Gann 的几何概念的视觉表示。 Gann 方块:   该指标绘制了 Gann 方块 52、90 和 144,使您能够可视化和分析它们与价格走势的关系。 自由 Gann 星形图案:   该指标使您能够直接
Golden Spike Premium
Kwaku Bondzie Ghartey
Golden Spikes Detector Acknowledgement and Dedications:  The name of this indicator was Inspired by an Original; Mr Grant Koopman; a Knowledgeable and experienced Synthetics trader. I dedicate this indicator to Mr Grant.  Overview:   The Golden Spikes Premium is a groundbreaking trading indicator meticulously crafted for the Boom and Crash indices on the Deriv market. Tailored to meet the needs of discerning traders, this powerful tool operates exclusively on the one-minute timeframe, providing
作者的更多信息
MACDmaxmin free demo
Carlos Andrés Moya Erazo
5 (3)
The indicator shows when there are overpricing and divergences over a normalized MACD Plus, it displays signals with configurable alerts, self-regulating dynamic overprice levels, and a simple setup and interface. This indicator automatically calculates markup ranges. MACDmaxmin is an indicator based on the MACD oscillator that effectively identifies trend changes in price, as it is a momentum indicator that captures the trend and shows the relationship between two moving averages of the price.
FREE
MACDmaxmin
Carlos Andrés Moya Erazo
3 (2)
The indicator shows when there are overpricing and divergences over a normalized MACD Plus, it displays signals with configurable alerts, self-regulating dynamic overprice levels, and a simple setup and interface. The indicator that automatically calculates overprices ranges! MACDmaxmin is an indicator based on the MACD oscillator that effectively identifies trend changes in price, as it is a momentum indicator that captures the trend and shows the relationship between two moving averages of th
筛选:
jerome1677
260
jerome1677 2024.01.28 03:54 
 

rented this indicator and installed it but it does show upon my MT5 and i have not received ant assistance from the seller. if that changes so will the review but 1 star until otherwise

José Fábio RP
125
José Fábio RP 2023.10.26 16:23 
 

I have to say this indicator is wonderful. Thanks for working on it.

Aravind Kolanupaka
9050
Aravind Kolanupaka 2023.10.23 19:18 
 

Good indicator

odymt5
175
odymt5 2021.10.05 13:54 
 

Thank you for an excellent indicator, easy to use.

Welber Goncalves
402
Welber Goncalves 2021.08.03 23:17 
 

O meu está com problema, pois configuro para somente emitir sinal de sobrecompra ele emite sinal de sobrevenda e viceversa.

Carlos Andrés Moya Erazo
5313
来自开发人员的回复 Carlos Andrés Moya Erazo 2021.08.05 04:33
Saudações, lamentamos o transtorno.
Encontramos o problema e o corrigimos, esperamos que o produto atenda aos seus objetivos. Obrigado por nos ajudar a melhorar.
Êxitos!
Marsterp Marcel
25
Marsterp Marcel 2021.04.19 15:39 
 

Hi i didnt receive my RSImaxmin

Paul Bell
148
Paul Bell 2021.04.05 10:41 
 

very useful product

teodomiro
74
teodomiro 2021.02.06 18:43 
 

it´s good but I have rent the product again but i cannot download it again. could you pls help me with this ...

baraka fadi
56
baraka fadi 2020.12.04 16:02 
 

The best indicator ever, precious tool, Thank you

Pavel Shirykalov
241
Pavel Shirykalov 2020.11.10 08:22 
 

Thank you, an interesting indicator, I'm waiting for an expert

Claudio Jones
167
Claudio Jones 2020.06.09 16:25 
 

Very useful and accurate indicator when making a decision. Carlos Moya provides quality support. I'm happy with the results. Thanks a lot

Dunstan Wafula Namusonge
851
Dunstan Wafula Namusonge 2020.04.09 05:34 
 

Very resourceful

回复评论
版本 3.4 2022.03.09
Performance update 2022
版本 3.3 2021.08.14
Overbought and oversold alarm override correction.
版本 3.2 2020.09.08
Resource Optimization
版本 3.1 2020.07.27
New Functions, Trend Arrows on Chart, RSI Signal Enhancement
版本 3.0 2020.07.16
New overpricing indicator included.
版本 2.15 2020.06.19
Optimization of resources and minimum programming corrections.
版本 2.14 2020.06.08
compatibility issues fix.
版本 2.13 2020.06.08
Resource Optimization and minimal programming fixes.
版本 2.0 2020.05.02
Display of divergence points (trend change indicator).
版本 1.50 2020.05.02
Optimization of resources, more intuitive presentation of values.
版本 1.10 2020.04.25
Resource Optimization.