Fibonacci Doppler MT5
- 指标
- Leonid Basis
- 版本: 4.8
- 更新: 23 五月 2020
- 激活: 5
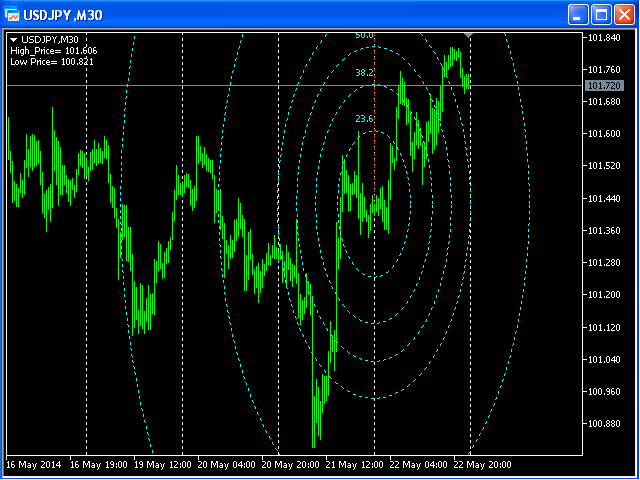
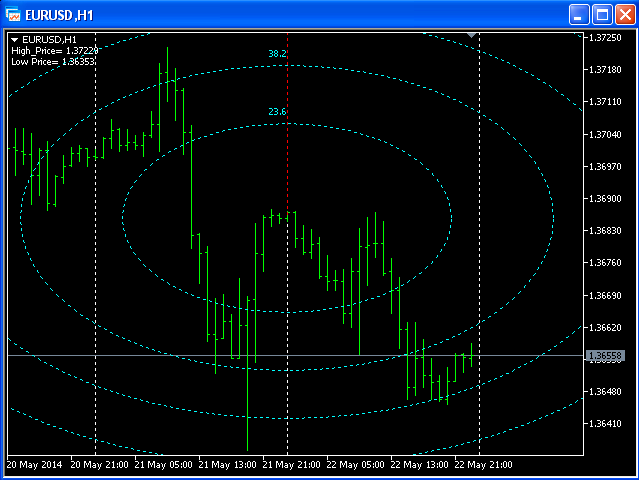
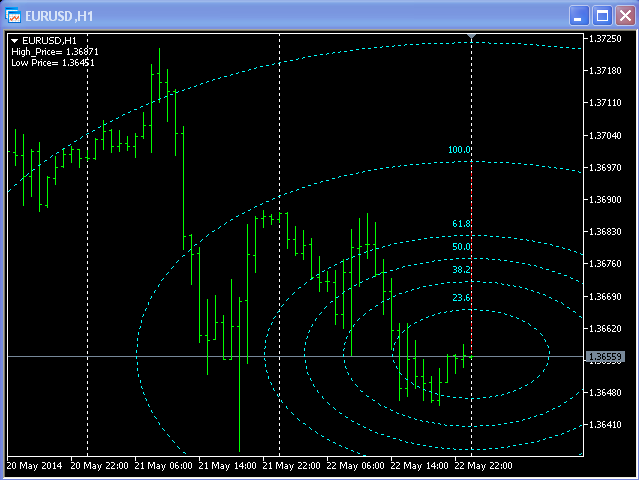
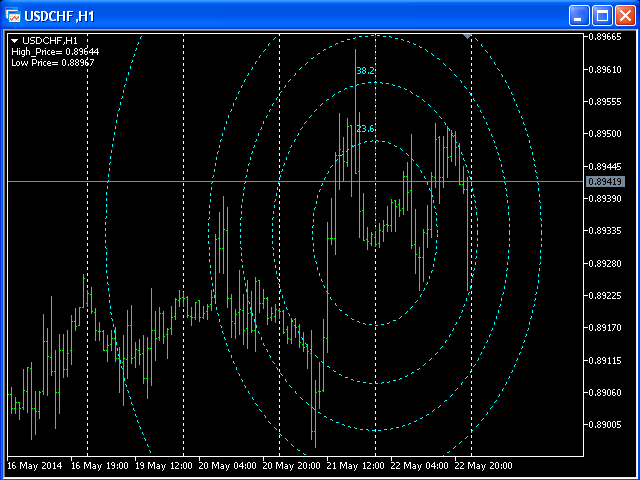
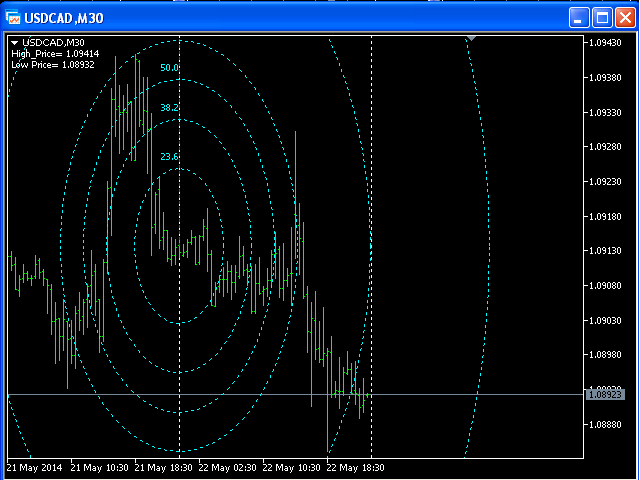
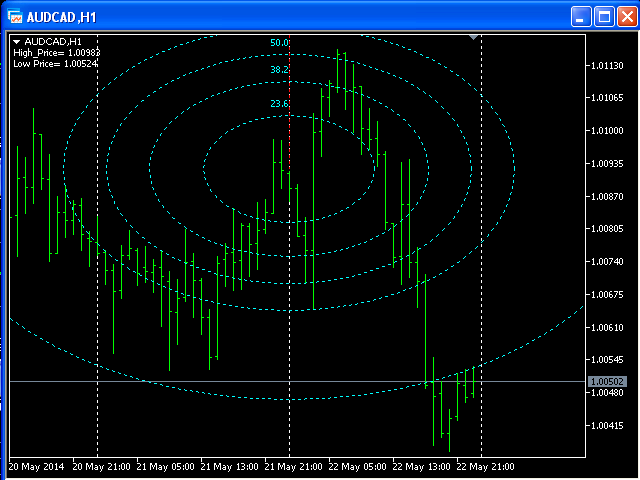
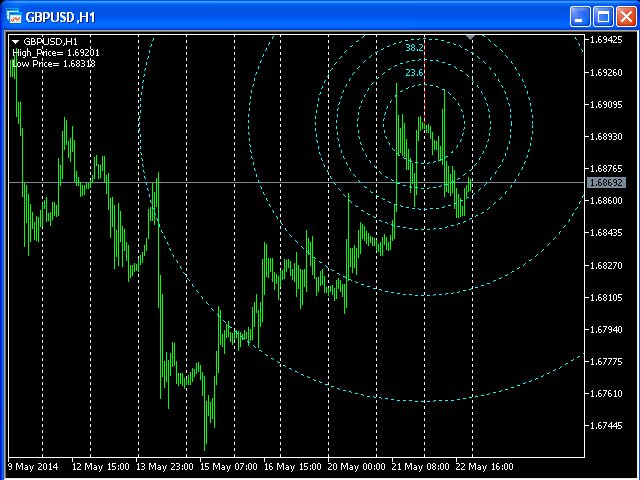
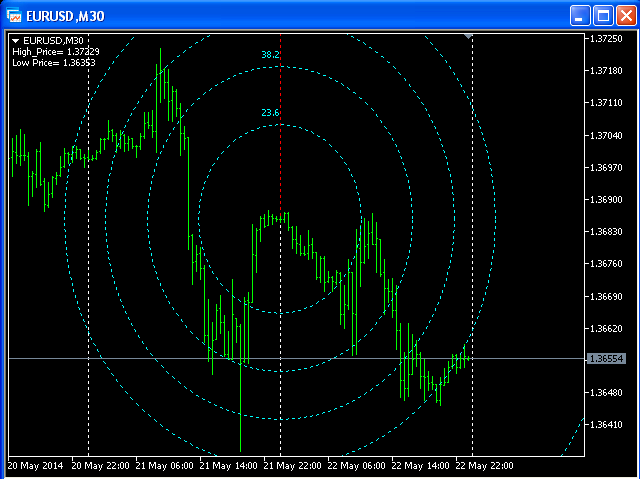
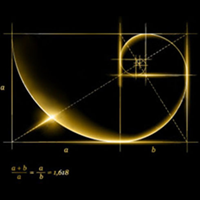
Fibonacci Arcs in the full circles are based on the previous day's candle (High - Low).
These arcs intersect the base line at the 23.6%, 38.2%, 50%, 61.8%, and 78.6%. Fibonacci arcs represent areas of potential support and resistance.
Reference point - the closing price of the previous day.
These circles will stay still all day long until the beginning of the new trading day when the indicator will automatically build a new set of the Fibonacci Arcs.
