Wolfe Scanner Pro
- 指标
- Noiros Tech
- 版本: 1.5
- 更新: 22 一月 2024
- 激活: 5
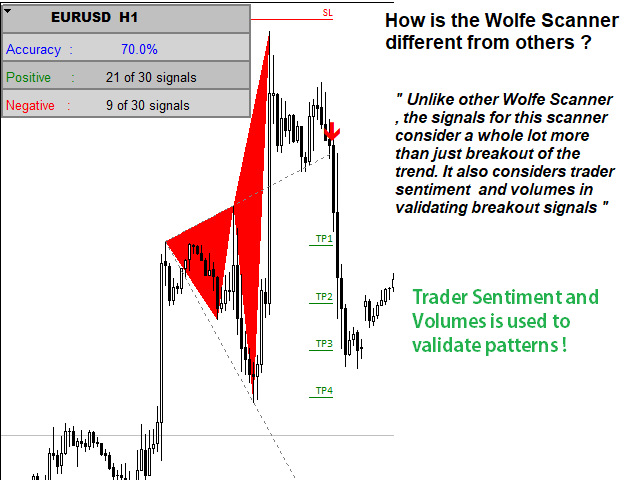
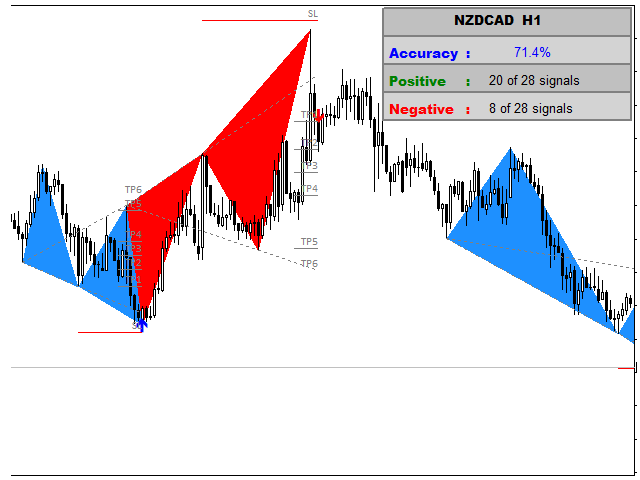
WOLFE WAVE PATTERNs
First discovered by Bille Wolfe . The wolfe wave is a 5 wave price action pattern that is formed by supply and demand in a market and the fight to reach equilibrium in the market. The entry spot of the pattern is defined by the breakout of the trend created by wave 1 and wave 3 . This pattern forms in any market where there is supply and demand thus it can also be used to trade commodities and stocks. Wolfe Waves are reversal patterns that usually carry a low risk margin.
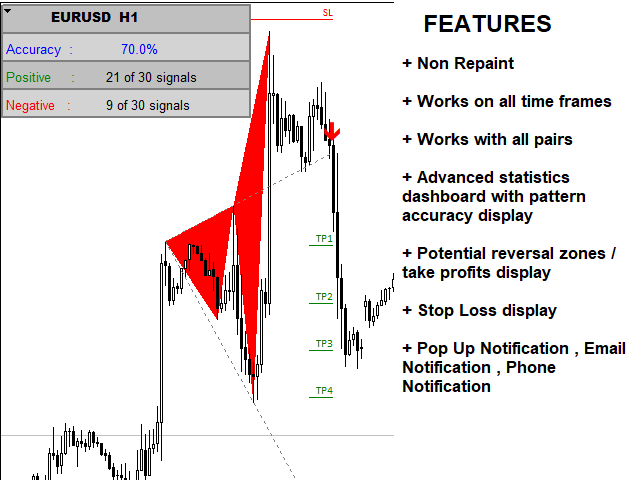
Product Features
- The Pattern Signals are non-repaint
- The product scans Wolfe wave patterns on any time frame and currency pair.
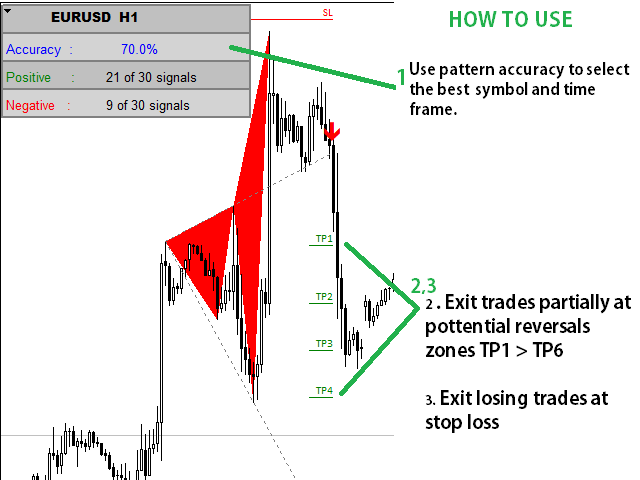
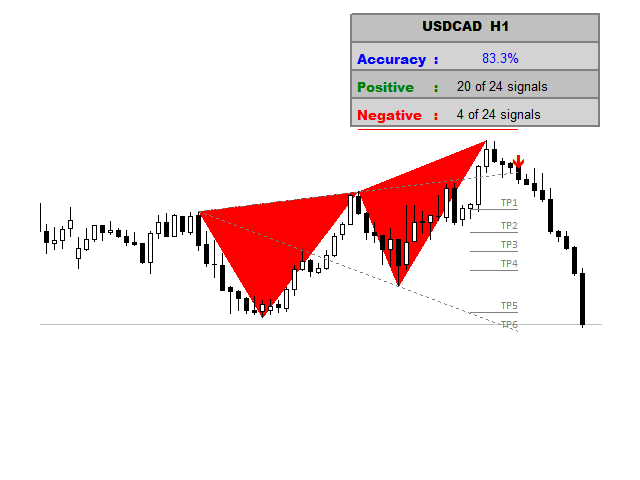
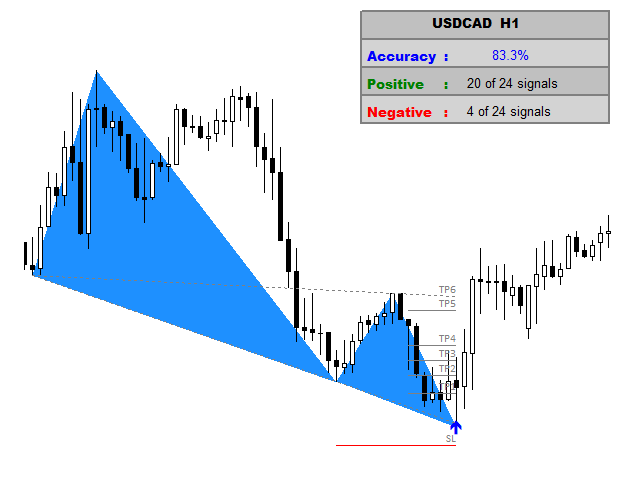
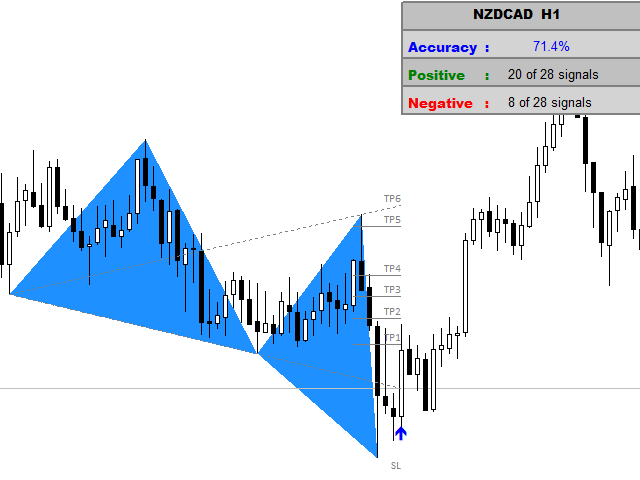
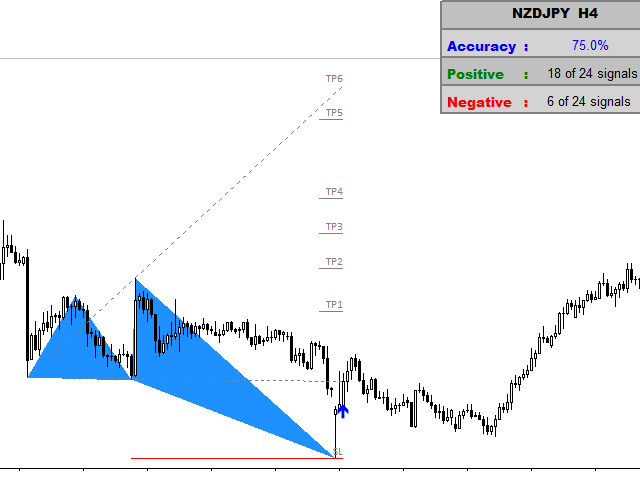
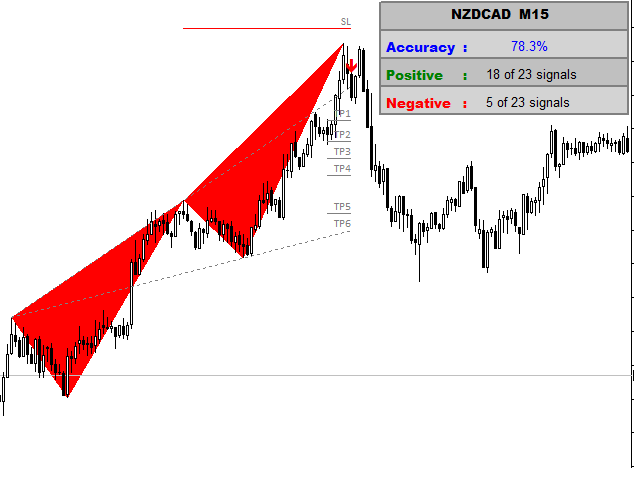
- It comes with a statistics dashboard that shows pattern accuracy.
- Each pattern has a stop loss and 5 Fibonacci targets .
- The scanner also comes with a notification system for when patterns are formed.
INPUTs
- Scan Range : Numbers of history bars to scan
- Pattern Period : Used to define pattern points, lower period will scan closer pattern points
- TP1 : First Target Fibonacci Ratio
- TP2 : Second Target Fibonacci Ratio
- TP3 : Third Target Fibonacci Ratio
- TP4 : Fourth Target Fibonacci Ratio
- TP5 : Fifth Target Fibonacci Ratio
- TP6 : Sixth Target Fibonacci Ratio
- Pop Up : Pop Up Alert
- Email : Email Alerts
- Phone : Phone Notifications
YOU CAN NOW DOWNLOAD FREE VERSIONS OF OUR PAID INDICATORS . IT'S OUR WAY OF GIVING BACK TO THE COMMUNITY !


semble bien fonctionner selon quelques test a voir dans le temps. cependant bon outil merci pour ce travail