PriceProbability
- 指标
- Stanislav Korotky
- 版本: 1.4
- 更新: 29 十月 2019
- 激活: 5
This is an easy to use signal indicator which shows and alerts probability measures for buys and sells in near future. It is based on statistical data gathered on existing history and takes into account all observed price changes versus corresponding bar intervals in the past. The statistical calculations use the same matrix as another related indicator - PointsVsBars.
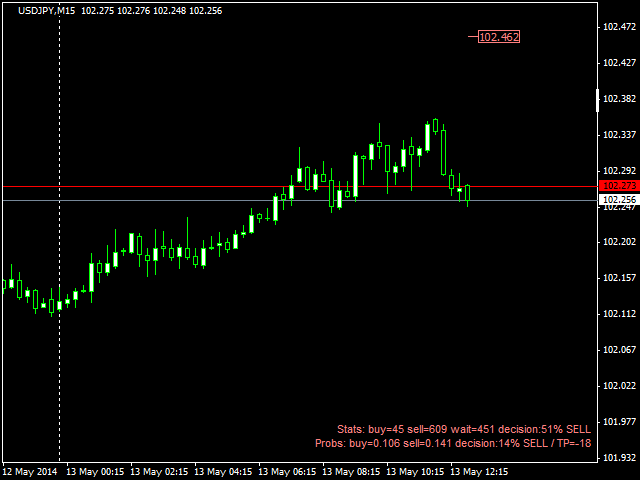
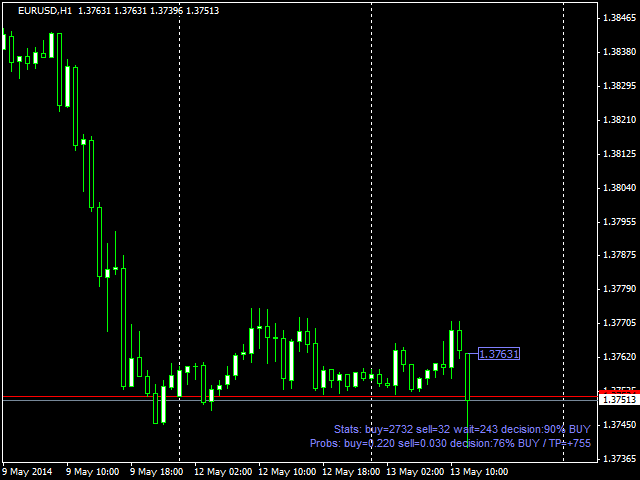
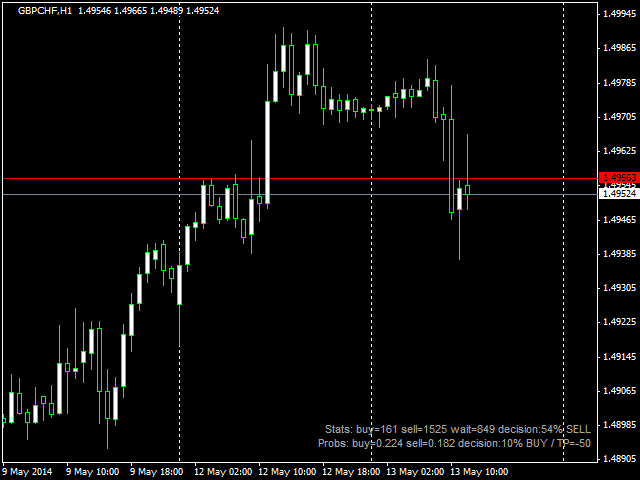
Once the indicator is placed on a chart, it shows 2 labels with current estimation of signal probability and alerts when signal strength exceeds 50%.
The indicator provides 3 signals:
- Plain quantitative measure of buy and sell strengths (Stats line), can be used as a secondary signal, or for aggressive trading;
- Probability measure as a ratio of buy and sell probabilities (Probs line), can be used as a primary signal;
- Suggested trading target in points (TP), can be used as confirming signal - its sign should be positive for buy and negative for sell signals;
Is all signals match each other, indicators shows a price mark for entry. If the probability measure is less than 50%, the mark is placed on a level, where the probability would supposedly become 50% (an opportunity for a pending order). If the measure is over 50%, the mark is placed at open price of 0-th bar.
Depending from signal direction and strength, the color of labels can change: blue (buy), red (sell), pale blue (may be buy), pale red (may be sell), gray (no signal).
It's important to note, that all measures are nondeterministic. Even if a measure counts for almost 100%, this does not guarantee that corresponding price movement does actually occur in near future. Due to the nature of probability, every single signal may behave differently, but overall they conform to general rules. So, in a long perspective the statistical approach yields more wins than losses.
Parameters:
- HistoryDepth - number of bars to use for statistic calculations; by default - 5000; the larger - the better; please, make sure that there are no holes in history for the specified number of bars; minimum value is 1000;
- ForecastDepth - number of bars to use for probability calculation; bar intervals up to ForecastDepth are taken into account; by default - 100; history should contain HistoryDepth plus ForecastDepth bars; NB: only ~1000 bars of history are available in tester at starting point;
- Corner - corner of window where to place indicator's labels; by default - 3 (lower right); other values: 0 - upper left, 1 - upper right, 2 - lower left;
- Mode - mode of calculations; allowed values: 0 and 1; by default - 0;
Indicator can operate in 2 modes, any one selected by Mode parameter. The mode 0 is a default one calculating probabilities in a fairly straight-forward manner: any price change on last ForecastDepth bars is taken into account either for buy or sell hypothesis depending from its sign. The mode 1 is a tricky mode - it handles 2 hypotheses for buy and sell conditions separately, that is only positive changes are taken for buy and only negative for sell. The mode 0 is better suited for medium- and long-term trading, including trends. The mode 1 is better suited for short-term trading on local price oscillations, without a long-lasting trend conditions.
Indicator is calculated on every new bar, it does not process ticks.
Recommended timeframes: intraday M15 - H1 (in the absense of news releases), H4, D1.


用户没有留下任何评级信息