Universal ZigZag on RSI HTF
- 指标
- Aleksandr Martynov
- 版本: 1.1
- 更新: 24 十一月 2019
- 激活: 6
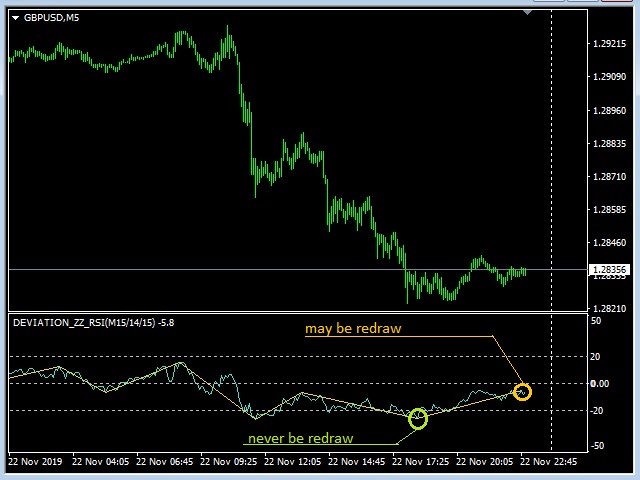
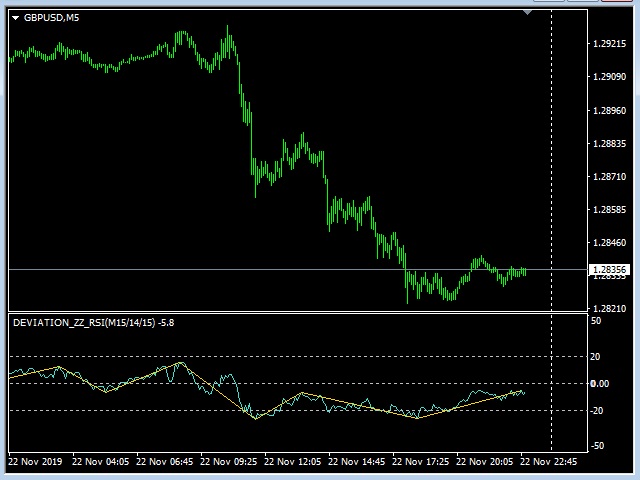
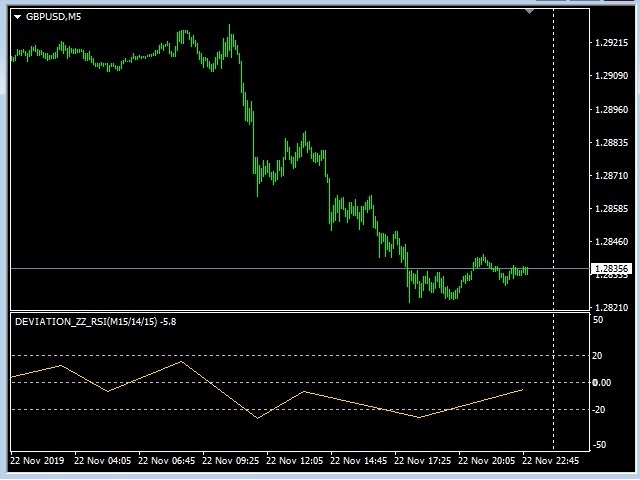
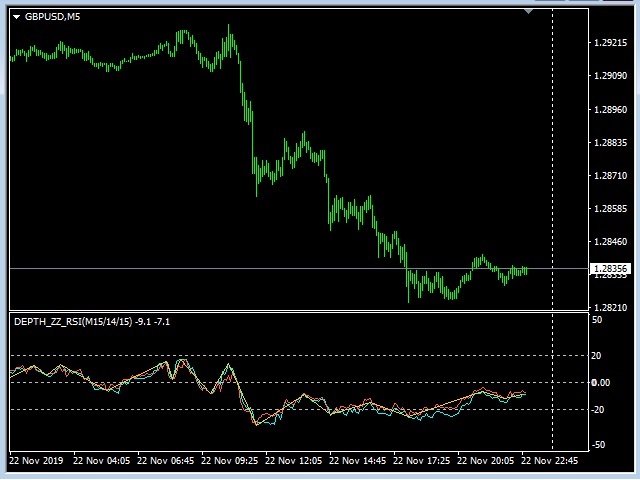
The ZigZag indicator is based on the RSI indicator. This makes it possible to identify significant extremes.
Different calculation options are provided:
- RSI indicator at Close or Hi-Low prices (1 and 2 buffers respectively in OnClose mode - the first buffer, in Hi-Low mode the first buffer at
High price, the second buffer at Low);
- ZigZag indicator by period (standard) or minimal deviation. (The ZigZag indicator values are always in zero buffer.)
If you use a higher timeframe, make sure that the timeframe quotes that does not match the story break can lead to unclear consequences.
Indicator parameters:
Work TimeFrame - time frame for RSI indicator calculation
RSI Period - RSI indicator period
Show RSI? - Display or not the RSI indicator
RSI Price - RSI indicator calculation price (OnClose or OnHiLow)
ZigZag Type - calculation of indicator by period or deviation (OnDepth or OnDeviation)
Deviation or Depth Value - the value of the calculated parameter for the previous point;
RSI Line Width - RSI line thickness, if displayed
RSI on High color - RSI line color, if displayed;
RSI on Low color - RSI line color, if displayed;
RSI on Close color - RSI line color, if displayed;
ZigZag Line Width - ZigZag line thickness
ZigZag color - the color of the ZigZag line
Show Levels? - show or not the levels (the indicator is symmetrical, so the range of level values is 1 to 50), the zero level is
always displayed;
Levels value - the level value.
